Start with the security reports (Full Access Permission Lists, Stale Passwords, Nodes Without Passwords), then review the Security Admin use case for an audit workflow.
If the docs answer what psLens does, the next step is seeing it against a live PeopleSoft environment. The walkthrough is the fastest way to judge fit for your team, your security posture, and your deployment model.
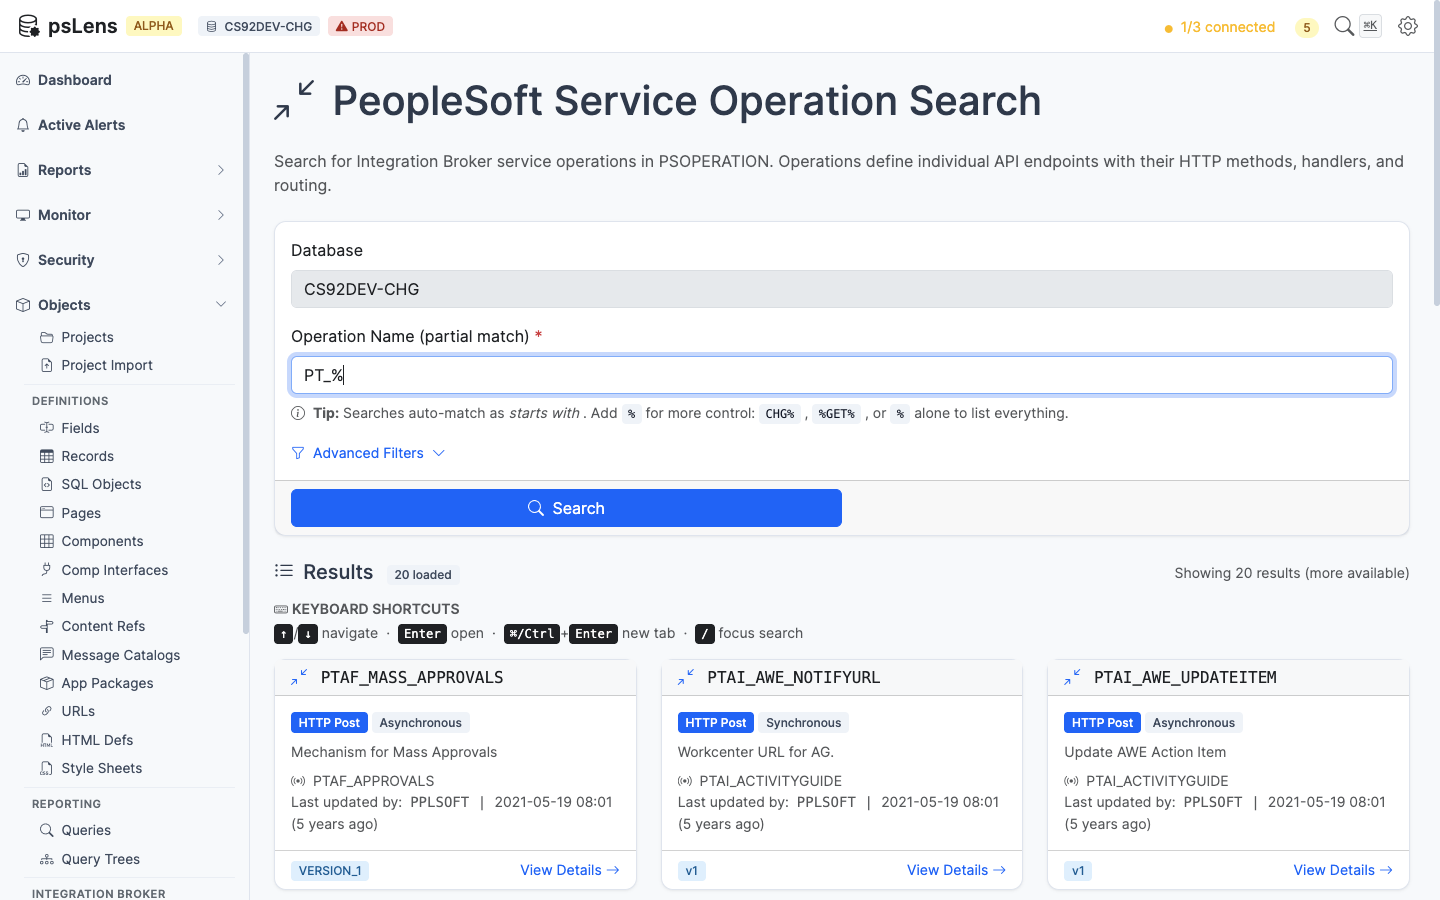
Why PeopleSoft teams use psLens for read-only metadata research, security review, and operational monitoring without broad App Designer or database access.
Read-Only by Design
Broader visibility into PeopleSoft, without broader access.
psLens gives PeopleSoft teams a read-only way to research metadata, review security, and monitor operations without handing out broad App Designer or database access.
It is built for the work that happens around production systems every day: understanding what exists, tracing access, sharing findings, and spotting issues early.
Most PeopleSoft teams use change tools for read-only work. They open App Designer to inspect a record, write SQL to trace security, or refresh Process Monitor and IB Monitor until a problem appears. That works, but it is slow, hard to share, and broader than many team members need.
psLens covers that day-to-day work in a browser. It gives teams one place to research object definitions, run repeatable audit reports, and watch for operational problems that should not wait for the next manual check.
What psLens Changes in Daily Work
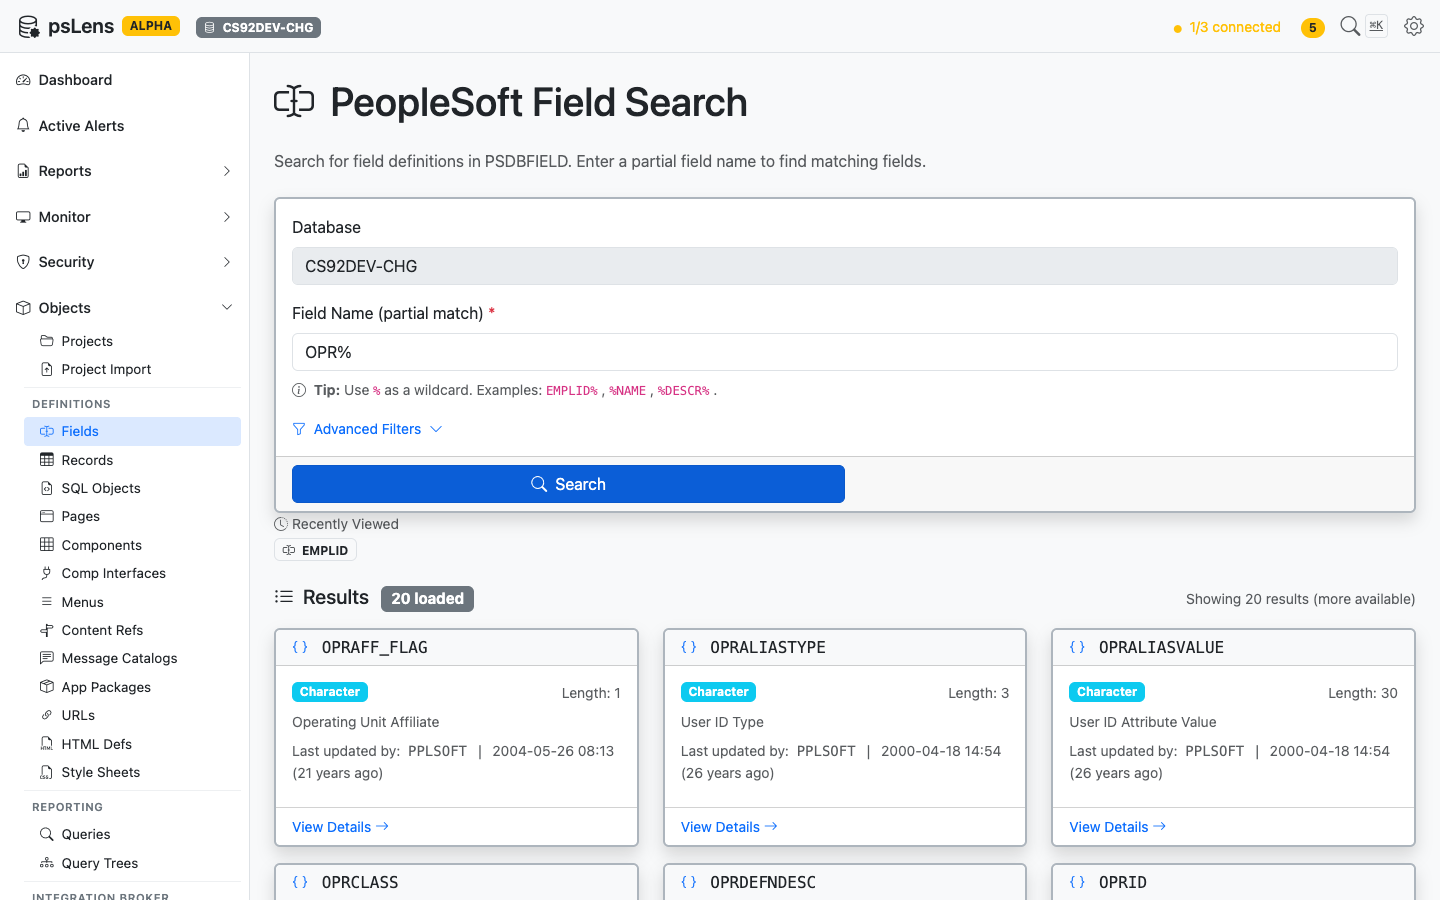
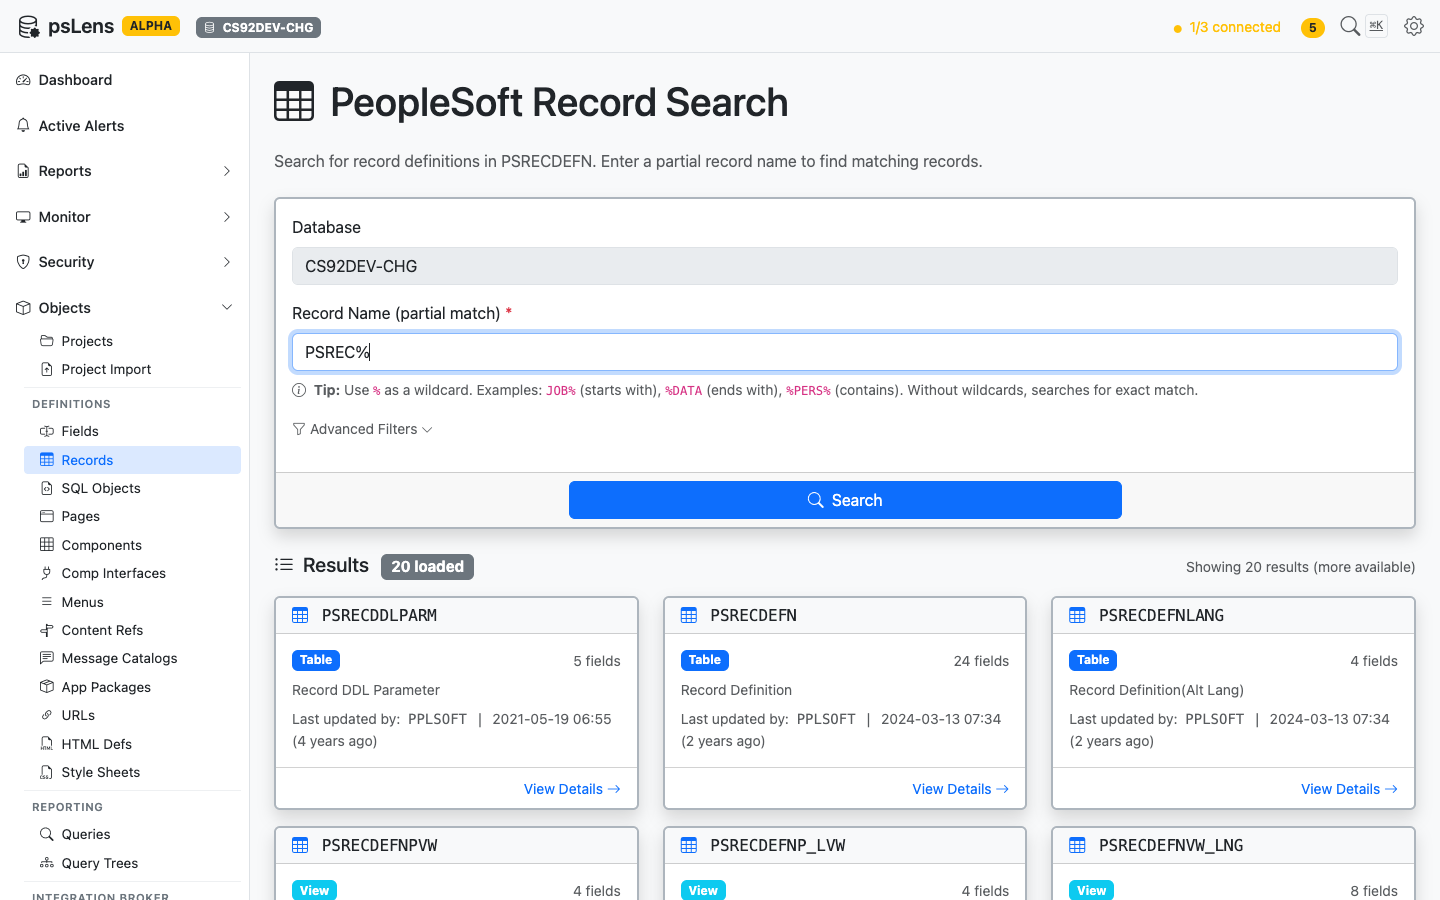
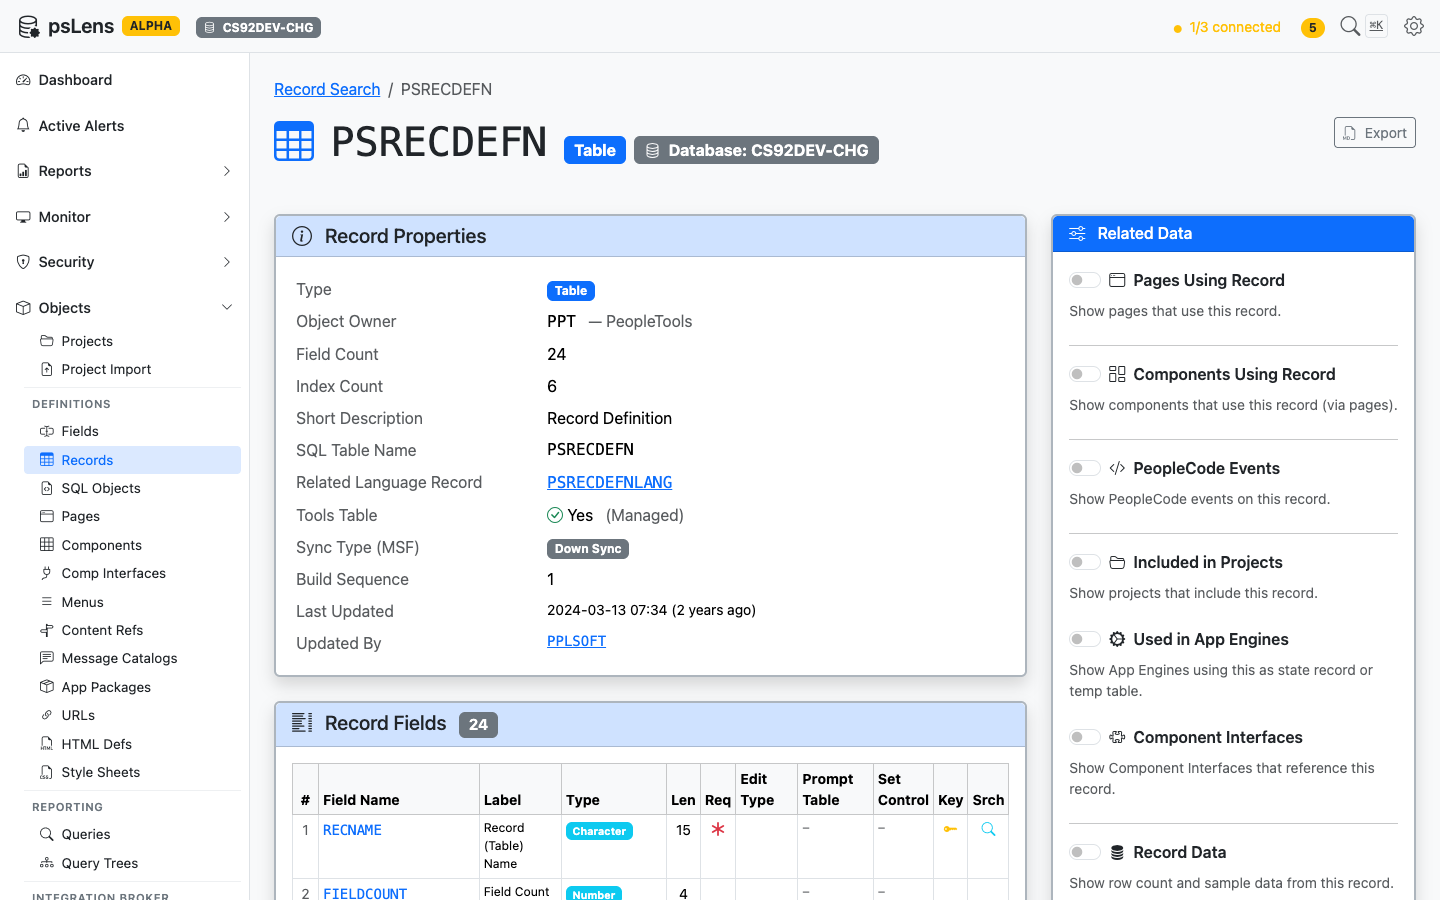
Metadata Research Without App Designer
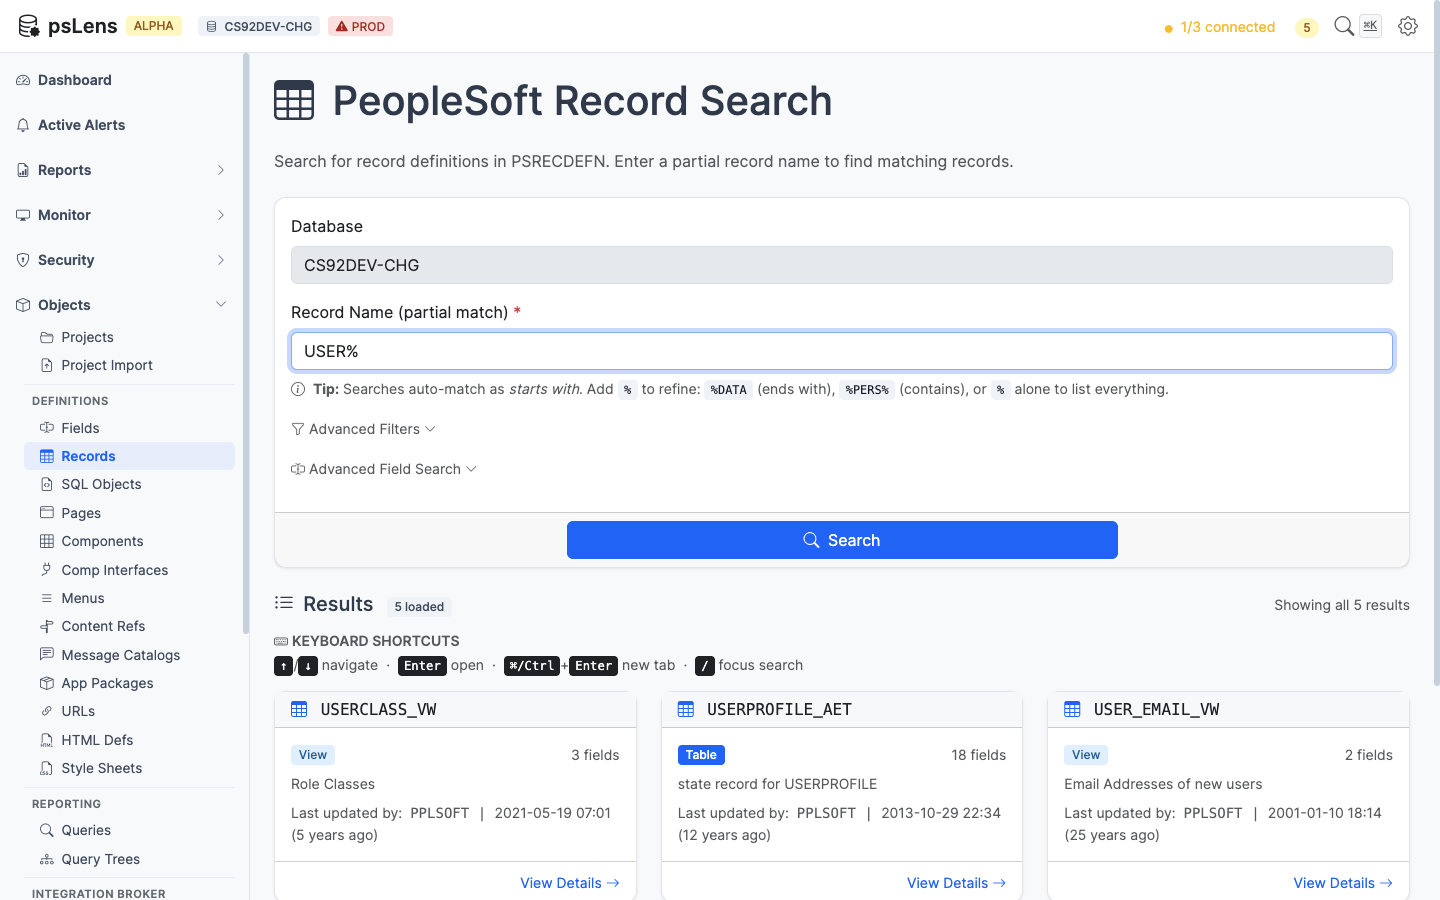
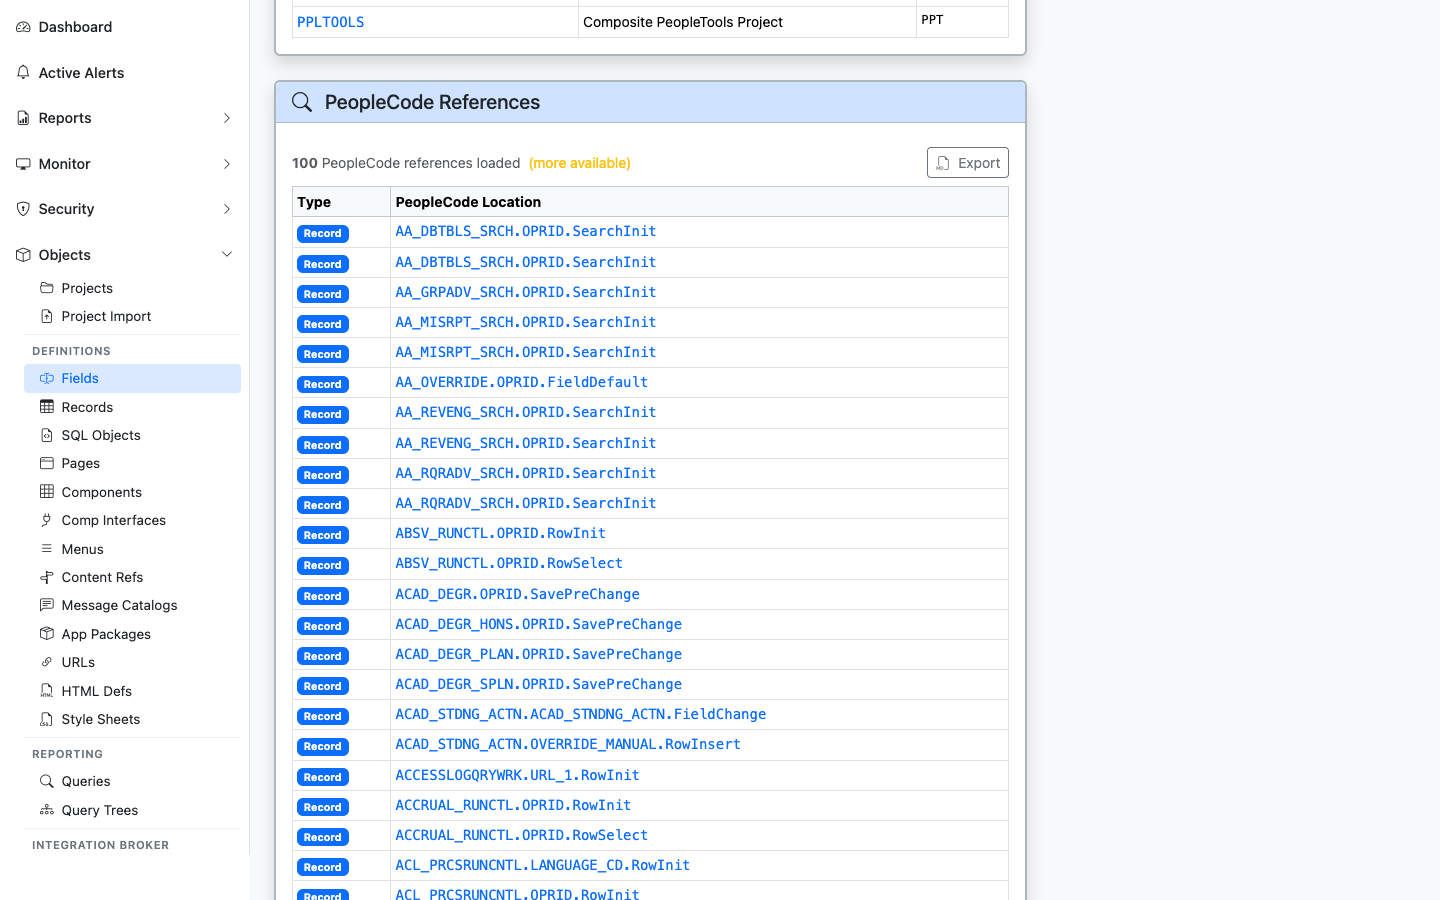
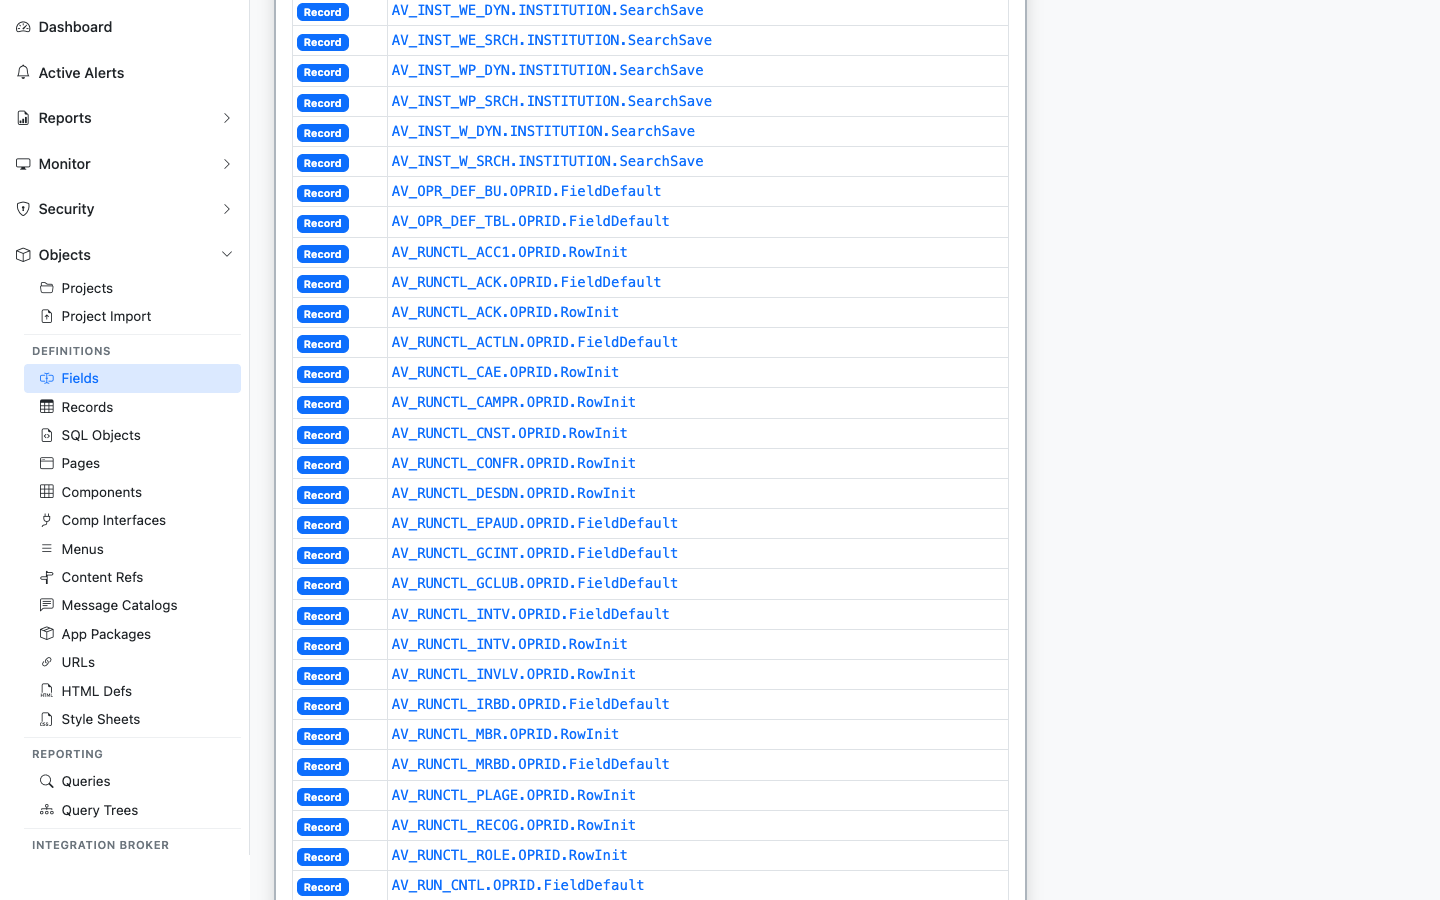
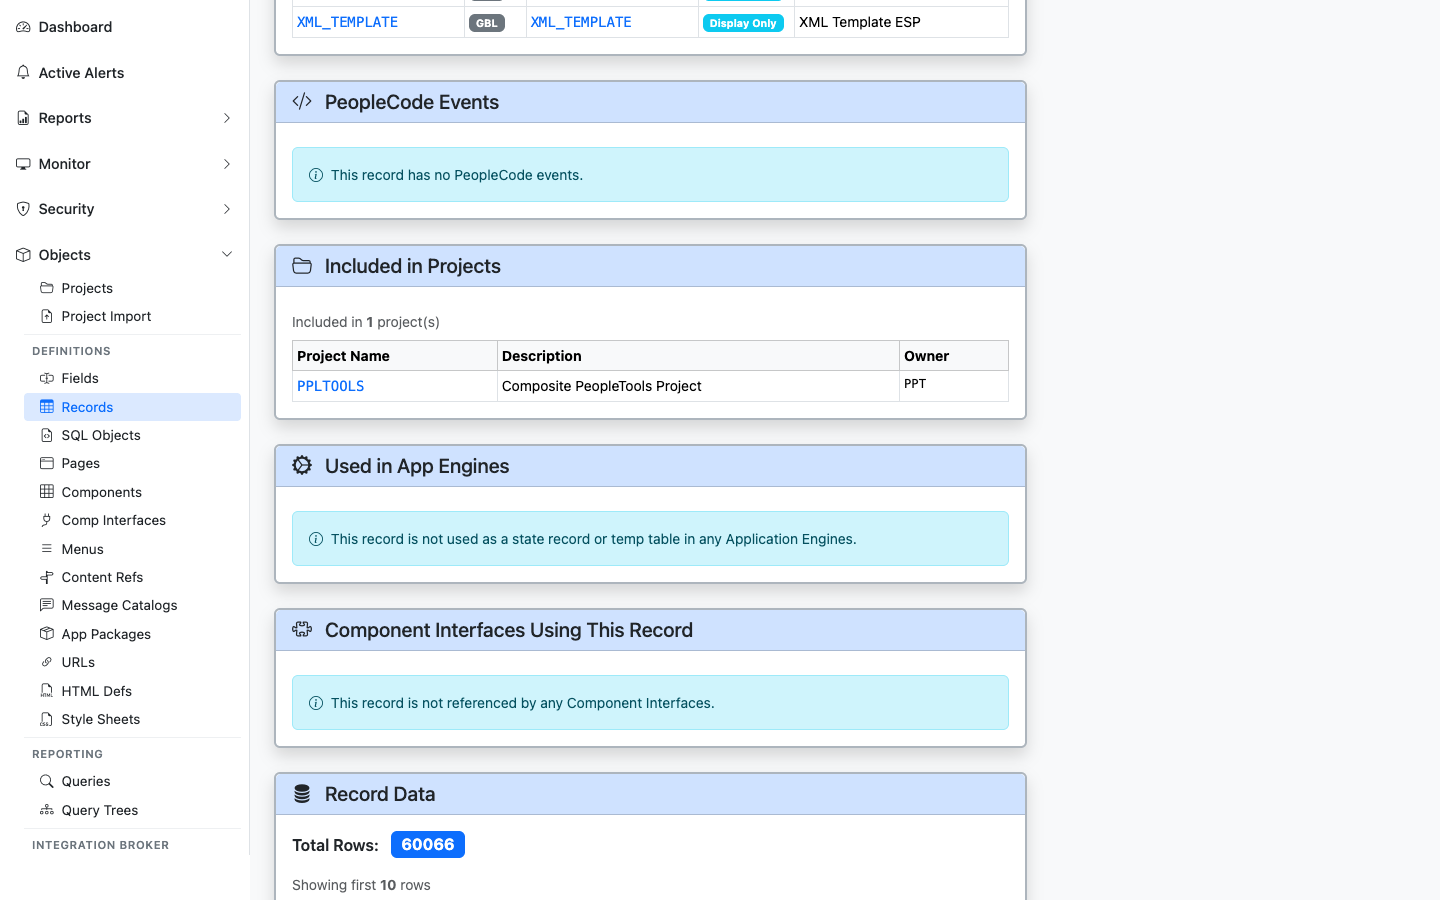
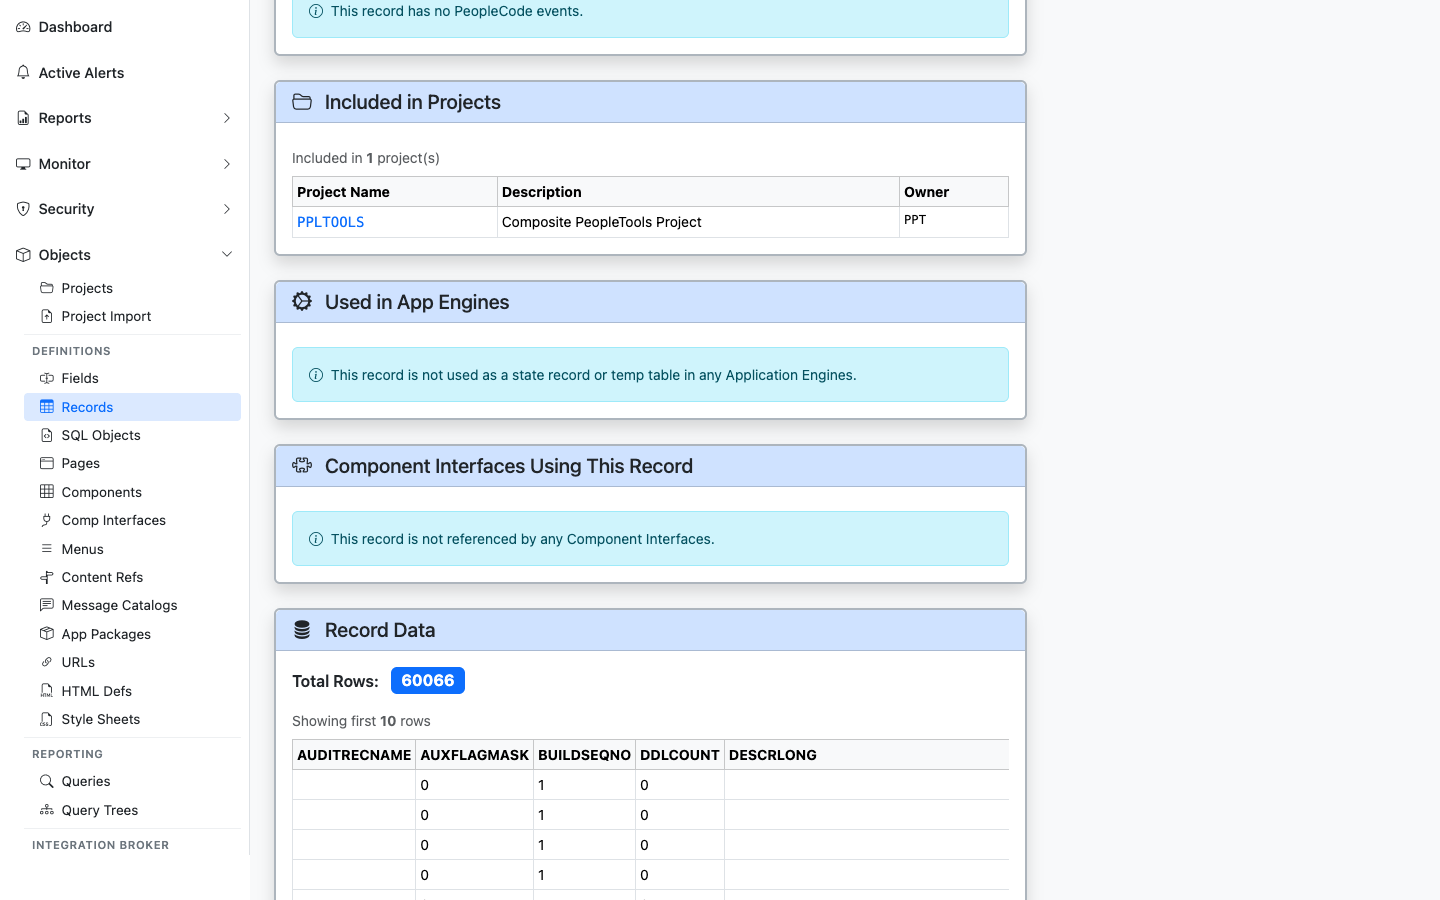
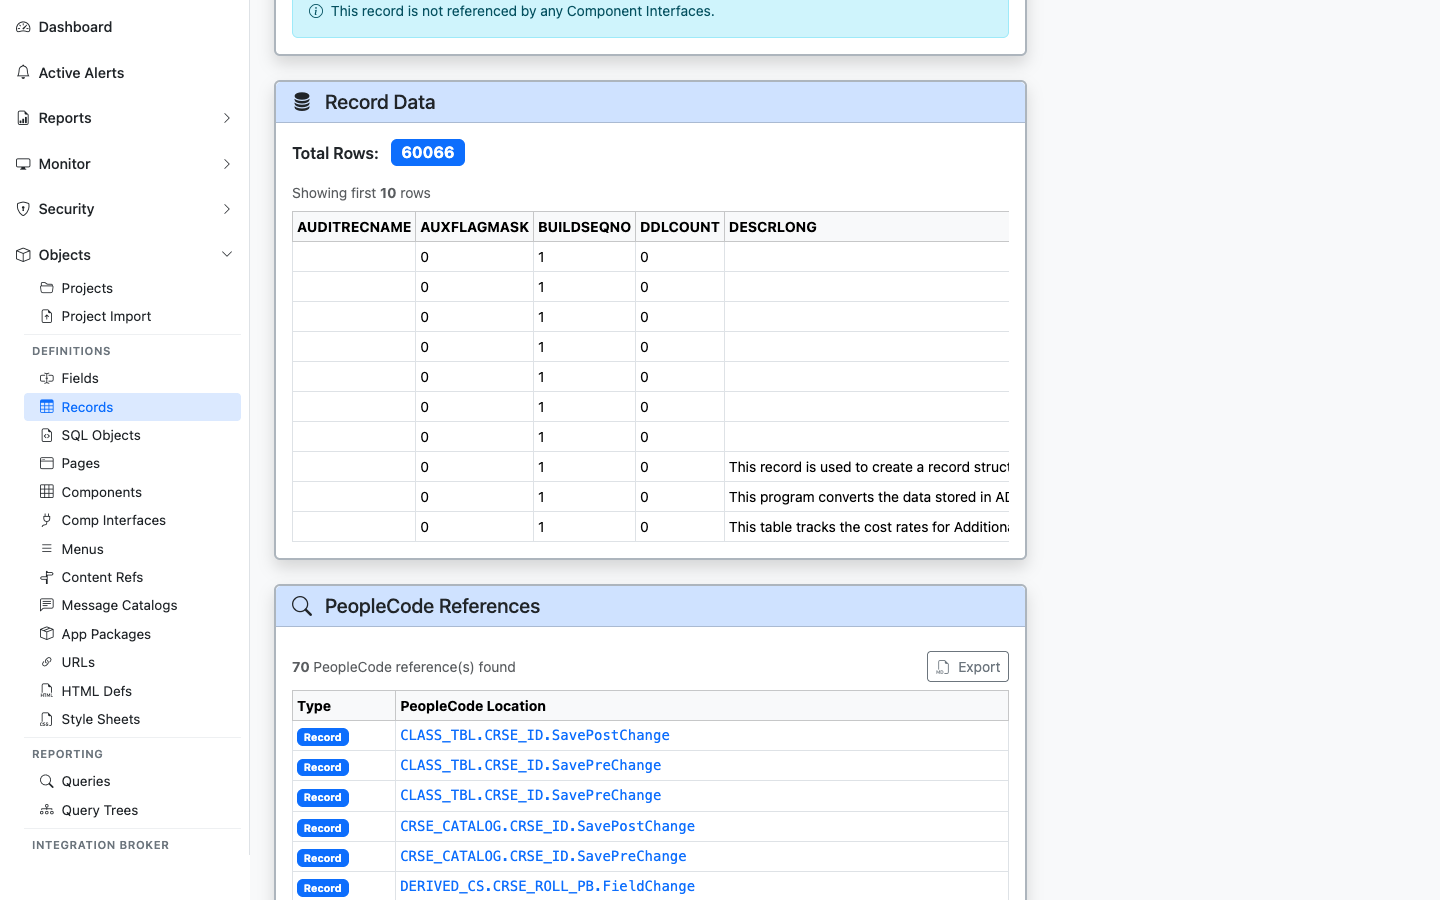
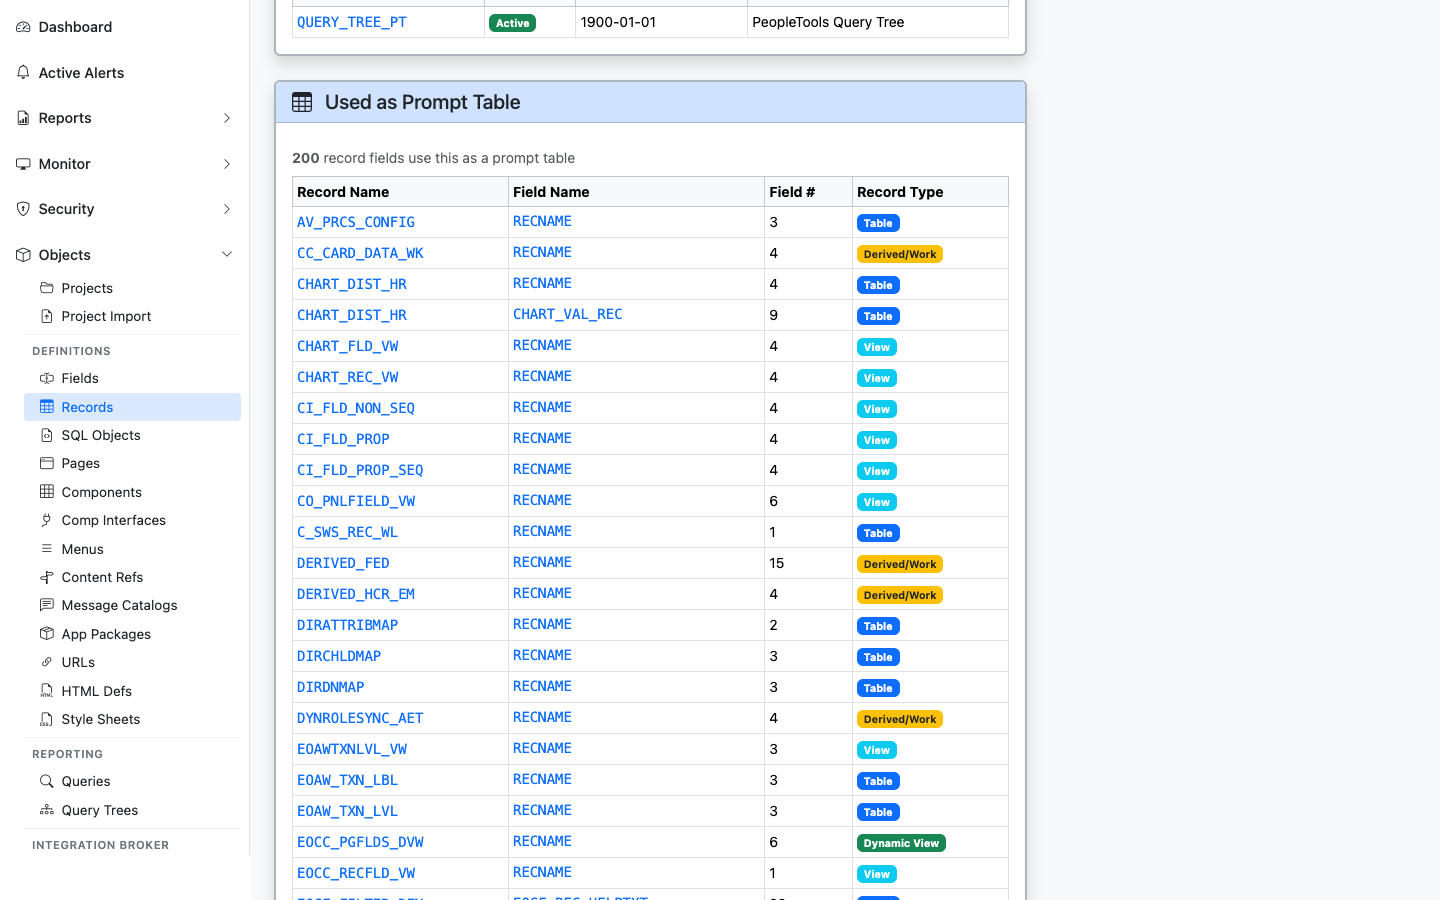
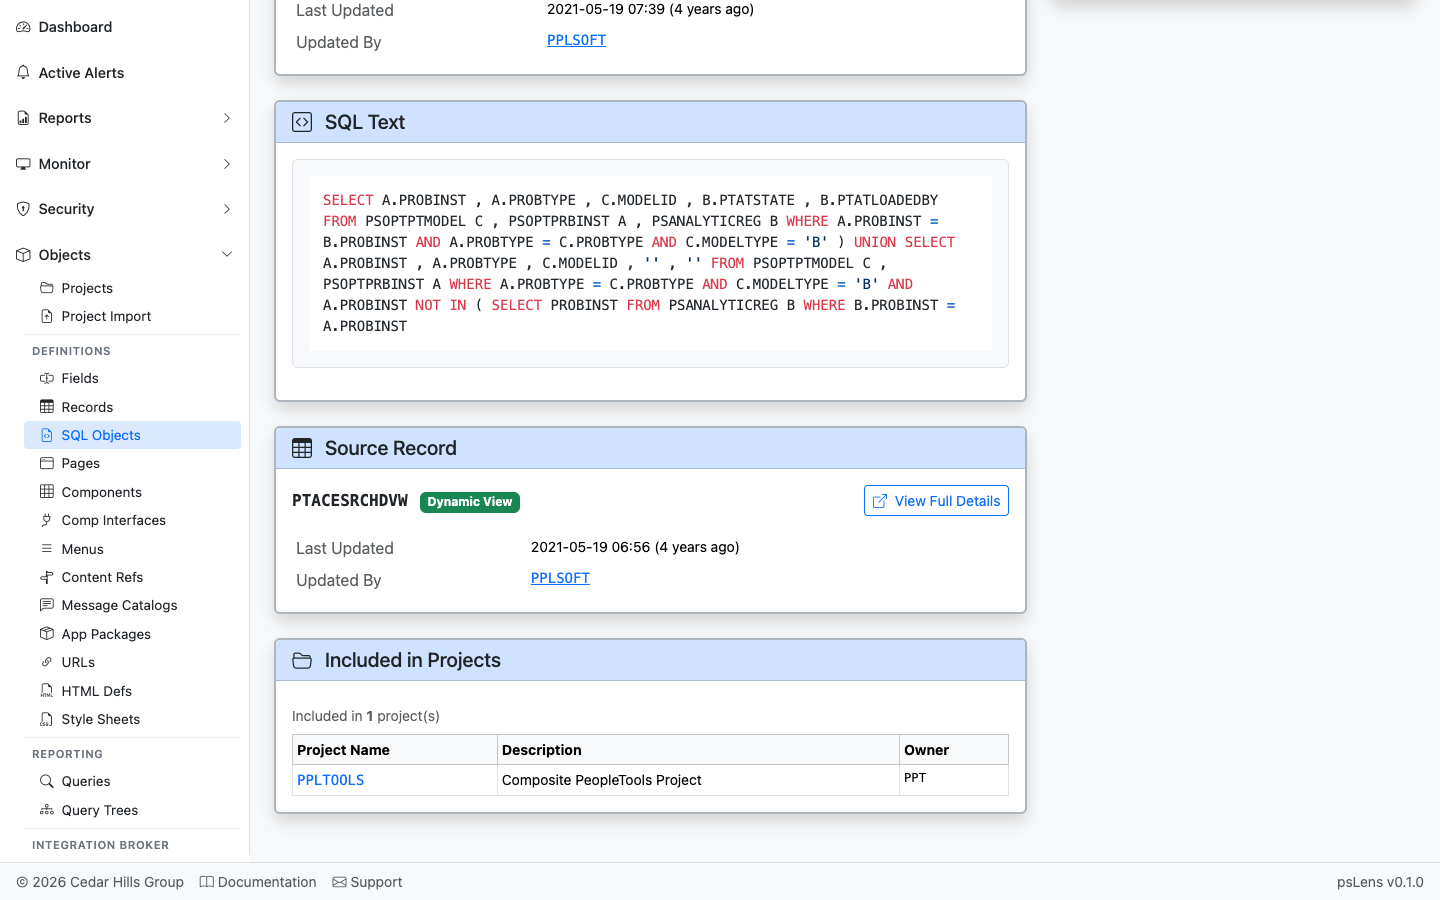
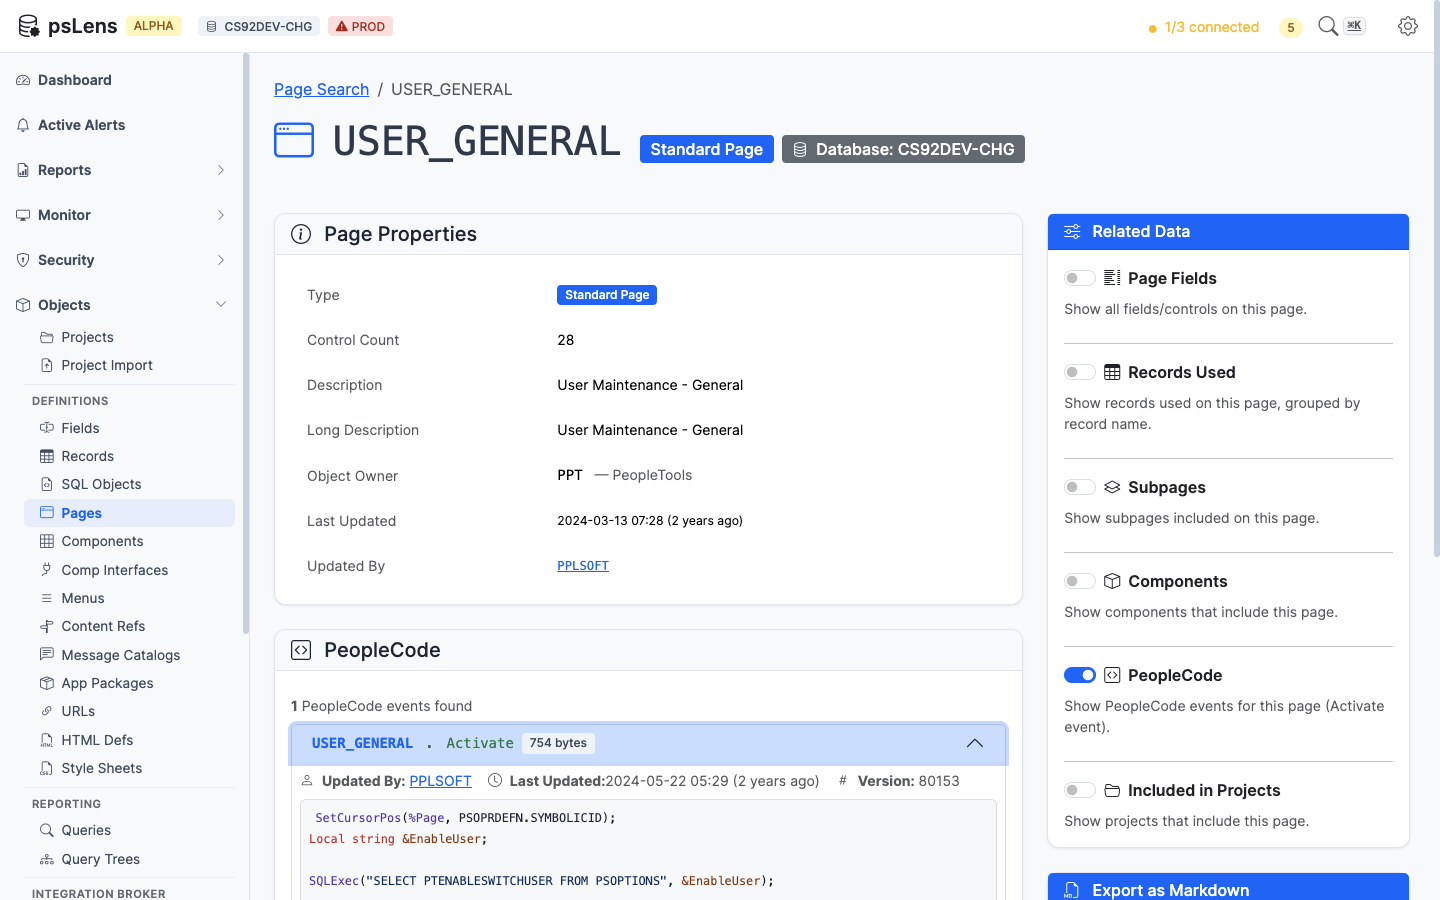
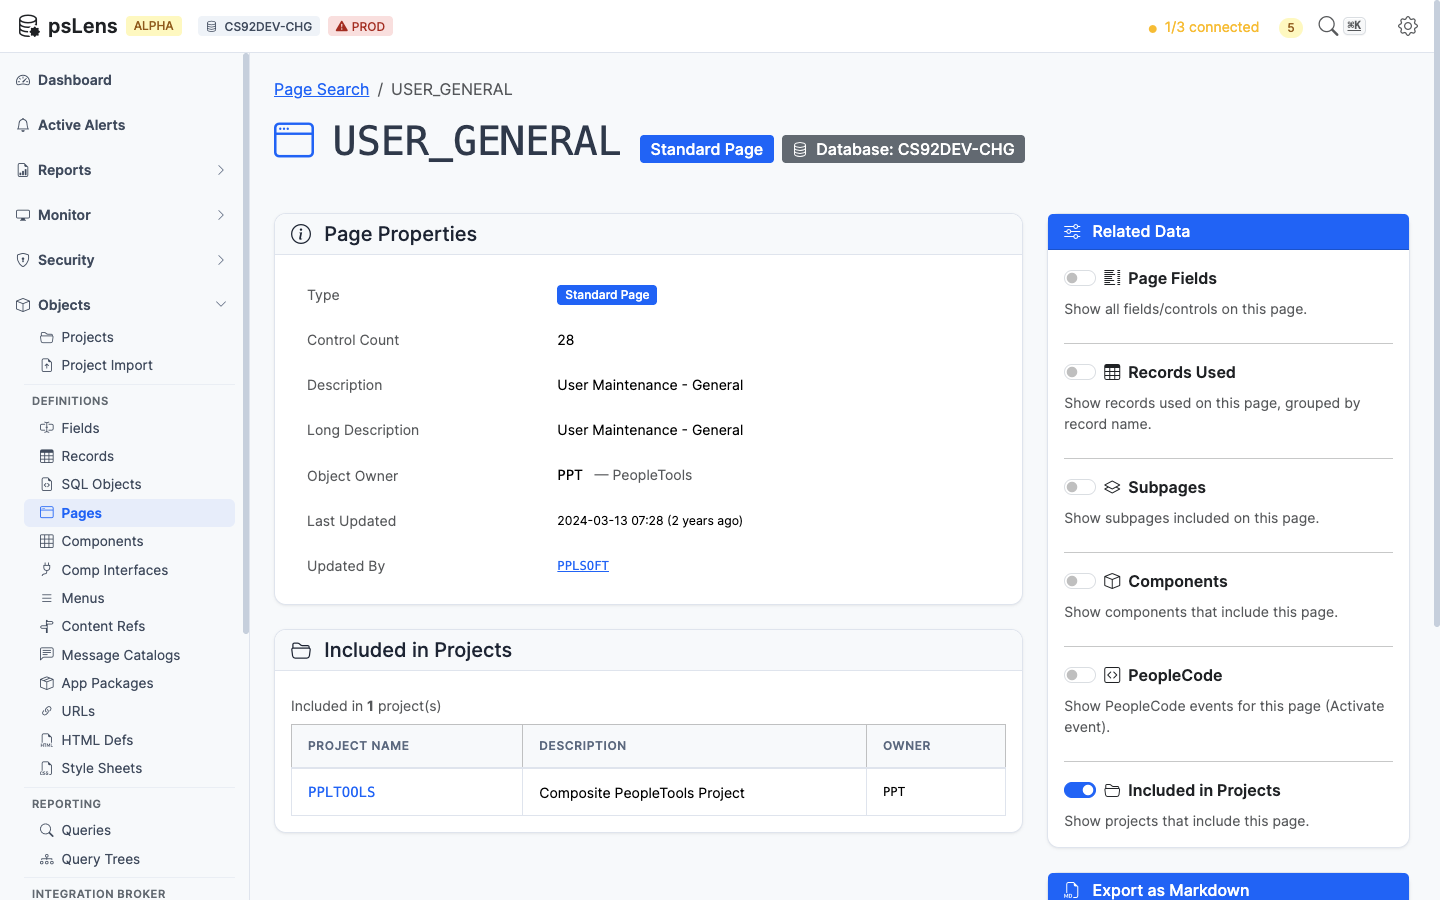
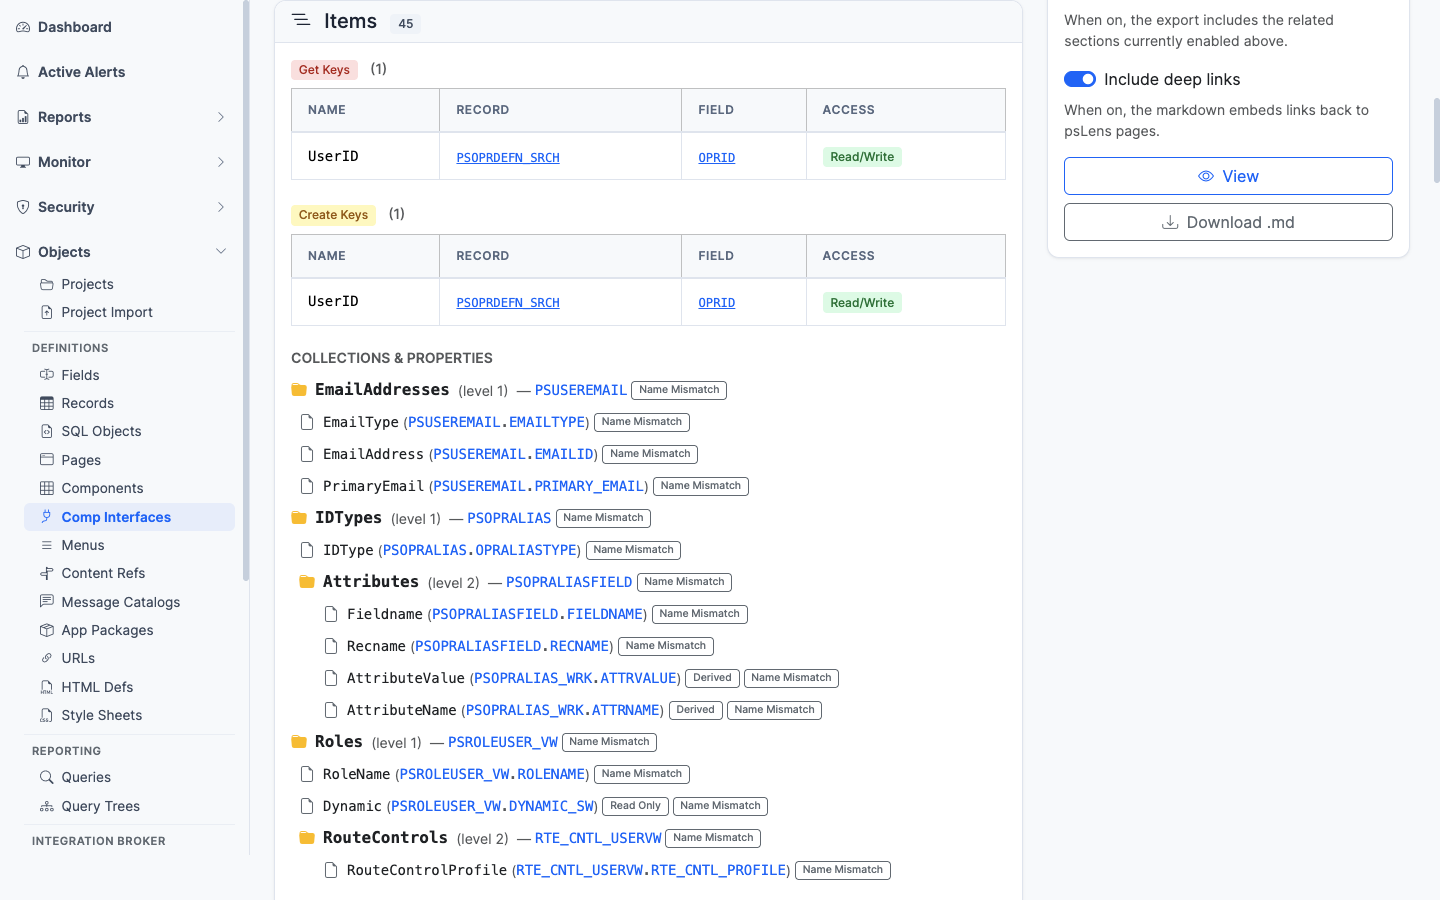
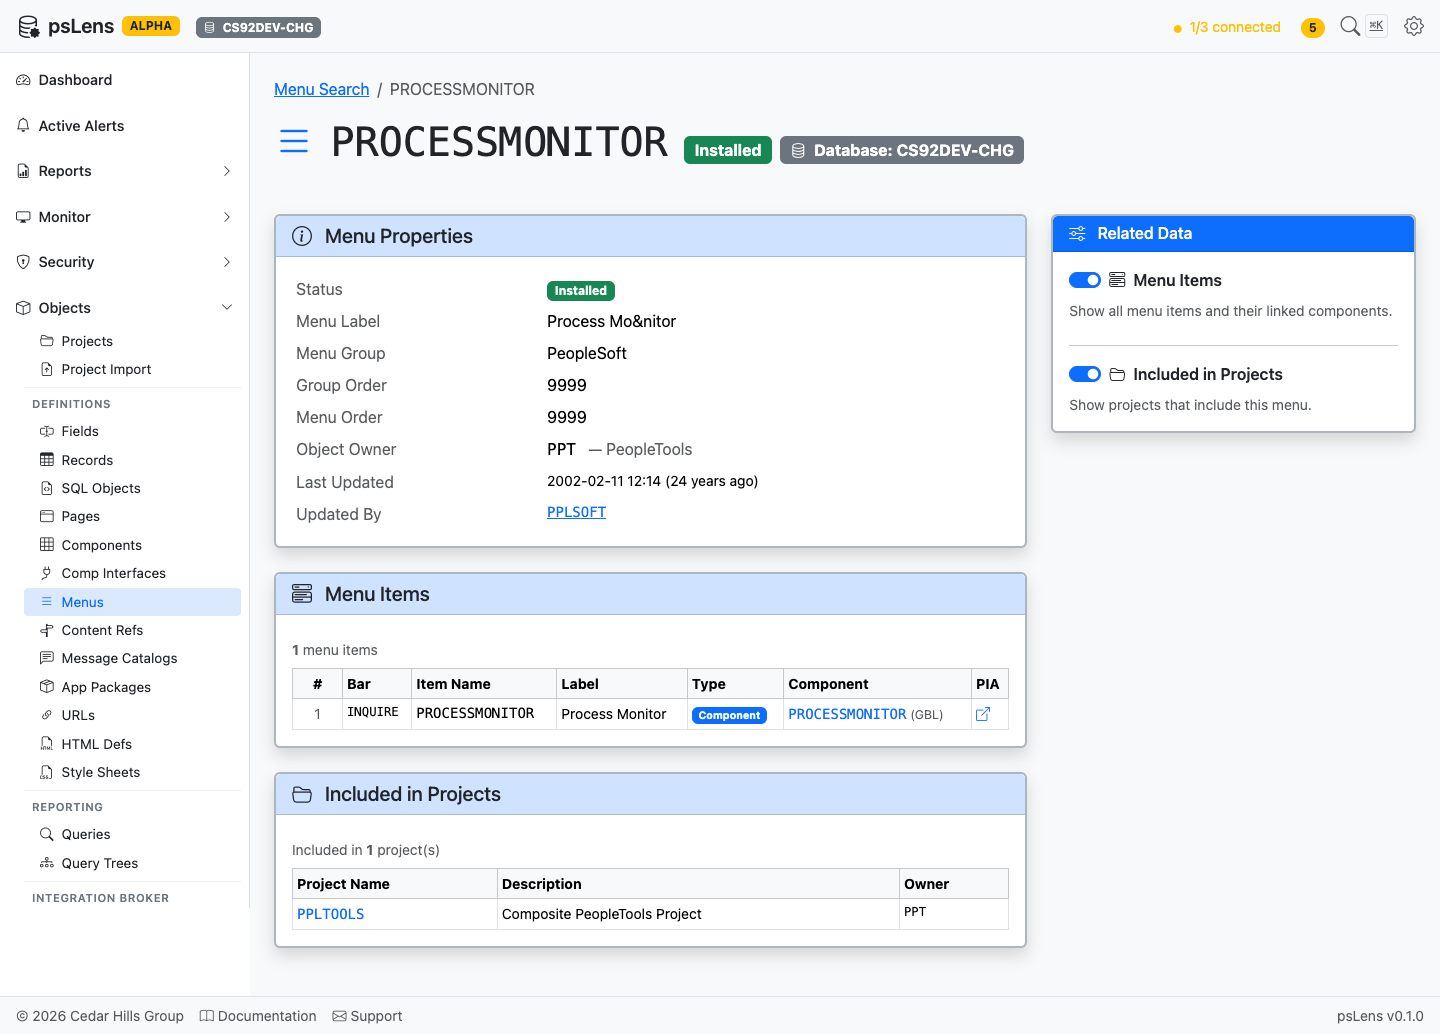
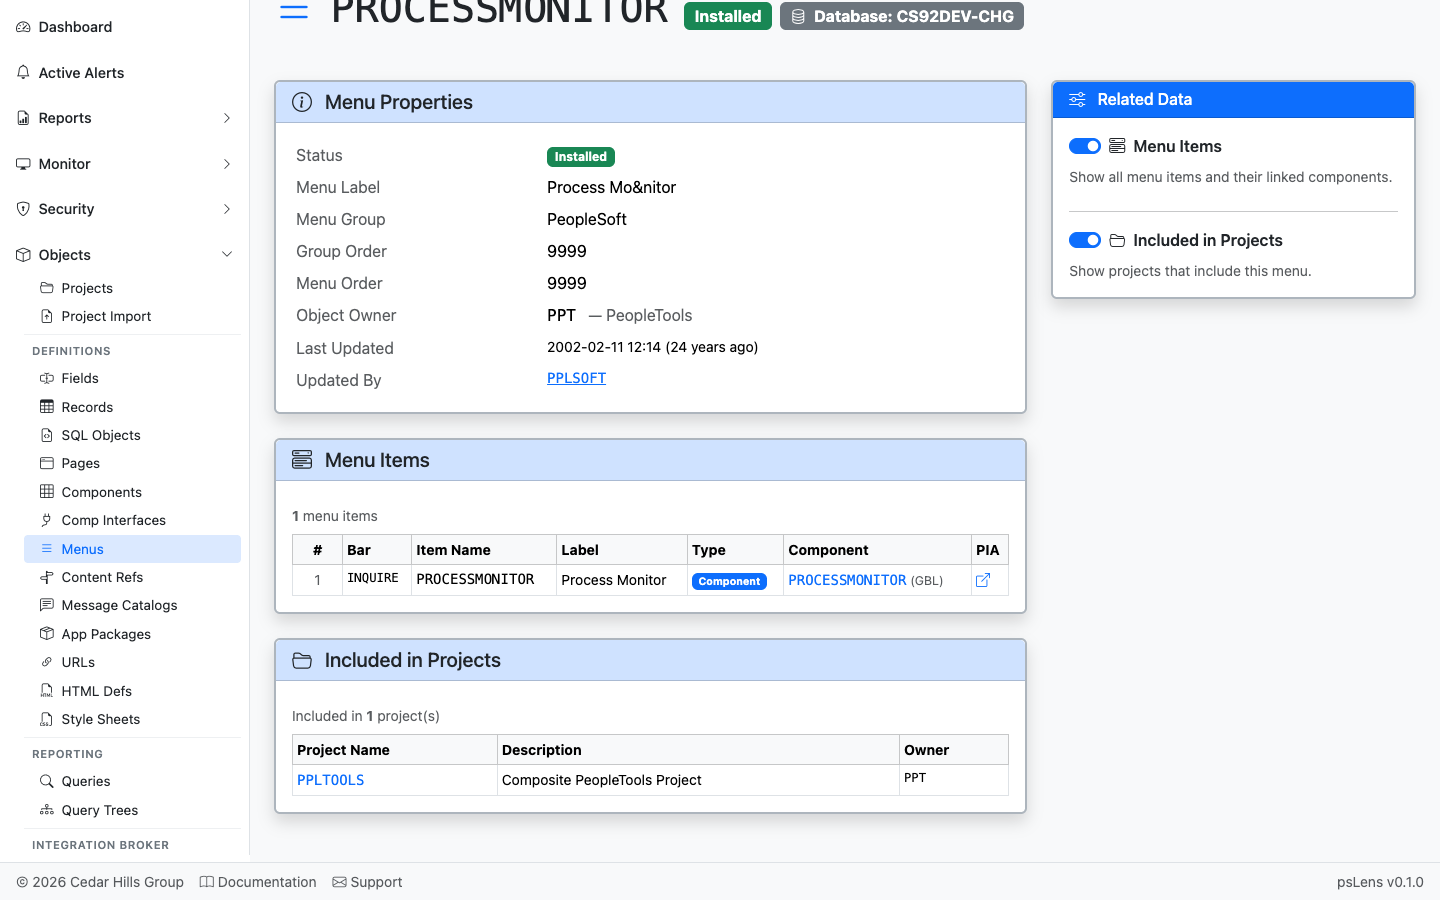
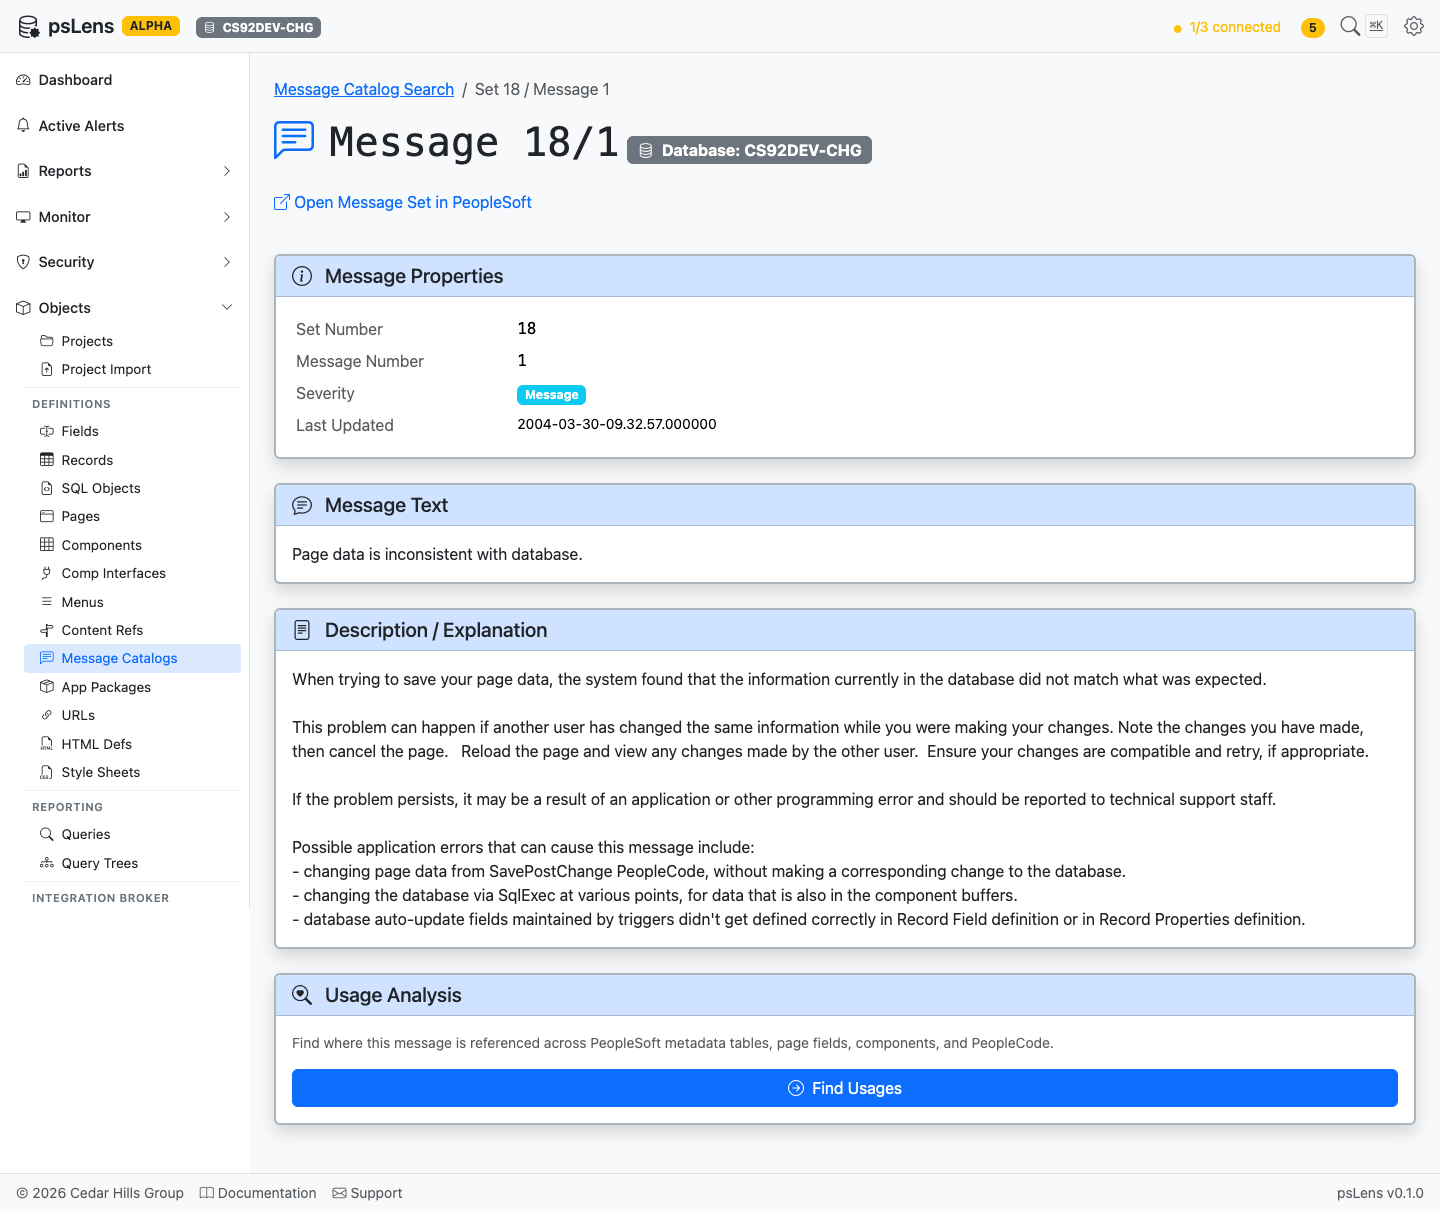
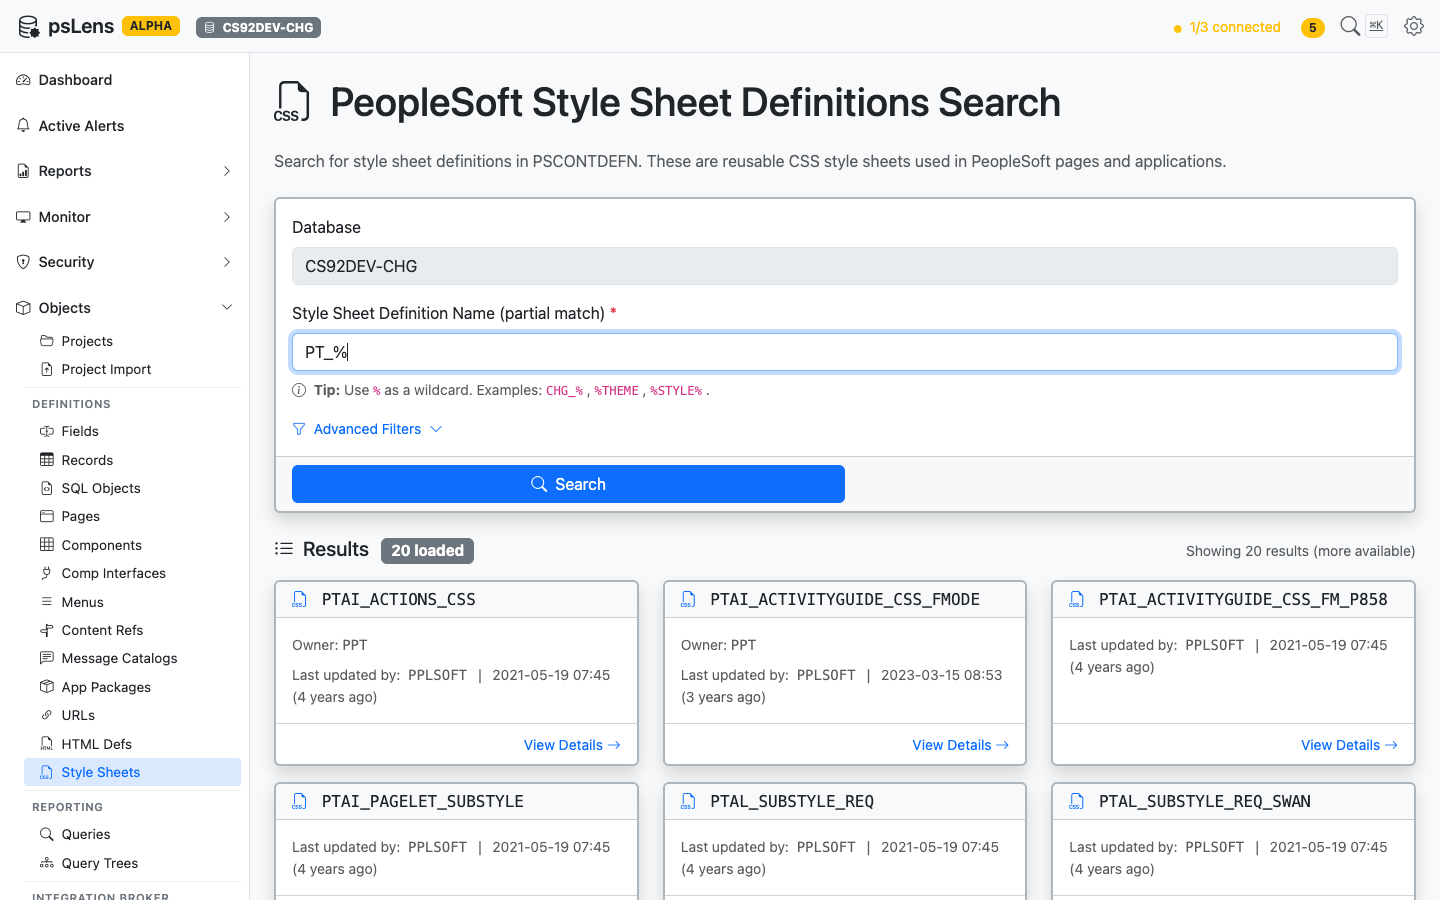
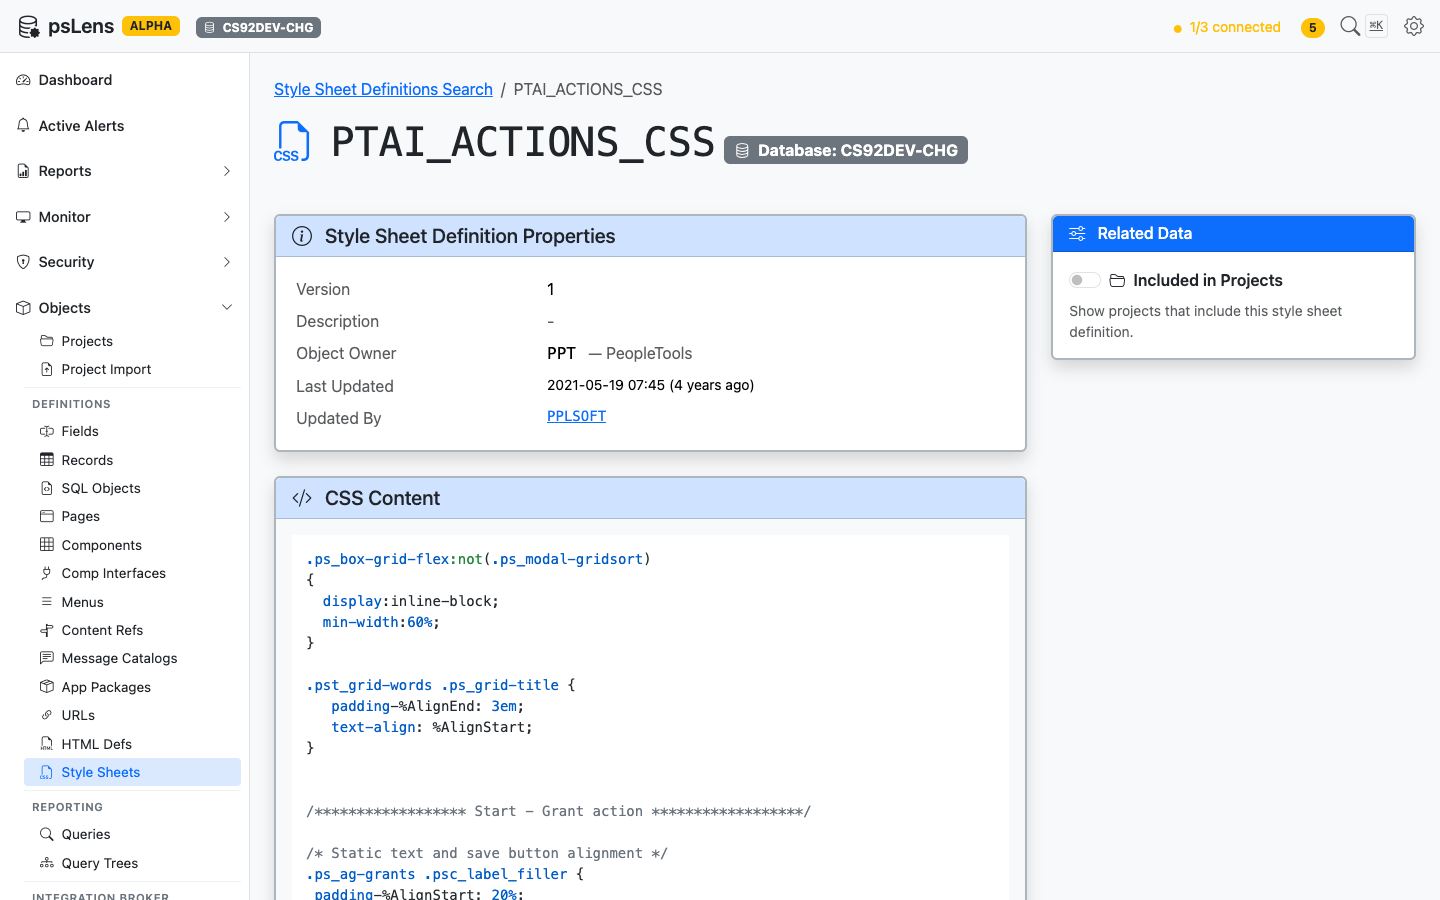
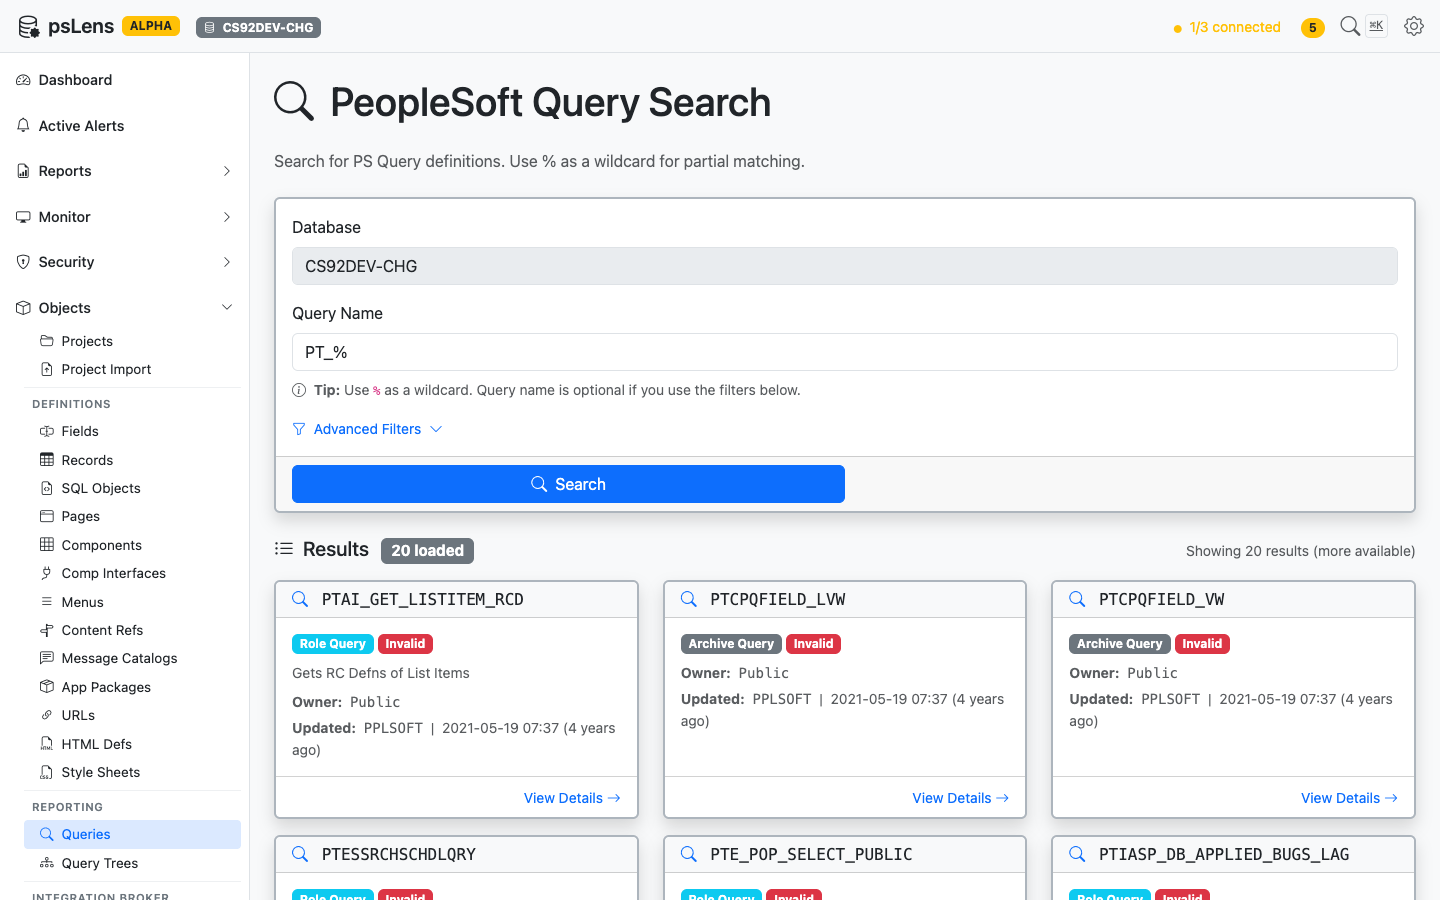
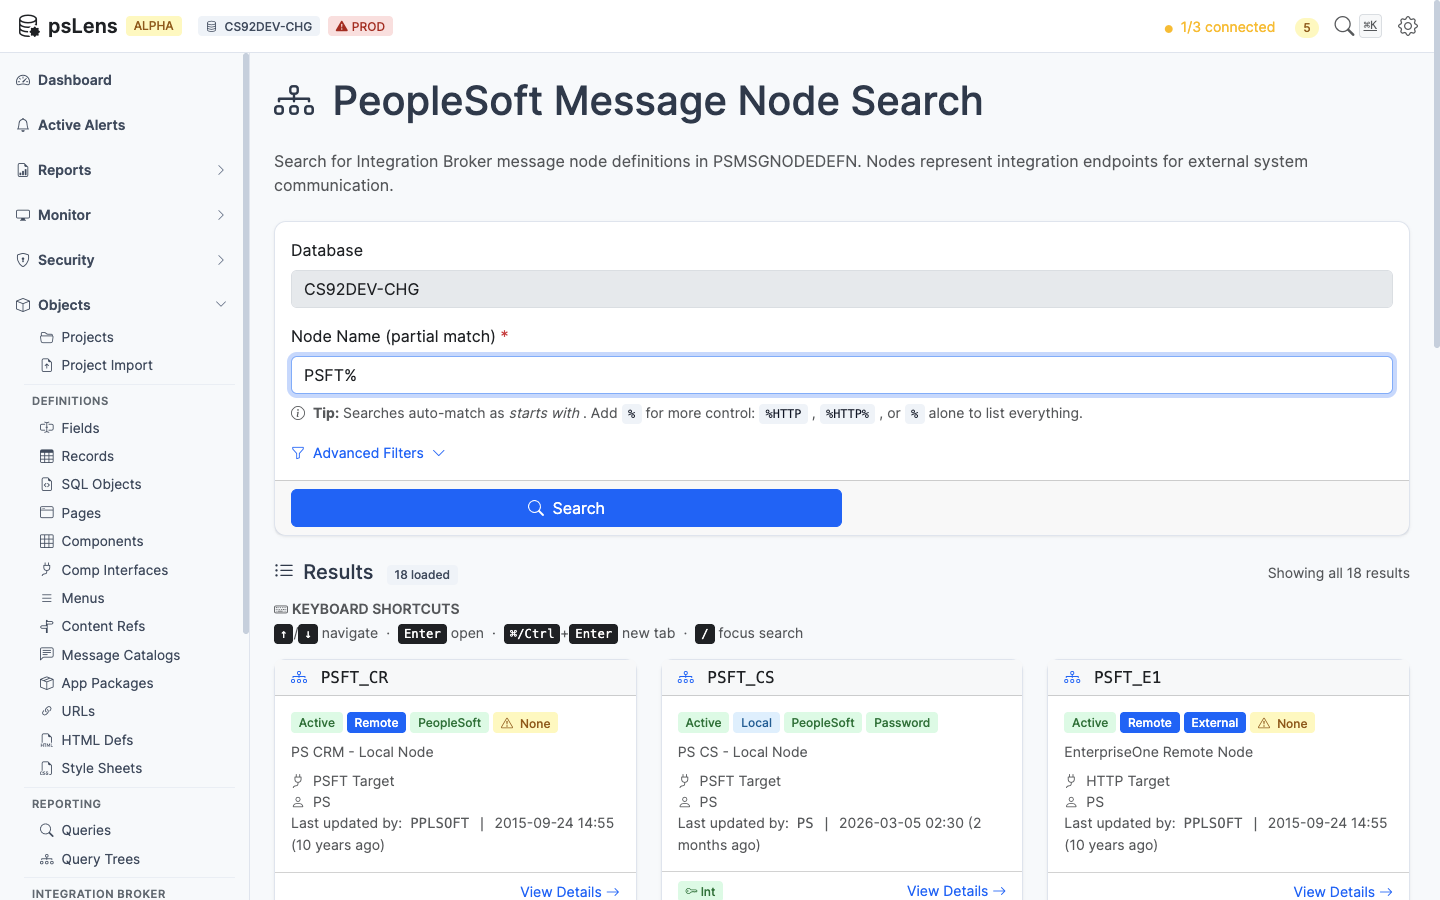
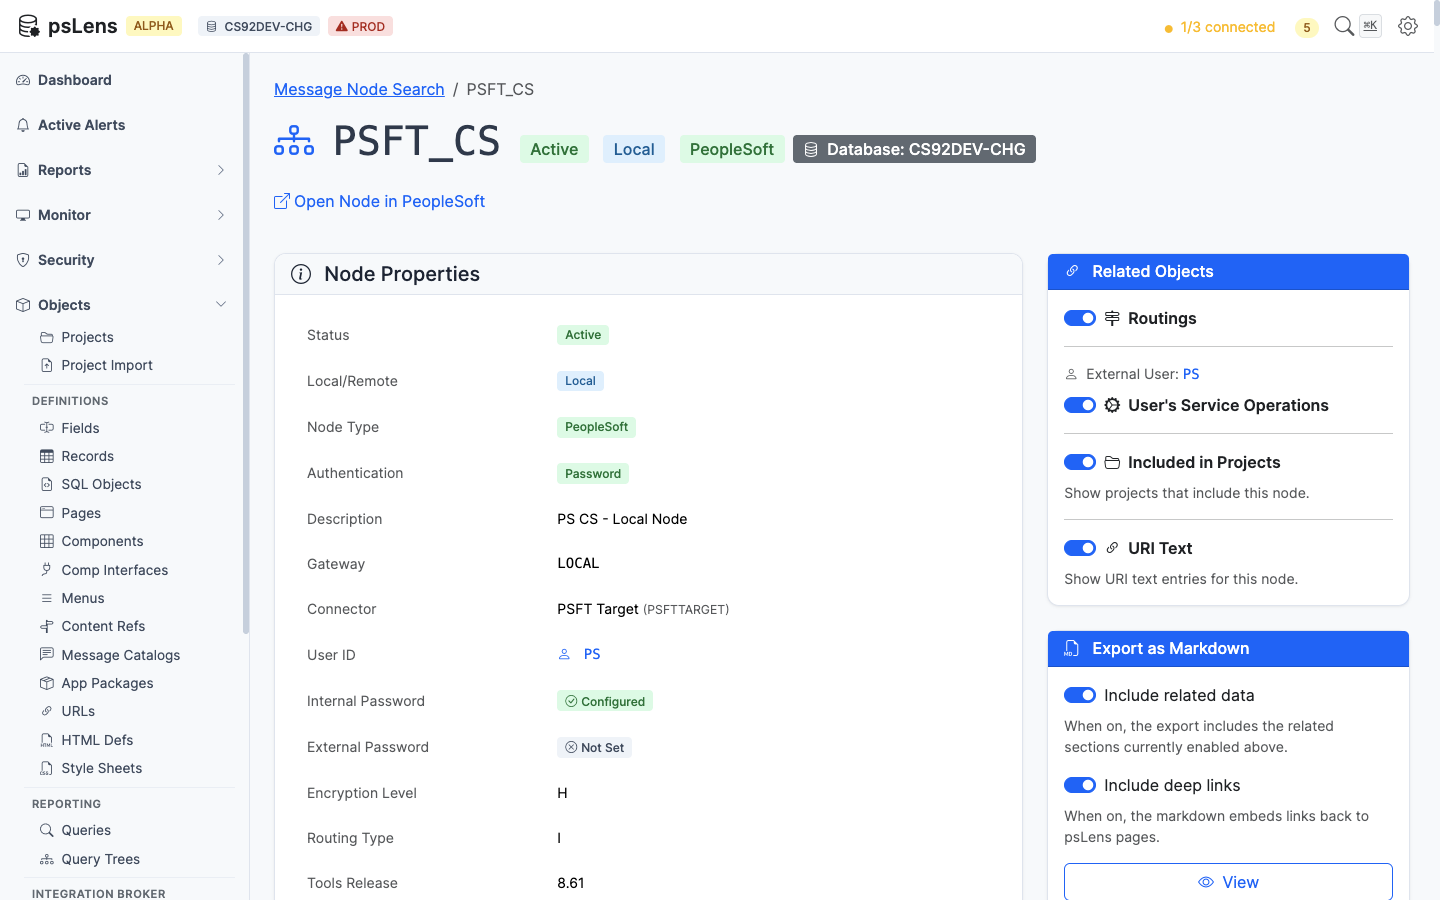
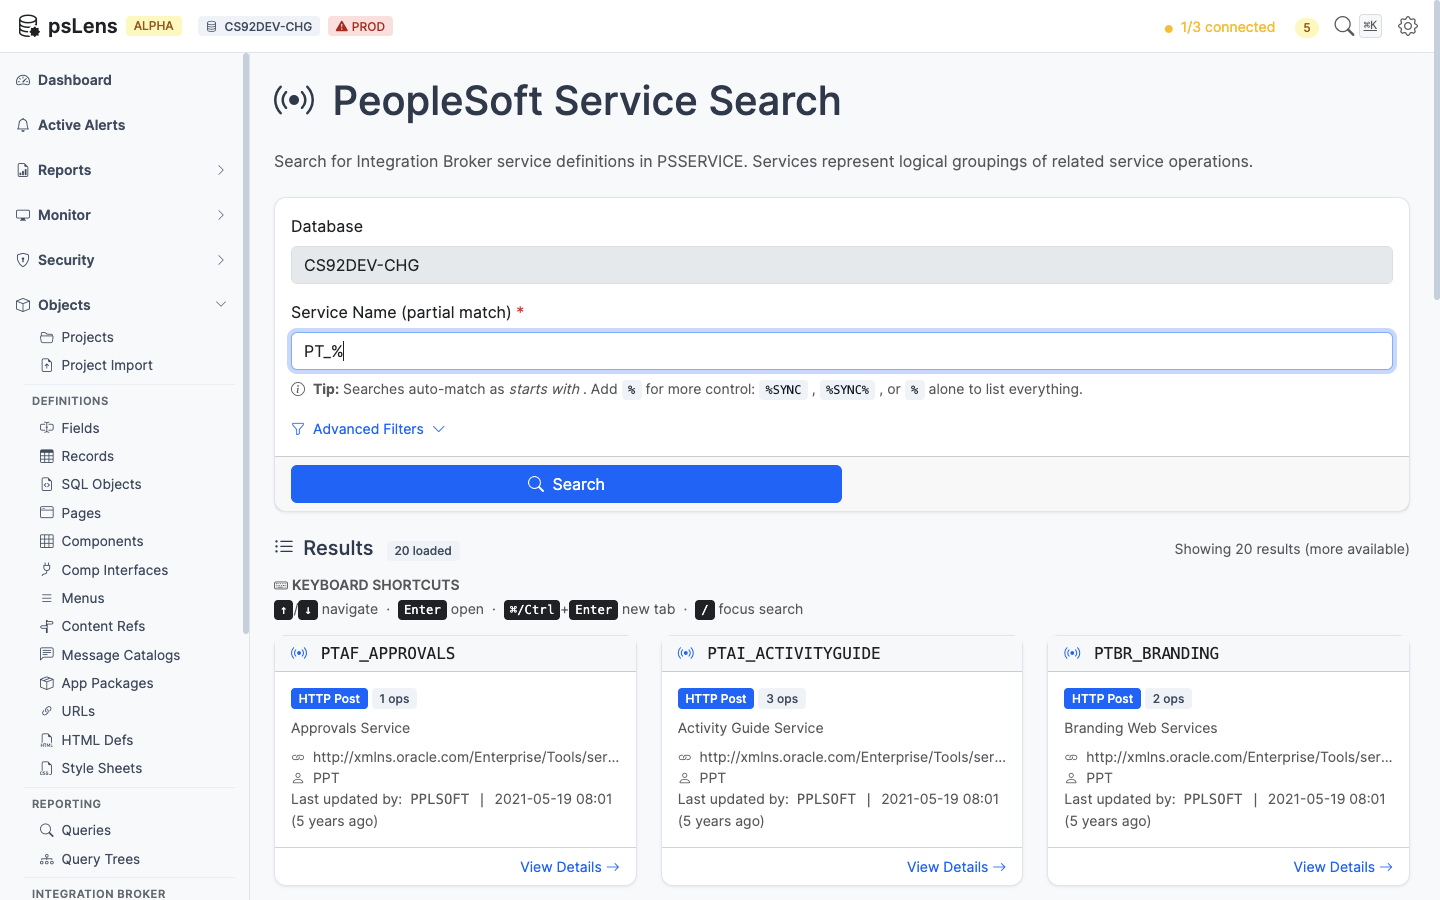
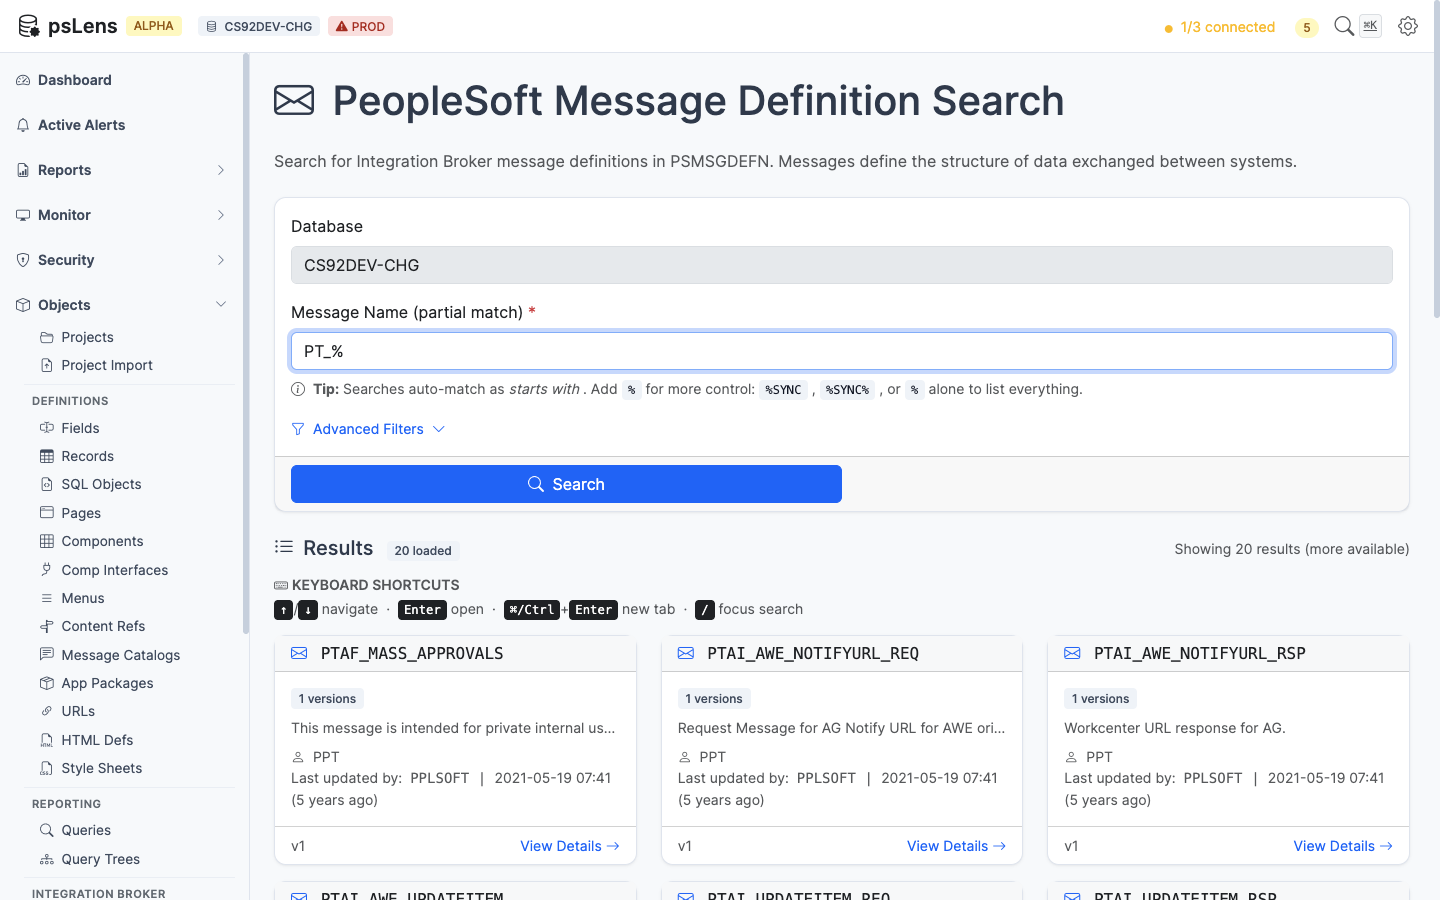
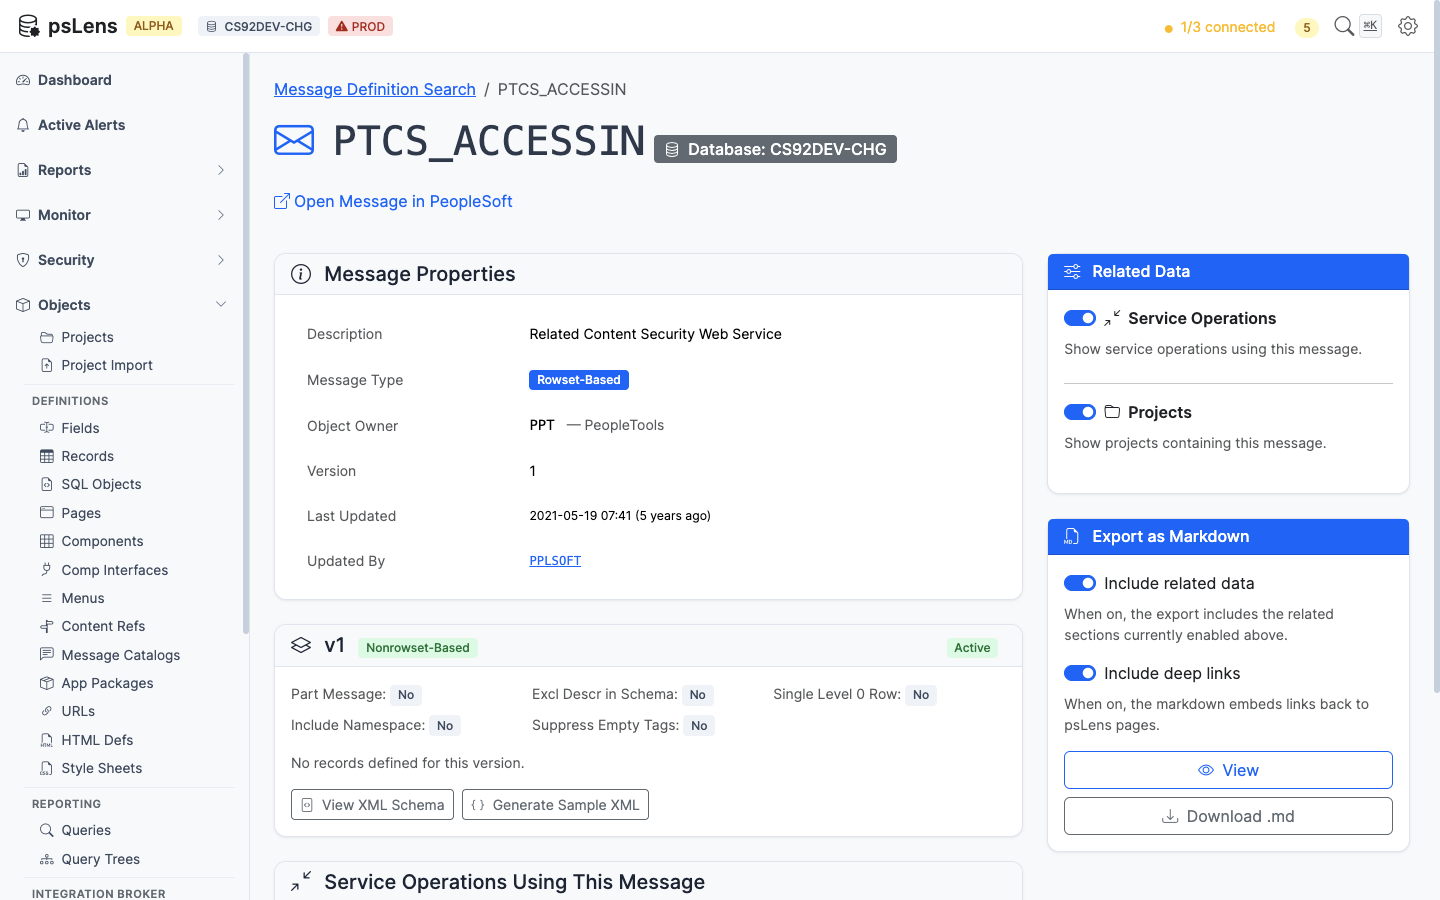
Search records, components, roles, permission lists, messages, and other PeopleSoft objects from a browser instead of opening a desktop client just to look something up. Each object page has a permanent URL, so the result can go straight into a ticket, wiki, or chat thread.
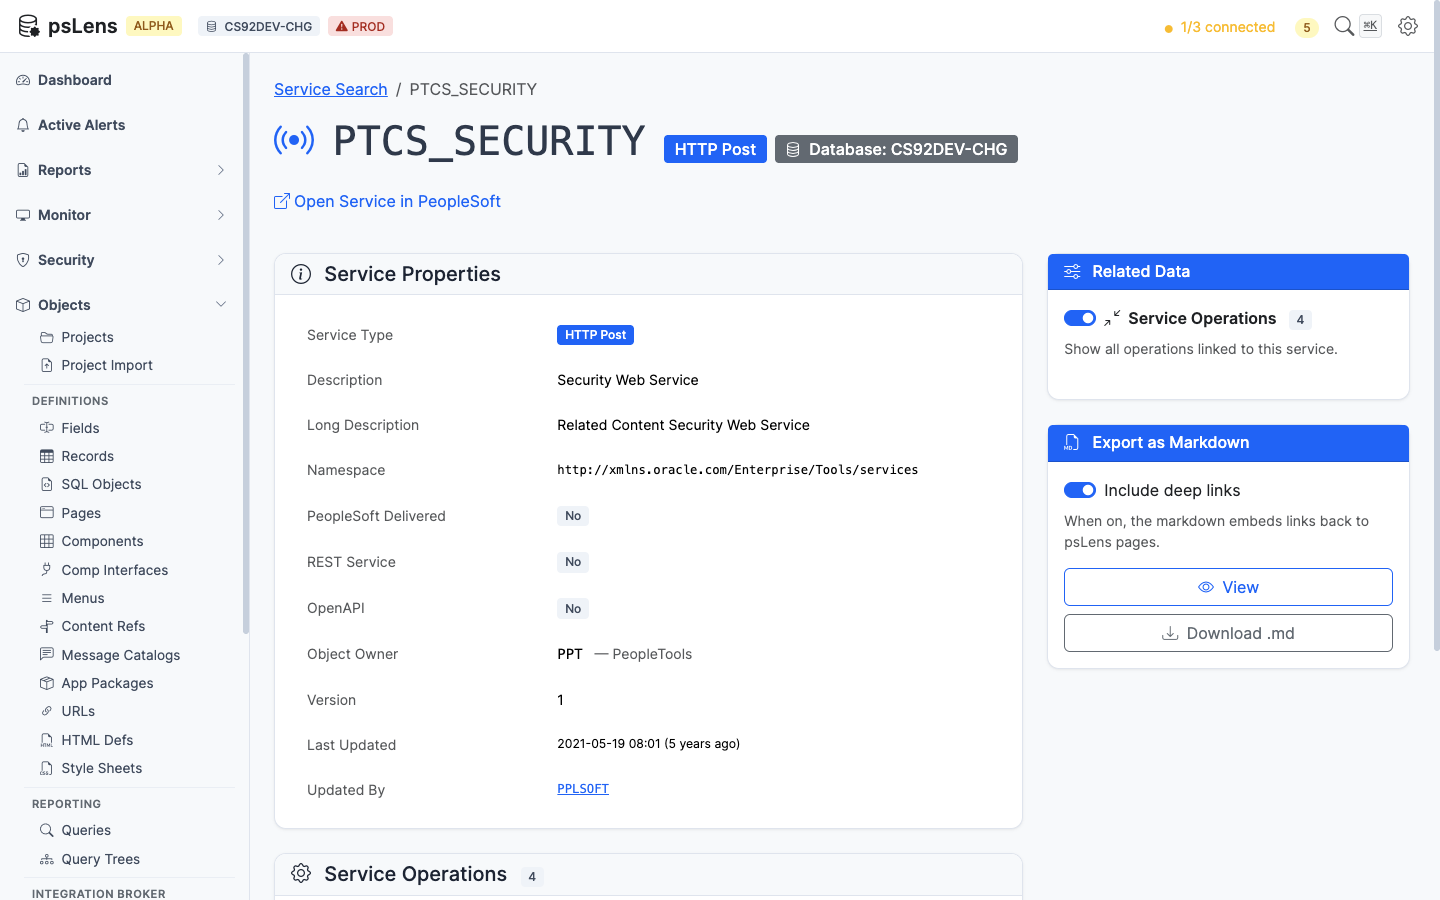
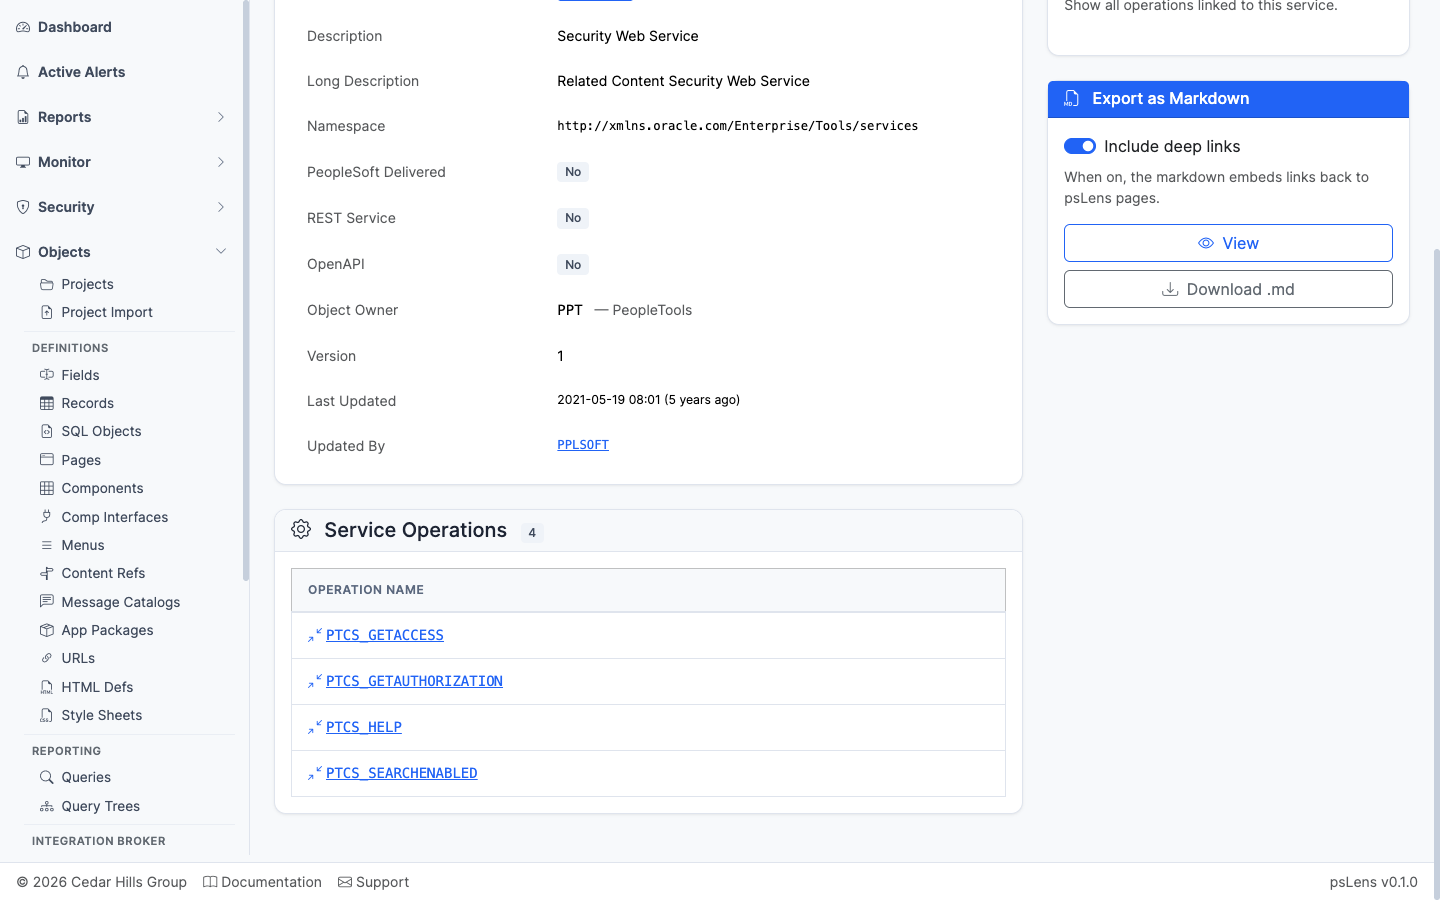
For teams that document configuration, psLens also exports object pages as Markdown. That removes the screenshot-and-copy-paste loop that usually follows App Designer or SQL research.
Security Review Without Custom SQL
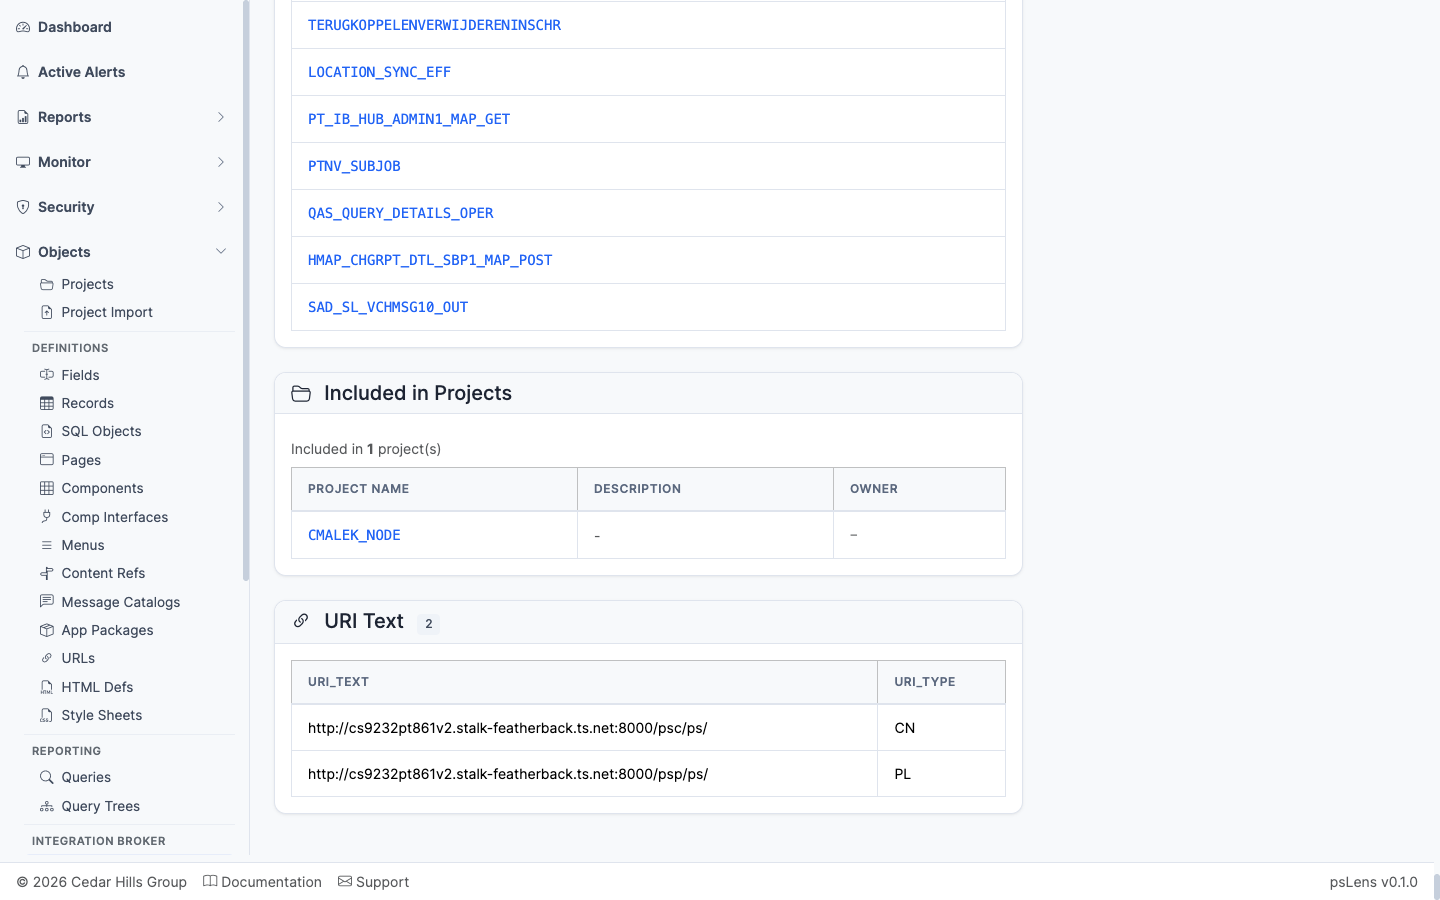
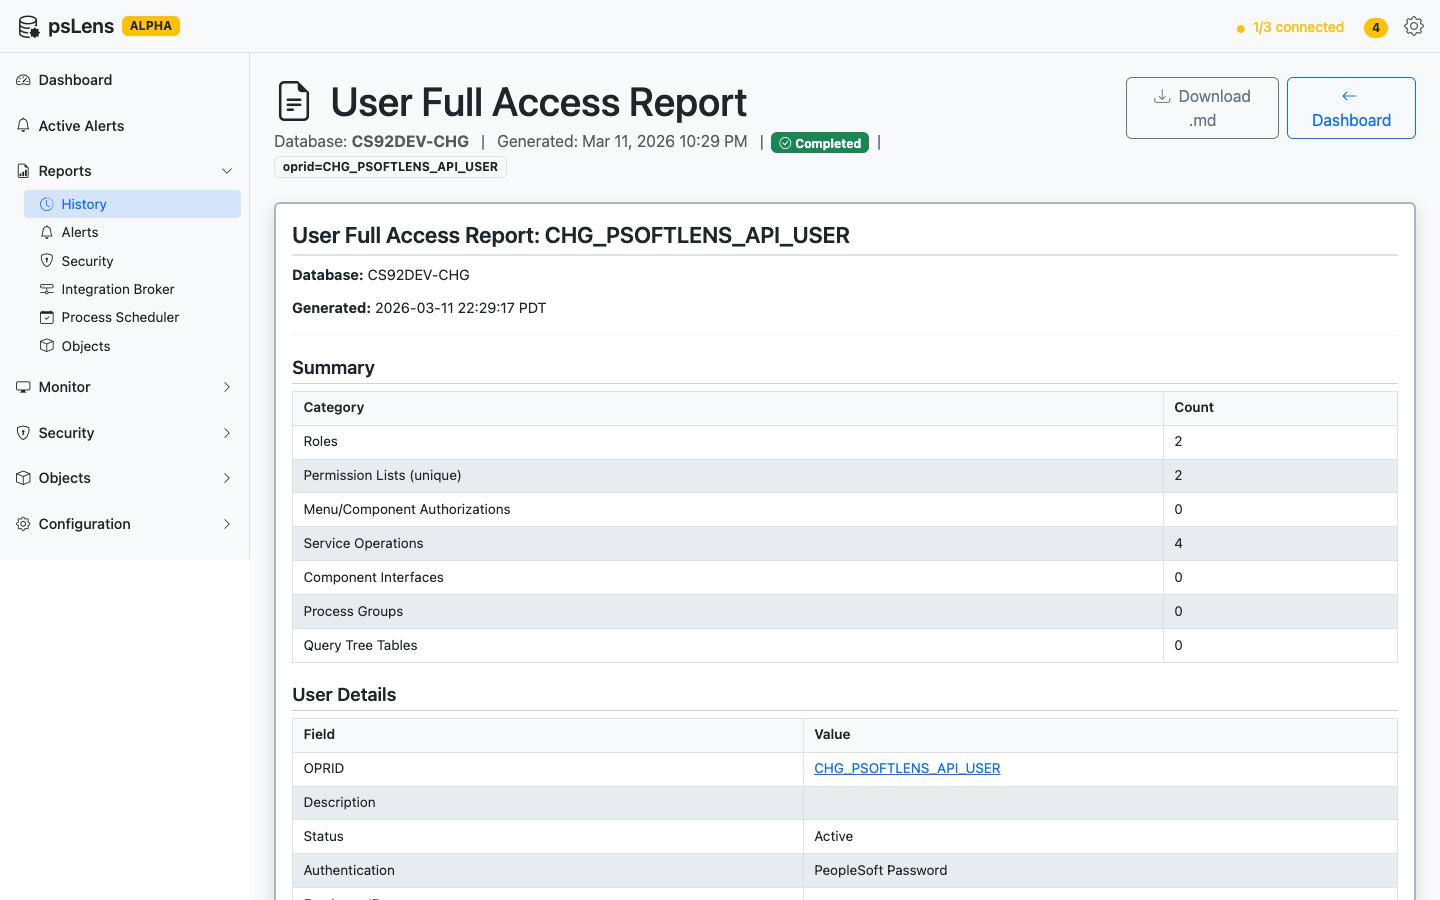
Security review is one of the clearest gaps in standard PeopleSoft tooling. psLens ships with 14 on-demand reports, including Full Access Permission Lists, Nodes Without Passwords, and Web Service Access. Results are rendered in the browser, downloadable as Markdown, and stored for 90 days for follow-up and audit history.
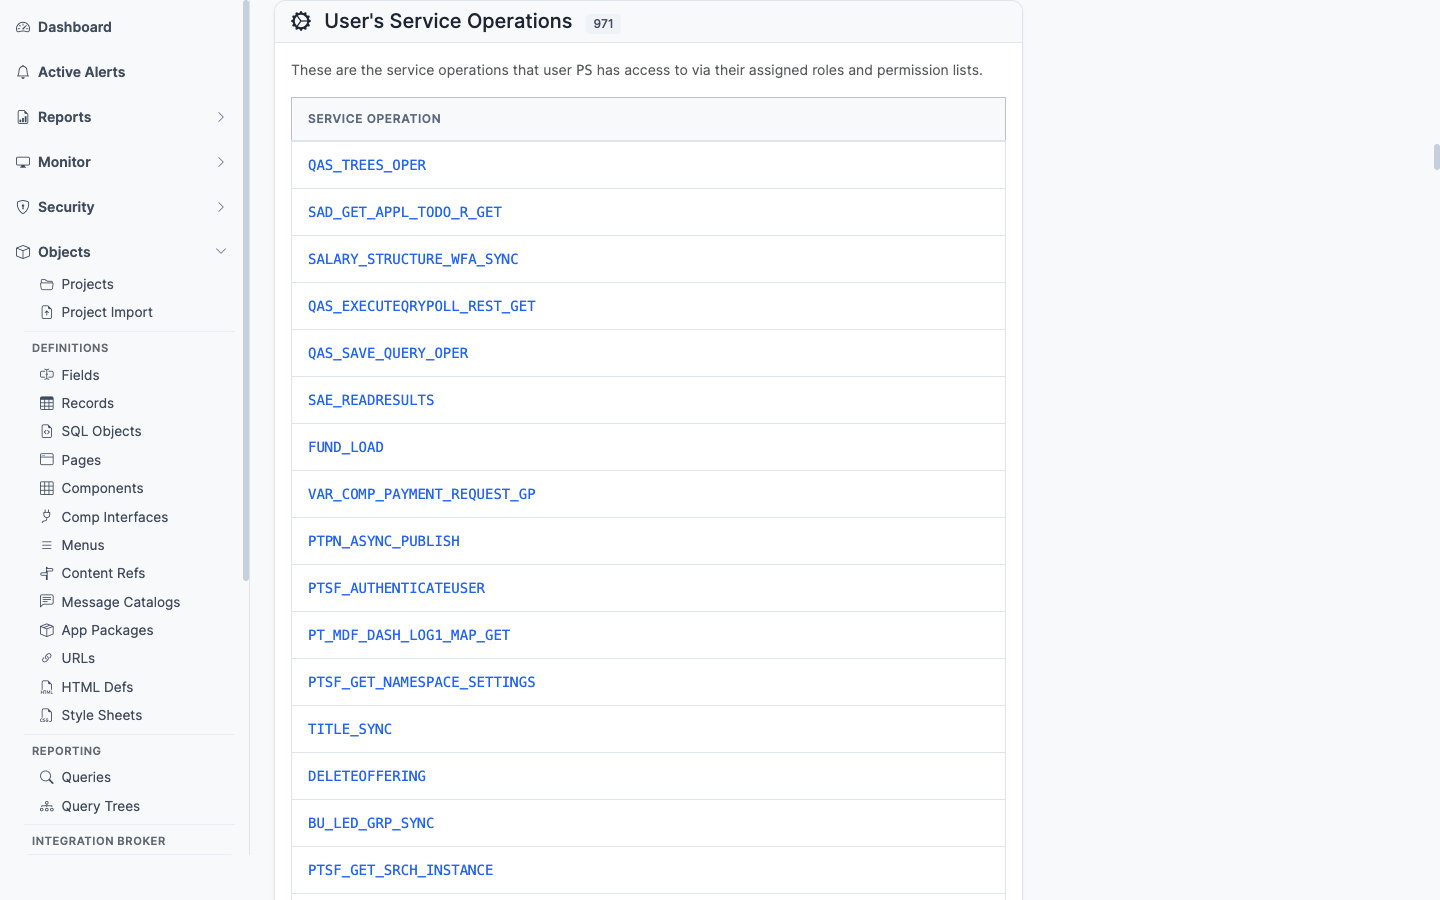
The same UI also lets you trace the security chain in either direction. Start from a user, role, permission list, or component and click through the relationships instead of stitching together queries across PSROLEUSER, PSROLECLASS, and PSAUTHITEM. See Security Admins for the workflow.
Operational Monitoring Without Manual Page Checks
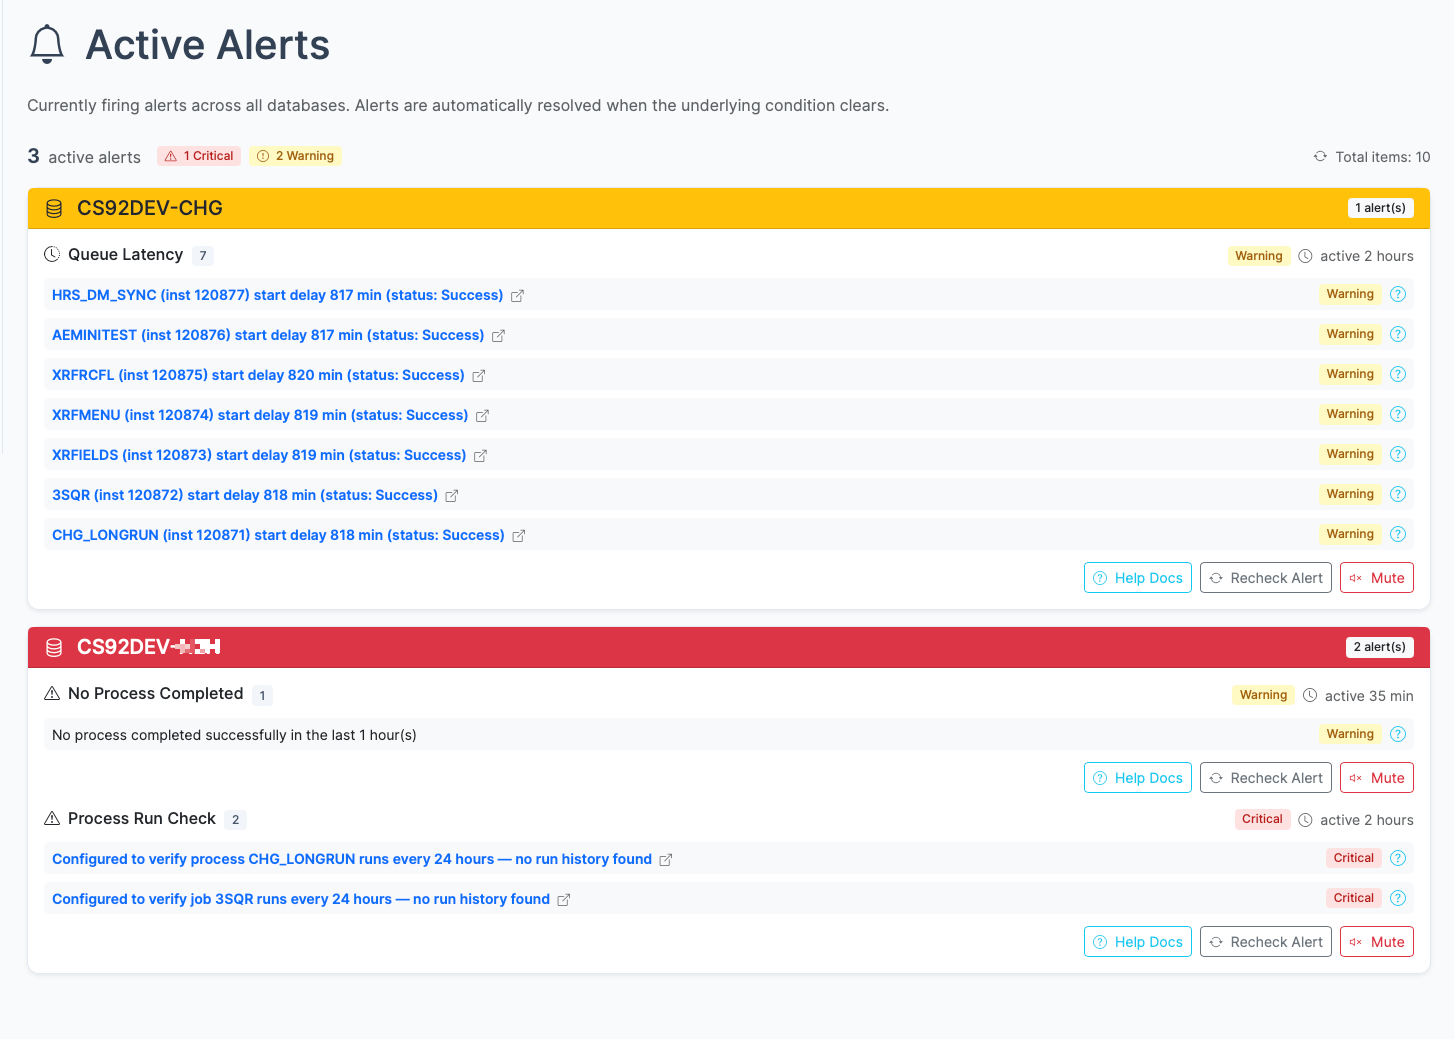
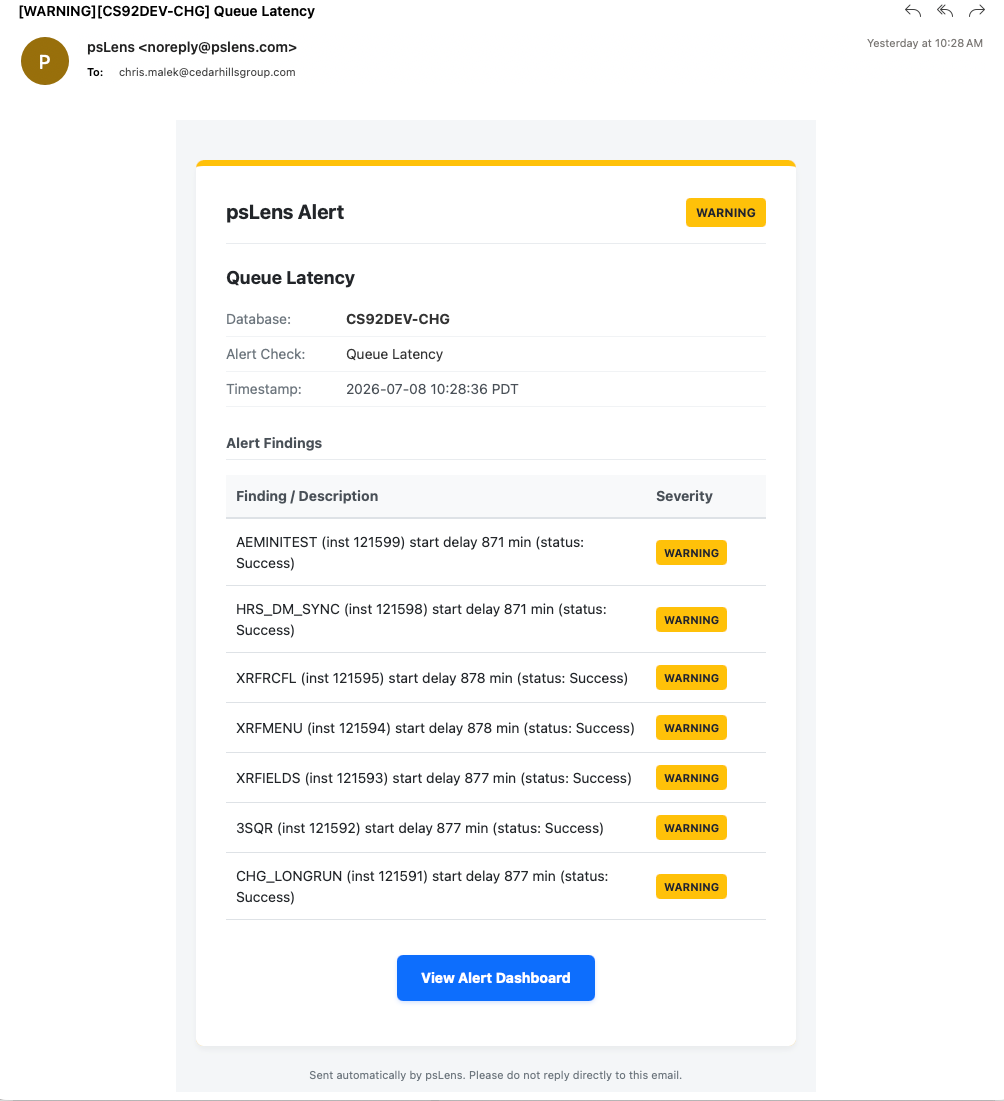
psLens runs 16 alert types on a 5-minute timer across connected databases. That covers Process Scheduler failures, long-running jobs, locked operator IDs, Integration Broker contract errors, stalled messages, sync exceptions, and volume anomalies.
Instead of waiting for a user ticket or refreshing monitoring pages by hand, the dashboard shows current findings and clears them automatically when the condition resolves.
Knowledge Sharing Without Screenshots
PeopleSoft knowledge usually gets trapped inside App Designer sessions, SQL results, or someone’s local notes. psLens makes that work easier to share because pages are read-only, linkable, and exportable.
That matters for onboarding, production support, and cross-team reviews. A developer can send the exact record or component page to an analyst. A security reviewer can attach a report result. A support lead can point a new team member at the same screen everyone else is using.
Where psLens Fits
psLens is not a replacement for App Designer. App Designer is still the right tool for:
Creating and modifying PeopleSoft objects (records, pages, components)
Writing and debugging PeopleCode
Building and deploying projects
Managing data migration
psLens is the better fit when the job is read-only and operational:
Researching object definitions and relationships
Auditing security configuration
Monitoring processes and Integration Broker
Onboarding new team members
Sharing PeopleSoft knowledge across teams
Day-to-day production support
App Designer requires a client install, training, and access to a tool that can modify the system. psLens runs in a browser and keeps the workflow read-only.
That matters because App Designer is a trusted-developer tool. It belongs in the hands of people who are expected to build, change, and migrate PeopleSoft objects. Handing it to a wider audience just so they can look something up expands risk in two directions at once: security exposure and system stability.
For team members who only need to inspect metadata, trace access, review operations, or answer audit questions, App Designer grants far more capability than the task requires. It opens the door to object changes, SQL access, and direct interaction with production systems through a tool designed for development work.
psLens is the safer way to widen visibility. Business analysts, auditors, support staff, project managers, and new team members can research PeopleSoft objects without getting the keys to the kingdom. They get read-only pages, reports, and links. They do not get object editing, SQL tooling, or direct database connectivity. In production environments, that separation is often the difference between broad understanding and broad risk. See Reducing App Designer Access for the full case.
Comparison at a Glance
The day-to-day question is not which tool can do everything. It is which tool is the best fit for research, audit, and monitoring work.
Capability
App Designer
Direct SQL
psLens
Runs in a web browser, no client install
✗
~
✓
Read-only by design (safe for broad team access)
✗
✗
✓
Fast object search for read-only research
✗
~
✓
Built-in audit & security reports
✗
✗
✓
Background alerts for Process Scheduler & IB
✗
✗
✓
Markdown export for docs and AI workflows
✗
✗
✓
Permanent URL for every object page
✗
✗
✓
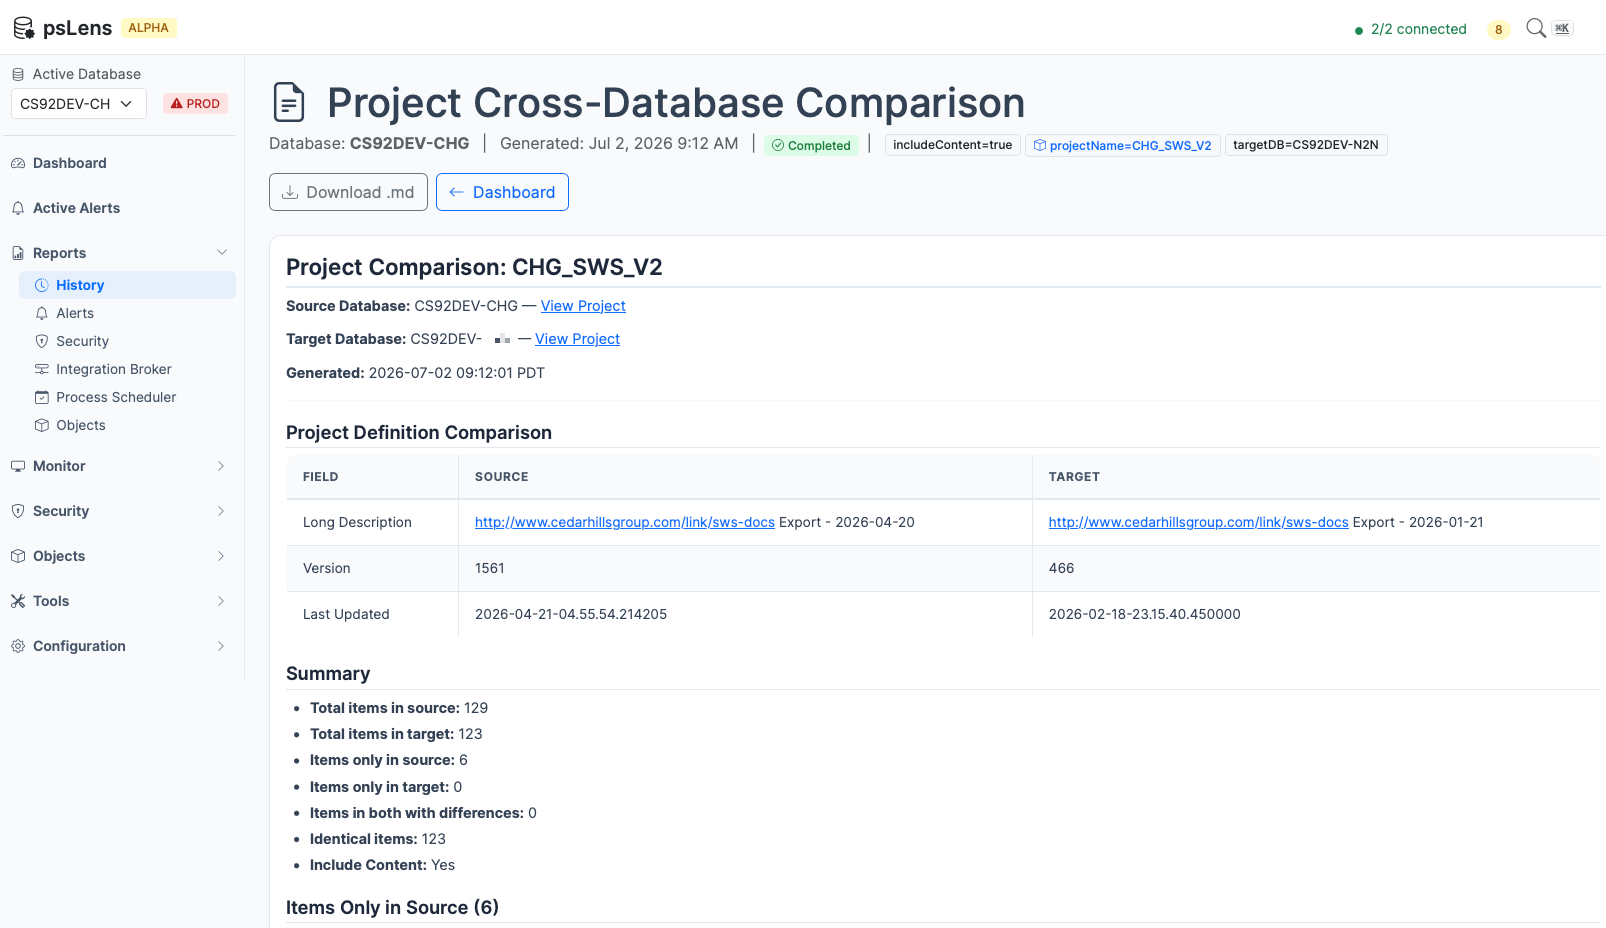
Cross-database project comparison
~
~
✓
Right tool for building & modifying objects
✓
~
✗
Legend:✓ Strong fit ·
~ Possible but awkward or partial ·
✗ Not supported
Why Teams Roll It Out Broadly
Read-Only Access for More Roles
The browser UI changes who can safely participate. Teams no longer need to choose between keeping PeopleSoft knowledge locked inside a small developer group or handing out a powerful development tool too broadly.
With psLens, business analysts, auditors, support staff, project managers, and new team members can inspect the same objects trusted developers use, especially in production-facing workflows, without getting change capability. That opens up the system to the people who need visibility while keeping development-grade access narrow.
Permanent URLs for Any Object
Every object page has a stable URL. That makes tickets, runbooks, and review notes easier to maintain because the source page is a link, not a screenshot.
Structured Markdown for Documentation and Analysis
Report results download as Markdown, and object pages can be exported the same way. Teams use that output for internal documentation, change records, and AI-assisted review workflows where plain text works better than image-based exports.
Repeatable Audit and Monitoring Workflows
The reports and alerts pages turn one-off checks into repeatable workflows. Reports keep 90 days of history. Alerts run every 5 minutes and clear automatically when the underlying issue resolves.
Those details matter during audits and during production support. The same page that helps an analyst look up a permission list can also help a security reviewer run Full Access or Node security checks, or help an operator spot a stalled message before users escalate it.
Get started with psLens: install the SWS framework, deploy psLens, and connect it to your PeopleSoft environment in minutes.
Getting Started with psLens
Install SWS in PeopleSoft, run the psLens container, point it at SWS, log in. The pages in order:
Overview
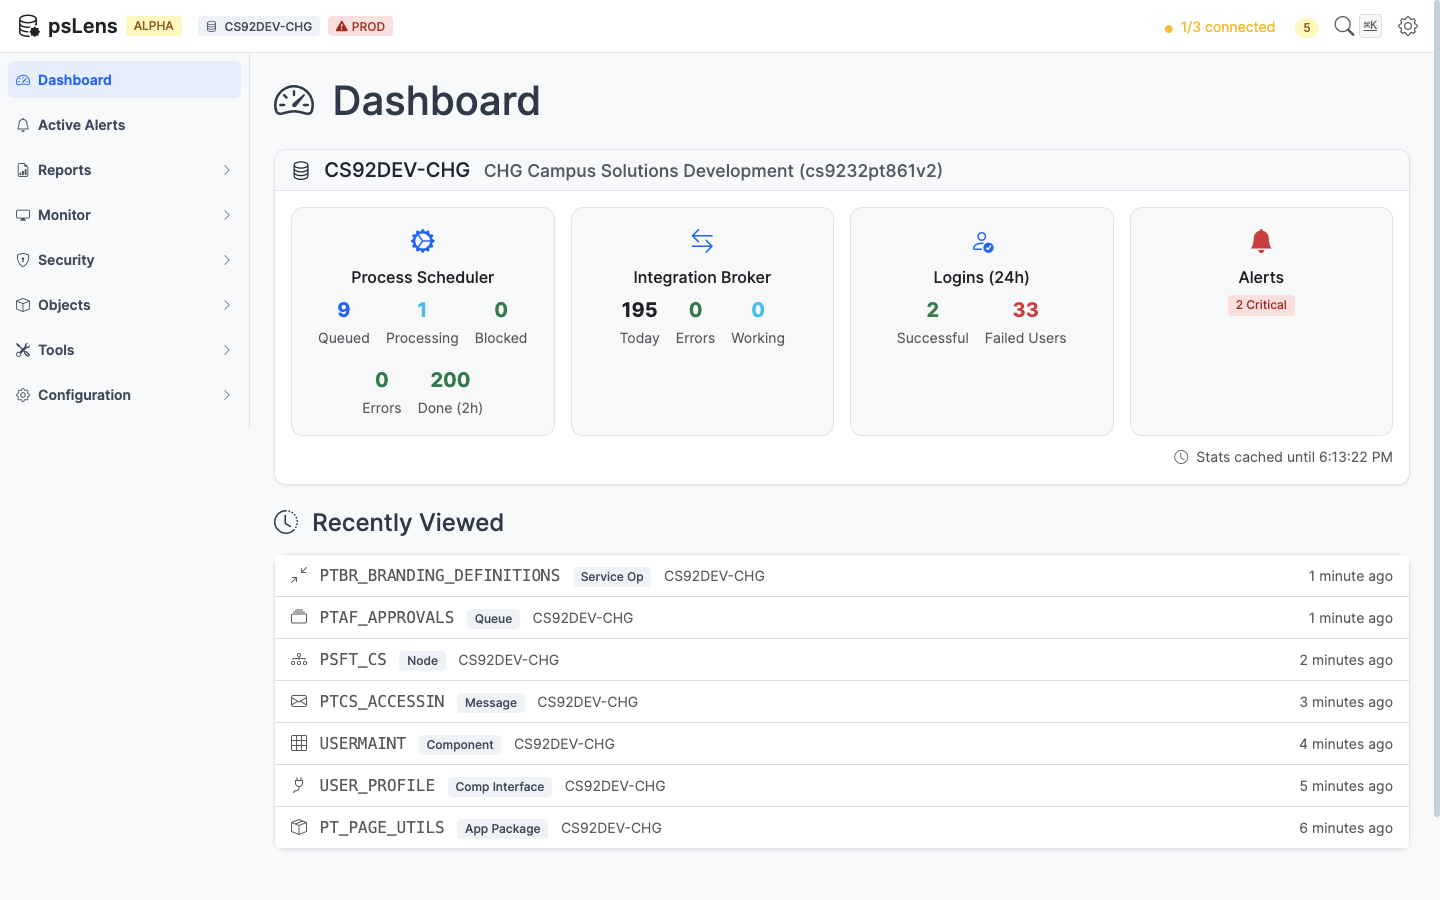
psLens is a single self-contained application: a Go binary that serves the web interface and stores report data locally. There is no separate database to manage. It connects to your PeopleSoft environment through the SWS (Secure Web Services) framework, which must be installed and configured in PeopleSoft first.
The psLens dashboard — your starting point for monitoring PeopleSoft environments
Hosting psLens in production? Read Deployment Options for HTTPS, version pinning, backups, and upgrade paths.
Start psLens and open the dashboard in your browser
Quick Start
Once the SWS framework is installed in PeopleSoft:
# Create a directory for psLensmkdir pslens &&cd pslens
# Create config.yaml with your PeopleSoft connection details# (see Configuration for full details)# Start psLens with Dockerdocker compose up -d
# Open http://localhost:8080 in your browser
Not Ready to Install Yet?
If you are still evaluating architecture, security, or operator workflow, see it running first. A live demo is the quickest way to answer fit questions before you commit to an install path.
psLens has two parts to install: the SWS framework in your PeopleSoft environment, and the psLens application on a server.
Installation
psLens has two parts to install: the SWS framework in your PeopleSoft environment, and the psLens application on a server.
Hosting psLens yourself in production? This page walks through the basic “Docker on one host” install. For client-hosted deployments that need HTTPS, version pinning, backups, and a clear upgrade story, read Deployment Options after this page.
Step 1: Install the SWS Framework in PeopleSoft
psLens reads data from PeopleSoft through the SWS (Secure Web Services) framework, developed by Cedar Hills Group. SWS exposes a REST API; psLens calls it instead of talking to the database directly.
What SWS Provides
A PeopleSoft Integration Broker service (CHG_SWS_PSOFTQL) that psLens calls
A psoftQL query language for structured data access
Role-based API authentication using PeopleSoft operator IDs
SWS Installation Steps
Full SWS installation instructions are available in the SWS installation guide. At a high level:
Import the SWS PeopleSoft project into your environment using App Designer
Activate the Integration Broker service and configure the listening connector
Create a dedicated PeopleSoft operator ID for psLens API access
Grant the operator ID the required permissions to read the tables psLens uses
Test the API endpoint with a sample query
Tip: Create a dedicated operator ID for psLens (for example, PSLENS_API) rather than using an existing account. This makes it easy to audit API activity and control access.
Whitelisting Tables
SWS controls which PeopleSoft tables can be queried through a whitelist. You need to whitelist every table that psLens reads.
The full inserts live on a dedicated page so this install procedure stays readable top to bottom:
Run all of the inserts on Whitelist Tables against each PeopleSoft database you plan to connect.
After running the inserts, restart psLens (or wait for the next whitelist cache refresh) and confirm the Settings > Database Connections page shows the database as fully connected with no missing-table warnings.
Step 2: Install psLens
psLens is distributed as a Docker image. Cedar Hills Group also offers a managed hosted option on Fly.io. Contact us for details.
System Requirements
Docker: Docker Engine 20.10+ with Docker Compose
Memory: 512 MB minimum, 1 GB recommended
Disk: 1 GB for data storage (NATS report store)
Network: Must be able to reach the PeopleSoft Integration Gateway on port 8000 (or your configured port)
Docker Installation
Authenticate with the GitHub Container Registry using the token provided by Cedar Hills Group:
Create a directory for psLens and add your configuration:
mkdir pslens &&cd pslens
Create a config.yaml file (see Configuration for all options):
server:port:8080host:"0.0.0.0"appBaseURL:"https://pslens.yourcompany.com"natsStoreDir:"/data/nats"databases:- name:"PROD"description:"Production HCM"baseURL:"https://peoplesoft.example.com/PSIGW/RESTListeningConnector/PSFT_HR/CHG_SWS_PSOFTQL/"username:"PSLENS_API_USER"password:"placeholder"timezone:"America/Chicago"production:true# red "PROD" badge + typed-name confirmation on Edit/Delete
Production flag (production: true) — When set, psLens displays a red “PROD” badge next to the database name in the top nav and gates destructive settings actions (Edit, Delete) behind a typed-name confirmation prompt on both the client and the server. The flag is read from config.yaml only — the value stored in the encrypted KV snapshot is ignored on every boot and re-overlaid from the file, so a production connection can never be silently un-flagged from the settings UI. To change the flag, edit config.yaml and restart psLens.
Tip: Use environment variables for passwords instead of putting them in config.yaml. The PSLENS_DB_{NAME}_PASSWORD variable overrides the password for each database.
Start psLens:
docker compose up -d
Upgrading
Pull the latest image and restart:
docker compose pull pslens
docker compose up -d pslens
Air-Gapped Environments
For environments without internet access from the Docker host:
# On a machine with internet access:docker pull ghcr.io/cedarhillsgroup/pslens:latest
docker save ghcr.io/cedarhillsgroup/pslens:latest | gzip > pslens.tar.gz
# Transfer file to the target host, then:docker load < pslens.tar.gz
Bare-Metal Installation
psLens can also run as a standalone binary without Docker. Contact Cedar Hills Group for the binary distribution.
Run psLens as a system service so it starts automatically and restarts on failure.
systemd example (/etc/systemd/system/pslens.service):
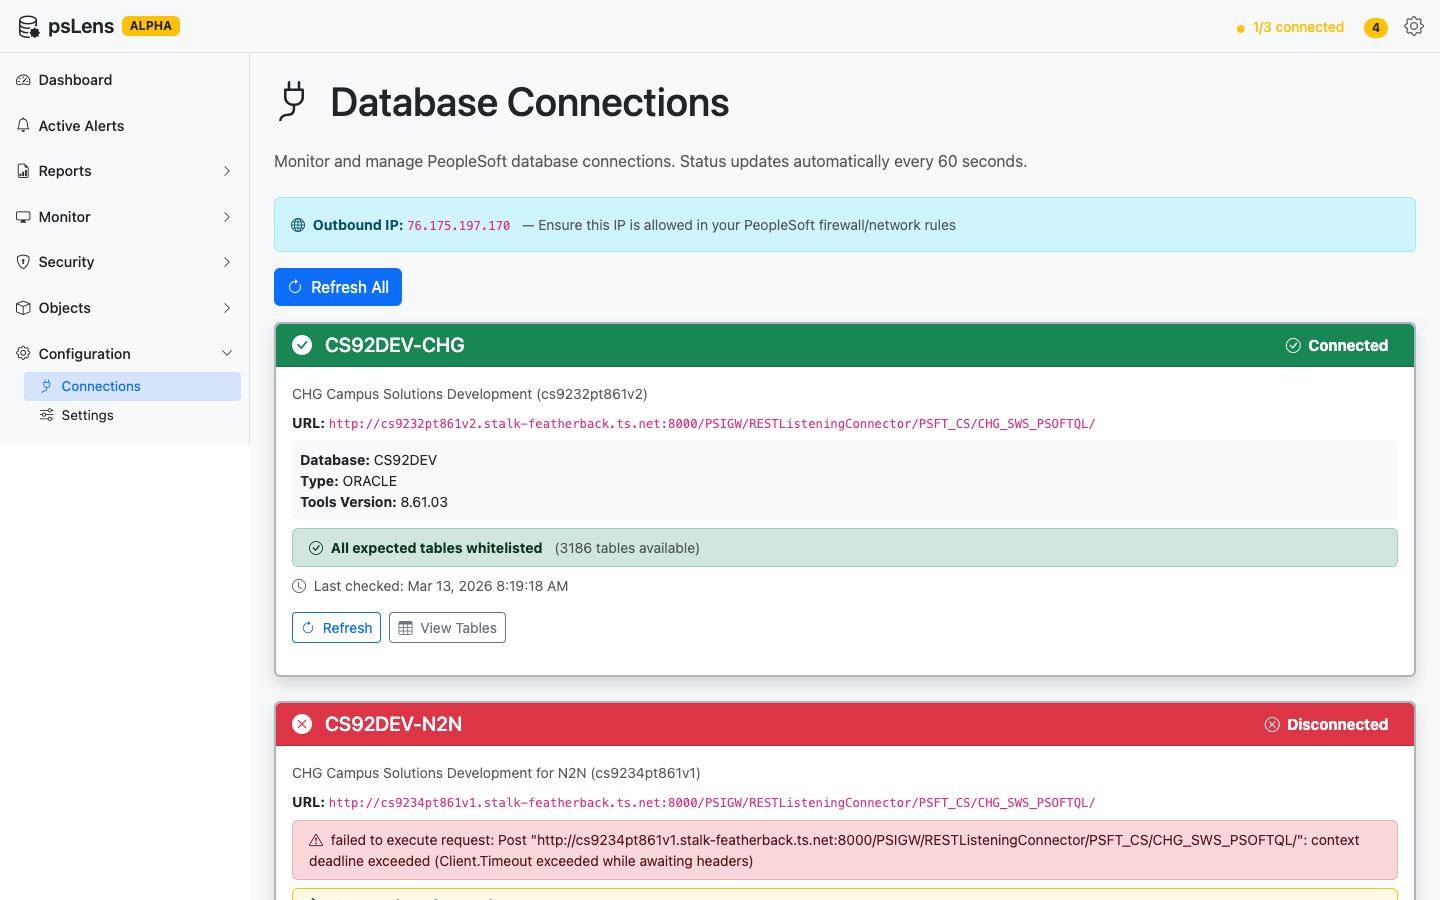
Once psLens is running, open http://your-server:8080 in a browser. You should see the psLens dashboard. If your config.yaml is correct, the database connection indicator in the top navigation will show your configured databases as connected.
The Settings > Database Connections page shows connection status and diagnostics for each configured database
Next Steps
Once psLens is running, see Configuration for details on all the available settings, including how to configure multiple databases, enable alerts, and set up the data storage directory.
2.2 - Whitelist Tables
SWS controls which PeopleSoft tables can be queried through a whitelist. You need to whitelist every table that psLens reads.
Whitelist Tables
SWS controls which PeopleSoft tables can be queried through a whitelist. You need to whitelist every table that psLens reads. The full list of tables (organized by feature area) is documented in the Reference section.
This page contains the SQL inserts you run once during installation. After running them, restart psLens (or wait for the next whitelist cache refresh) and confirm the Settings > Database Connections page shows the database as fully connected with no missing-table warnings.
Note: You may have configured the SWS client to use a different Permission List (CLASSID) other than CHG_PSOFTLENS_API_USER. If so, replace that value in every statement below.
Note: The LASTUPDDTTM column uses Oracle’s SYSDATE function. On SQL Server, replace SYSDATE with GETDATE().
Allow access to the whitelist record itself
C_SWS_REC_WL is the SWS-provided record psLens reads to discover the active whitelist. Granting access to it is required before any other whitelisted table can be queried.
Run all of the inserts below. Each block matches a category in the Reference page. If you add new functionality to psLens that queries a new record, add it here too.
When psLens gains a feature that queries a new PeopleSoft table, two things have to happen:
Add the table to the matching block above, then re-run that single INSERT against each PeopleSoft database.
Document the table on the Reference page so the broader documentation stays in sync.
2.3 - Configuration
psLens reads a config.yaml file from the same directory as the binary.
Configuration
psLens reads a config.yaml file from the same directory as the binary. There is no database to set up; persistent data (report results, alert state) is stored in an embedded NATS data store.
Full Configuration Examples
psLens supports configuration in either YAML (config.yaml) or JSON (config.json) format. The application detects the format automatically on boot.
YAML Configuration Example (config.yaml)
# Schema validation pointer (optional, for IDE support)# yaml-language-server: $schema=http://localhost:8080/static/config-schema.jsonserver:port:8080host:"0.0.0.0"natsStoreDir:"./data/nats"projectStoreDir:"./data/projects"dmsStoreDir:"./data/dms"appBaseURL:"http://localhost:8080"recentlyViewed:maxItems:20databases:- name:"PROD"description:"Production PeopleSoft HR"baseURL:"https://psft.example.com:8000/PSIGW/RESTListeningConnector/PSFT_HR/CHG_SWS_PSOFTQL/"username:"PSLENS_API"password:"your-api-password"piaURL:"https://psft.example.com/psp/ps/"timezone:"America/Chicago"production:truealerts:enabled:trueintervalMinutes:10- name:"DEV"description:"Development Environment"baseURL:"https://psftdev.example.com:8000/PSIGW/RESTListeningConnector/PSFT_HR/CHG_SWS_PSOFTQL/"username:"PSLENS_API"password:"dev-api-password"timezone:"America/Chicago"production:falsedowntimes:- name:"Nightly Downtime"enabled:truestartTime:"22:00"endTime:"06:00"daysOfWeek:[1,2,3,4,5]- name:"Weekend Maintenance"enabled:truestartAt:"2026-07-04T00:00:00Z"endAt:"2026-07-05T23:59:59Z"alerts:enabled:trueintervalMinutes:5checks:long_running_processes:enabled:truethresholdMinutes:20anomalyMultiplier:4.0anomalyMinBaselineMinutes:10process_errors:enabled:truelookbackHours:24ib_operation_errors:enabled:truelookbackHours:24ib_pub_contract_errors:enabled:truelookbackHours:24ib_sub_contract_errors:enabled:truelookbackHours:24ib_operation_stalled:enabled:truethresholdMinutes:30ib_pub_contract_stalled:enabled:truethresholdMinutes:30ib_sub_contract_stalled:enabled:truethresholdMinutes:30genericSWSAlerts:- id:"stale_users"name:"Stale User Accounts"enabled:trueseverity:"warning"alertOn:"row_found"message:"Warning: Stale user accounts detected"query:records:- recordName:"PSOPRDEFN"sqlWhereClause:"LASTUPDDTTM < CAST('2026-01-01' AS TIMESTAMP) AND ACCTLOCK = 0"rowLimit:5auth:enabled:trueauthorizedUsers:- "admin@example.com"- "auditor@example.com"smtp:host:"smtp.mailtrap.io"port:"2525"username:"smtp-user"password:"smtp-password"fromName:"psLens Alerts"fromEmail:"alerts@pslens.example.com"notifications:subscriptions:- id:"team-email"enabled:truealertTypes:["*"]databases:["PROD"]severityMin:"warning"type:"email"target:"psoft-alerts@example.com"- id:"slack-webhook"enabled:truealertTypes:["process_errors","ib_operation_errors"]databases:["*"]type:"webhook"target:"https://hooks.slack.com/services/T00000000/B00000000/XXXXXXXXXXXXXXXXXXXXXXXX"- id:"teams-webhook"enabled:truealertTypes:["*"]databases:["*"]type:"webhook"target:"https://example.webhook.office.com/webhookb2/..."reports:- id:"security-full-access-permlists"enabled:truedbNames:["PROD"]schedule:interval:"daily"timeOfDay:"02:00"emailTarget:"psoft-alerts@example.com"
JSON Configuration Example (config.json)
{"$schema":"http://localhost:8080/static/config-schema.json","server":{"port":8080,"host":"0.0.0.0","natsStoreDir":"./data/nats","projectStoreDir":"./data/projects","dmsStoreDir":"./data/dms","appBaseURL":"http://localhost:8080","recentlyViewed":{"maxItems":20}},"databases":[{"name":"PROD","description":"Production PeopleSoft HR","baseURL":"https://psft.example.com:8000/PSIGW/RESTListeningConnector/PSFT_HR/CHG_SWS_PSOFTQL/","username":"PSLENS_API","password":"your-api-password","piaURL":"https://psft.example.com/psp/ps/","timezone":"America/Chicago","production":true,"alerts":{"enabled":true,"intervalMinutes":10}},{"name":"DEV","description":"Development Environment","baseURL":"https://psftdev.example.com:8000/PSIGW/RESTListeningConnector/PSFT_HR/CHG_SWS_PSOFTQL/","username":"PSLENS_API","password":"dev-api-password","timezone":"America/Chicago","production":false}],"alerts":{"enabled":true,"intervalMinutes":5,"checks":{"long_running_processes":{"enabled":true,"thresholdMinutes":20,"anomalyMultiplier":4.0,"anomalyMinBaselineMinutes":10},"process_errors":{"enabled":true,"lookbackHours":24},"ib_operation_errors":{"enabled":true,"lookbackHours":24},"ib_pub_contract_errors":{"enabled":true,"lookbackHours":24},"ib_sub_contract_errors":{"enabled":true,"lookbackHours":24},"ib_operation_stalled":{"enabled":true,"thresholdMinutes":30},"ib_pub_contract_stalled":{"enabled":true,"thresholdMinutes":30},"ib_sub_contract_stalled":{"enabled":true,"thresholdMinutes":30}},"genericSWSAlerts":[{"id":"stale_users","name":"Stale User Accounts","enabled":true,"severity":"warning","alertOn":"row_found","message":"Warning: Stale user accounts detected","query":{"records":[{"recordName":"PSOPRDEFN","sqlWhereClause":"LASTUPDDTTM < CAST('2026-01-01' AS TIMESTAMP) and ACCTLOCK = 0"}],"rowLimit":5}}]},"auth":{"enabled":true,"authorizedUsers":["admin@example.com","auditor@example.com"]},"smtp":{"host":"smtp.mailtrap.io","port":"2525","username":"smtp-user","password":"smtp-password","fromName":"psLens Alerts","fromEmail":"alerts@pslens.example.com"},"notifications":{"subscriptions":[{"id":"team-email","enabled":true,"alertTypes":["*"],"databases":["PROD"],"severityMin":"warning","type":"email","target":"psoft-alerts@example.com"},{"id":"slack-webhook","enabled":true,"alertTypes":["process_errors","ib_operation_errors"],"databases":["*"],"type":"webhook","target":"https://hooks.slack.com/services/T00000000/B00000000/XXXXXXXXXXXXXXXXXXXXXXXX"},{"id":"teams-webhook","enabled":true,"alertTypes":["*"],"databases":["*"],"type":"webhook","target":"https://example.webhook.office.com/webhookb2/..."}]},"reports":[{"id":"security-full-access-permlists","enabled":true,"dbNames":["PROD"],"schedule":{"interval":"daily","timeOfDay":"02:00"},"emailTarget":"psoft-alerts@example.com"}]}
Server Settings
The server section controls how psLens listens for incoming connections and where it stores data.
Setting
Default
Description
port
8080
TCP port psLens listens on
host
0.0.0.0
Network interface to bind (use 127.0.0.1 to restrict to localhost)
natsStoreDir
./data/nats
Directory for persistent NATS data (report results, alert history)
Tip: The natsStoreDir should be on a persistent volume. If psLens restarts, report results and alert history stored here are preserved.
Database Connections
You can configure one or more PeopleSoft databases under the databases list. psLens monitors the health of each connection and shows status on the dashboard.
Setting
Required
Description
name
Yes
Short identifier shown in the UI (e.g., PROD, DEV)
description
Yes
Human-readable label for the database
baseURL
Yes
Full URL to the SWS psoftQL endpoint, including the service name
username
Yes
PeopleSoft operator ID for API authentication
password
Yes
Password for the operator ID
piaURL
No
Base URL for PeopleSoft Internet Architecture (used for deep links to PeopleSoft pages, if supported)
timezone
No
IANA timezone name for the database server (e.g., America/Chicago). Defaults to UTC if not set. Used to interpret timestamps correctly.
downtimes
No
List of scheduled downtime windows to suppress alerts and monitoring.
notifications
No
Database-specific notification delivery settings (bypasses global subscriptions).
Scheduled Downtimes
Downtimes allow silencing alerts and pausing connection health checks for non-production environments that go offline regularly (e.g., overnight or on weekends).
Each entry in the downtimes list supports the following settings:
Setting
Required
Description
name
Yes
Identifier for the downtime window.
enabled
Yes
Whether the downtime rule is active.
startTime
No
Start time of day in HH:MM format (e.g., 22:00). Set together with endTime.
endTime
No
End time of day in HH:MM format (e.g., 06:00). An end time earlier than the start crosses midnight. 24:00 means end of day, so an all-day window is 00:00–24:00.
daysOfWeek
No
Array of integers for days of week. 0 is Sunday, 1 is Monday, …, 6 is Saturday. Omit to apply every day. An overnight window belongs to the day it starts.
startAt
No
Specific start timestamp in RFC3339 format (e.g., 2026-07-04T00:00:00Z) for one-off maintenance.
endAt
No
Specific end timestamp in RFC3339 format (e.g., 2026-07-05T23:59:59Z) for one-off maintenance.
startTime/endTime are wall-clock times in the connection’s timezone (UTC if unset). Rules are validated when the configuration is saved; a rule must define a recurring window (startTime + endTime) and/or a one-off range (startAt/endAt).
When a database is in a scheduled downtime, the connection manager sets its status to Downtime on the dashboard, background alert checks are skipped (including the Integration Broker down check), email/webhook notifications are suppressed, and the database does not count against overall health. When the window ends, psLens rechecks the connection immediately and treats the first failed check as a real outage — size windows to cover the system’s boot time.
A weekend window that spans from Saturday evening to Monday morning is composed of two rules, since an overnight window belongs to its start day:
downtimes:- name:"Weekend nights"enabled:truestartTime:"22:00"endTime:"06:00"daysOfWeek:[6,0]# Sat night -> Sun morning, Sun night -> Mon morning- name:"Sunday all day"enabled:truestartTime:"00:00"endTime:"24:00"daysOfWeek:[0]
The baseURL Format
The baseURL is the Integration Broker REST endpoint for the SWS service. It follows this pattern:
By default, alert notifications for all databases are routed using global subscription rules (see Notifications & Webhooks Settings).
However, you can configure database-specific notifications under the notifications property of a database entry. Doing so acts as a complete override: all alerts (regardless of severity level) and resolutions for that specific database are routed directly to the database-level targets, bypassing global subscriptions entirely.
Each entry in the notifications block supports the following settings:
Setting
Type
Description
emailEnabled
Boolean
Activates email notifications for this database.
emailTarget
String
Comma-separated list of recipient email addresses.
webhookEnabled
Boolean
Activates webhook notifications for this database.
webhookTarget
String
Webhook destination URL (e.g., Slack, MS Teams, or a generic endpoint).
Example database connection configuration with inline notifications:
Each alert type under checks supports some or all of the following settings:
Setting
Description
enabled
Whether this check is active
thresholdMinutes
For stalled/long-running checks: how many minutes before flagging (default varies by check). For long_running_processes, this is the fallback static threshold.
lookbackHours
For error checks: how many hours back to look for failures (default varies by check)
excludeProcesses
List of process names to skip (for process-related checks)
excludeOperations
List of IB operation names to skip (for Integration Broker checks)
anomalyMultiplier
Multiplier applied to the rolling median duration to calculate the dynamic threshold (default: 4.0)
anomalyMinBaselineMinutes
Minimum baseline duration in minutes. Dynamic thresholds are capped to be at least this value to prevent false alerts on very fast processes (default: 10)
Available Alert Checks
Check Key
Name
Description
long_running_processes
Long-Running Processes
Flags processes running longer than their rolling median-based expected runtime (or thresholdMinutes fallback)
process_errors
Process Errors
Finds processes that failed within lookbackHours (default: 24 hours)
ib_operation_errors
IB Operation Errors
Finds async IB operations in Error or Timeout status within lookbackHours (default: 24 hours)
ib_pub_contract_errors
IB Publication Contract Errors
Finds pub contracts in Error or Timeout status within lookbackHours (default: 24 hours)
ib_sub_contract_errors
IB Subscription Contract Errors
Finds sub contracts in Error or Timeout status within lookbackHours (default: 24 hours)
ib_operation_stalled
IB Operations Stalled
Finds async IB operations stuck in New or Working status longer than thresholdMinutes (default: 30 min)
ib_pub_contract_stalled
IB Publication Contracts Stalled
Finds pub contracts stuck in New or Working status longer than thresholdMinutes (default: 30 min)
ib_sub_contract_stalled
IB Subscription Contracts Stalled
Finds sub contracts stuck in New or Working status longer than thresholdMinutes (default: 30 min)
locked_oprid_processes
Locked OPRID Scheduled Processes
Finds queued or scheduled processes whose submitting OPRID has a locked account
backlogged_processes
Backlogged Processes
Detects processes currently stuck in a Queued or Blocked state longer than thresholdMinutes (default: 30 min)
queue_latency
Queue Latency
Detects processes that experienced a start delay (BEGINDTTM - RUNDTTM) greater than thresholdMinutes (default: 15 min)
failed_logins
Failed Logins
Detects users with excessive failed login attempts in PSPTLOGINAUDIT (defaults to > thresholdCount of 5)
process_run_check
Process Run Check
Monitors configured critical processes and alerts when they haven’t run successfully within their configured time window
ib_operation_volume
Abnormal IB Operation Volume
Detects when IB operation instance volume exceeds the historical average by a percentage specified in thresholdCount (default: 50)
ib_pub_contract_volume
Abnormal IB Pub Contract Volume
Detects when IB publication contract volume exceeds the historical average by a percentage specified in thresholdCount (default: 50)
ib_sub_contract_volume
Abnormal IB Sub Contract Volume
Detects when IB subscription contract volume exceeds the historical average by a percentage specified in thresholdCount (default: 50)
ib_sync_exceptions
IB Sync Operation Exceptions
Detects synchronous service operations with errors in PSIBLOGHDR within lookbackHours (default: 24 hours). Disabled by default.
no_process_completed
No Process Completed
Fires when no process has successfully completed within the lookbackHours (default: 1 hour)
ib_down
Integration Broker Down
Alerts when SWS REST endpoint connection failures indicate the Integration Broker is down
weblib_down
Web Server / WebLib Down
Alerts when PeopleSoft Web Server is down or configured WebLib URLs fail to respond
ib_no_active_domain
IB No Active Domain
Alerts when there is no active domain found in PSAPMSGDOMSTAT
ib_dispatcher_down
IB Dispatcher Down
Alerts when an Integration Broker dispatcher process is inactive or has not updated status within thresholdMinutes (default: 10 min)
ib_nodes_down
IB Nodes Down
Alerts when there are entries in PSNODESDOWN indicating message nodes are down
Authentication Settings
The auth section configures native email-based magic link authentication. When enabled, users must log in using an email verification code sent to an address on the authorized allowlist.
Setting
Default
Description
enabled
false
Set to true to require magic link authentication for all pages
authorizedUsers
[]
List of email addresses allowed to log in (case-insensitive)
SMTP Settings
The email server is edited in the app under Settings → Notifications (Email Server card). Changes apply to alert and report emails immediately; login (magic link) emails pick them up after the next server restart. A blank password on save keeps the stored password.
The smtp block in config.yaml seeds the email server on first boot only; after that, the settings saved in the UI are authoritative. PSLENS_SMTP_* environment variables override both and make the card read-only in the UI.
Setting
Default
Description
host
-
SMTP server hostname/IP
port
-
SMTP port (e.g. 25, 465, 587, 2525)
username
-
Username for SMTP authentication
password
-
Password for SMTP authentication (encrypted at rest if master key is set)
fromName
psLens
Sender name shown in emails
fromEmail
-
Sender email address for SMTP
Outbound email can be tested on the same card: enter a recipient address under Send Test Email and click Send Test. The result is recorded in Alert Delivery History.
Notifications & Webhooks Settings
Notification rules decide where alert messages are dispatched. They are managed in the app under Settings → Notifications (Notification Rules card), where each rule can be added, edited, tested, and deleted. The notifications section in config.yaml defines the same rules in file form (the file calls them subscriptions).
Subscription Sub-settings
Under notifications.subscriptions, define a list of targets:
Property
Type
Description
id
String
Unique identifier for the subscription
enabled
Boolean
Activates or silences the subscription
alertTypes
List of Strings
Alert check keys to match (e.g. ["*"] for all, or ["process_errors"])
For production deployments, you should restrict access to the psLens interface.
Recommended Security Controls
Enable Built-In Magic Link Auth:
Turn on auth.enabled and configure SMTP credentials and authorizedUsers to require code validation on login.
Setup a Master Key (PSLENS_MASTER_KEY):
Provide a 32-byte (64 hex characters) key in the PSLENS_MASTER_KEY environment variable. All database and SMTP passwords entered in the UI or configuration are then encrypted at rest using AES-256-GCM.
Reverse Proxy / VPN:
Place psLens behind a reverse proxy (e.g., Cloudflare Access, oauth2-proxy, nginx, Tailscale) to delegate authentication to your company’s Identity Provider (SAML/OIDC). When using an external SSO proxy, you can keep auth.enabled disabled and restrict the psLens binary to bind only on 127.0.0.1 or internal networks.
Warning: Never expose psLens to the public internet without either turning on the built-in magic-link auth or placing an authenticated reverse proxy in front of it. Doing so exposes read access to PeopleSoft system metadata.
Active Configuration and Hot-Reloading
psLens keeps its settings in two places:
Active configuration (embedded key-value store): when you edit connections, credentials, email settings, alert schedules, or notification rules in the web interface, changes are saved here and take effect immediately without a server restart. Every change is kept as a numbered revision under Settings → Change History, where any revision can be viewed or restored.
config.yaml on disk: the bootstrap file that seeds the active configuration on first boot. Saved changes are also written back to it as a backup on the persistent storage volume.
Configuration Seeding
On initial boot, or when the environment variable PSLENS_FORCE_SEED_CONFIG=true is set, the application seeds the active configuration from config.yaml.
If the active configuration drifts from config.yaml, the Settings → Advanced page shows a “Settings differ from the config.yaml file on disk” notice. To resolve it:
Click Load settings from config.yaml on the Advanced page to overwrite the active configuration with the file contents (this discards changes made in the UI).
If the file path is writable, click Overwrite config.yaml on disk to write the active configuration to the file. On containerized or ephemeral deployment models (like fly.io without persistent storage volumes), these local file changes will be lost when the container restarts or is re-deployed.
Alternatively, copy the Active Configuration YAML from the Advanced page into your config.yaml file to bring the disk file in sync.
Secret Key Management (Encryption at Rest)
When the PSLENS_MASTER_KEY environment variable is set with a 32-byte hex-encoded key, all database and SMTP passwords entered in the UI are encrypted at rest. If the master key is not configured, passwords are saved in plaintext.
Rotating the Master Key
To rotate the cryptographic key used for credential encryption:
Enter a new 32-byte hex key in the Rotate Encryption Key field.
Click Rotate Master Key. The server decrypts all stored credentials using the old key and re-encrypts them with the new key in NATS KV.
Update the PSLENS_MASTER_KEY environment variable in your deployment configuration (e.g., Fly.io secrets or .env file) to match the new key before restarting the container. If the container restarts with a mismatched key, it cannot decrypt the configuration.
2.4 - Deployment Options
This page is for clients who want to host psLens themselves in a Docker container. It covers three questions in order:
Deployment Options
This page is for clients who want to host psLens themselves in a Docker container. It covers three questions in order:
How do I get the image? Distribution and authentication.
How do I upgrade without losing my config? Volumes, env vars, and the master key.
How do I do HTTPS? Six TLS options compared on the same axes.
If you just want a 5-minute install on a private network, the Installation page is enough. Come back here when you’re ready to put psLens in front of real users.
1. Image Distribution
psLens is published to the GitHub Container Registry (GHCR) as a private package. Cedar Hills Group issues a read-only token to each client.
Authenticating
Cedar Hills Group sends you a GitHub fine-grained personal access token (PAT) scoped to read:packages on the pslens package only.
The credentials are stored in ~/.docker/config.json. They persist across host reboots.
Verify the pull works:
docker pull ghcr.io/cedarhillsgroup/pslens:latest
Image Tags
The release pipeline publishes four tag flavors for every release:
Tag
Example
Use when
latest
ghcr.io/cedarhillsgroup/pslens:latest
Dev/test only — never pin production here
vMAJOR.MINOR.PATCH
:v1.4.2
Production — exact reproducibility
vMAJOR.MINOR
:v1.4
Production — auto-pickup of patch releases
Git SHA
:a3f8c12
Pinning to a pre-release build
Recommended: Pin production to vMAJOR.MINOR. You’ll automatically pick up patch fixes when you re-run docker compose pull, but never get an unexpected breaking change from a minor or major version bump.
When You Can’t Reach ghcr.io
If the Docker host can’t make outbound HTTPS to ghcr.io (common in segmented enterprise networks), use the air-gapped flow documented in Installation:
# On a machine with internet access:docker pull ghcr.io/cedarhillsgroup/pslens:v1.4.2
docker save ghcr.io/cedarhillsgroup/pslens:v1.4.2 | gzip > pslens-v1.4.2.tar.gz
# Transfer the .tar.gz to the target host (USB, internal artifact repo, etc.), then:docker load < pslens-v1.4.2.tar.gz
You can also mirror the image into your own private registry (Harbor, AWS ECR, Azure ACR, GitLab Registry). Pull it once, retag, push, and reference the mirrored image in your docker-compose.yml. Cedar Hills Group is happy to provide a one-time pull script if you need to automate this.
Troubleshooting Pull Failures
Error
Cause
Fix
denied: denied
Token expired or revoked
Renew the PAT with Cedar Hills Group
unauthorized
Token has the wrong scope
PAT needs read:packages on the pslens package
no basic auth credentials
docker login wasn’t run, or ~/.docker/config.json was lost
Re-run docker login ghcr.io
manifest unknown
The tag you asked for doesn’t exist yet
Check the release notes for available tags
2. Configuration and Secrets
The most failure-prone part of self-hosted deployment is preserving configuration and secrets through upgrades. This section is explicit about what survives docker compose pull && docker compose up -d and what doesn’t.
What Persists, What Doesn’t
Persistent (must be on a volume):
/data/nats — NATS JetStream store. Contains the recently-viewed objects KV, the report store (generated markdown reports), alert state, and, if you use the in-app config UI, the AES-256-encrypted database passwords KV.
/data/projects — project store for uploaded .zip project archives.
/app/config.yaml — bind-mounted from the host filesystem.
Ephemeral (re-created on every container start):
Whitelist cache (re-fetched from PeopleSoft on startup).
PIA URL discovery cache.
In-memory session state.
The default docker-compose.yml in Installation already wires the persistent items correctly: a named volume pslens_data mounted at /data, and config.yaml bind-mounted at /app/config.yaml:ro. As long as you don’t docker volume rm pslens_data, your data survives any number of image upgrades.
Three Configuration Modes
There are three ways to source configuration. Pick one based on how many people will administer the system and how you manage secrets.
Mode
Where config lives
Where secrets live
Best for
A. File-only
config.yaml bind-mounted from host
Plaintext in config.yaml
Internal-only dev/test
B. File + env override
config.yaml for non-secrets
PSLENS_DB_{NAME}_PASSWORD env vars, sourced from .env or a secrets manager
Recommended default for client-hosted
C. KV-encrypted
Minimal config.yaml; full config in NATS KV bucket, AES-256 encrypted at rest
Encrypted blob in /data/nats, unlocked by PSLENS_MASTER_KEY
Multi-admin setups where you use the in-app config UI
Mode B example (recommended)
config.yaml:
server:port:8080host:"0.0.0.0"appBaseURL:"https://pslens.example.com"natsStoreDir:"/data/nats"databases:- name:"PROD"description:"Production HCM"baseURL:"https://psft.example.com:8000/PSIGW/RESTListeningConnector/PSFT_HR/CHG_SWS_PSOFTQL/"username:"PSLENS_API"password:"placeholder"# Overridden by PSLENS_DB_PROD_PASSWORDtimezone:"America/Chicago"
.env (sibling of docker-compose.yml, chmod 600, gitignored):
docker-compose.yml references env_file: .env; Docker injects every variable into the container at startup.
Tip: The env-var override convention is PSLENS_DB_{NAME}_PASSWORD where {NAME} is the database name from config.yaml, uppercased. For a database named DEV_HR, the variable is PSLENS_DB_DEV_HR_PASSWORD.
About PSLENS_MASTER_KEY
In production, psLens requiresPSLENS_MASTER_KEY to be set. It’s used to encrypt database passwords stored in the NATS KV bucket. Generate one once:
openssl rand -base64 32
Critical: back this key up out-of-band in your password manager, AWS Secrets Manager, HashiCorp Vault, or wherever you keep root-of-trust secrets. If you lose the master key, the encrypted password blob in /data/nats becomes unrecoverable and you’ll have to re-enter every database password.
Backups
Daily backup of the data volume is one line:
docker run --rm \
  -v pslens_data:/data \
  -v $(pwd):/backup \
  alpine tar czf /backup/pslens-data-$(date +%F).tar.gz -C / data
What to back up where:
Data volume (pslens_data) — daily tarball, retain 14-30 days. Captures reports, alert state, and encrypted passwords KV.
config.yaml — check into your infrastructure-as-code repo (gitignore the password fields, or use the placeholder pattern from Mode B).
.env — store in your secrets manager. Never check this into git.
To restore: stop psLens, docker volume create pslens_data, untar into the volume, restart.
3. TLS / HTTPS Options
psLens does not terminate TLS in the binary by default. It listens on plain HTTP and expects either a reverse proxy, an in-binary TLS configuration, or a tunnel to provide HTTPS.
There are six viable options. They’re compared below on the same axes: certificate source, automation, operational complexity, and the scenario each fits best.
Quick recommendation
Your scenario
Recommended option
Default — most clients
Option 3: Caddy sidecar
Corporate PKI with certs-as-code
Option 4: nginx sidecar (or Option 1 if minimalist)
Internal-only, small team, already using Tailscale
Option 6: Tailscale Serve / Funnel
Already running Traefik
Option 5: Traefik
Public internet, single host, no proxy wanted
Option 2: in-binary autocert
Details on each option follow.
Option 1: Go-native TLS via crypto/tls (cert files)
psLens loads a PEM cert + key from disk and serves TLS directly. No reverse proxy, no extra container, no external dependencies.
Status: This requires a small code change to psLens (currently the binary only listens on plain HTTP). Contact Cedar Hills Group if you need this option — it’s roughly 30 lines of Go and a config block. Tracked in the backlog.
Cert cache lives in /data/acme so it survives container restarts as long as the pslens_data volume does. psLens listens on :80 for the ACME HTTP-01 challenge and :443 for TLS.
Axis
Detail
Certificate source
Let’s Encrypt (free, 90-day, auto-renewed at ~60 days)
Renewal
Fully automatic, in-process
Hot reload
N/A — the library reloads on its own renewal cycle
Pros
Cheapest TLS, zero ops effort after initial config
Cons
Requires port 80 reachable from the public internet for HTTP-01 challenge; rules out fully internal deployments
Best for
Public-internet hosts on a real domain (pslens.client.com)
Option 3: Caddy sidecar
Run Caddy as a second service in the same docker-compose.yml. Caddy terminates TLS and reverse-proxies to psLens on the internal Docker network.
You’ll need to add Caddy’s root cert to client browsers (push it via MDM) so they trust the internal cert.
docker-compose.yml addition:
services:pslens:image:ghcr.io/cedarhillsgroup/pslens:v1.4expose:- "8080"# no longer "ports:" — only Caddy needs an external portvolumes:- ./config.yaml:/app/config.yaml:ro- pslens_data:/dataenv_file:.envrestart:unless-stoppedcaddy:image:caddy:2-alpineports:- "80:80"- "443:443"volumes:- ./Caddyfile:/etc/caddy/Caddyfile:ro- caddy_data:/data- caddy_config:/configrestart:unless-stoppedvolumes:pslens_data:caddy_data:caddy_config:
Axis
Detail
Certificate source
Let’s Encrypt (public), or Caddy’s built-in CA (tls internal)
Renewal
Fully automatic; cert state in the caddy_data volume
Hot reload
Caddy reloads certs on its own renewal cycle
Pros
Trivial config, handles both public-internet and internal-only, decouples TLS from the app (restarting psLens doesn’t drop TLS sessions)
Cons
Second container to operate; internal CA requires distributing the root cert to clients
Best for
The default recommended option for most client deployments
Option 4: nginx sidecar
Same shape as Caddy but with nginx, using customer-provided cert files.
nginx.conf:
events{}http{server{listen443sslhttp2;server_namepslens.example.com;ssl_certificate/certs/pslens.crt;ssl_certificate_key/certs/pslens.key;ssl_protocolsTLSv1.2TLSv1.3;location/{proxy_passhttp://pslens:8080;proxy_set_headerHost$host;proxy_set_headerX-Real-IP$remote_addr;proxy_set_headerX-Forwarded-For$proxy_add_x_forwarded_for;proxy_set_headerX-Forwarded-Proto$scheme;# Server-Sent Events: disable buffering for the SSE endpoints
proxy_bufferingoff;proxy_cacheoff;}}server{listen80;server_namepslens.example.com;return301https://$host$request_uri;}}
Important for psLens: the proxy_buffering off directive is required. psLens relies on Server-Sent Events for most of the UI; with buffering enabled, the UI will appear frozen until pages finish loading entirely.
Cert renewal is a separate concern, typically certbot run as a host cron job that replaces the files in ./certs/ and signals nginx with docker compose exec nginx nginx -s reload.
Axis
Detail
Certificate source
Customer-managed PEM (corporate CA, commercial CA, certbot)
The most-deployed reverse proxy on earth; every enterprise ops team has nginx runbooks; easy to add request-level customization (auth, rate-limits, rewrites)
Cons
No built-in cert automation; more boilerplate than Caddy for the same outcome on the happy path
Best for
Clients who already standardize on nginx, or who need request-level customization
Option 5: Traefik sidecar
Same shape as Caddy but Traefik discovers routes from Docker labels on the psLens service. Useful only if the client already runs Traefik.
Bypass TLS-at-psLens entirely by exposing the service over a managed tunnel. TLS terminates at the tunnel provider’s edge; psLens stays on plain HTTP inside the tunnel.
Tailscale Serve (private to your tailnet — internal use):
You’ll get a URL like https://pslens.tailnet-name.ts.net. Tailscale issues and renews the cert. Only members of your tailnet can reach it.
Tailscale Funnel (public internet via Tailscale’s edge):
tailscale funnel --bg 443
Same URL shape; reachable from the public internet but rate-limited and not designed for high-volume traffic. Fine for an admin dashboard.
Cloudflare Tunnel (public, no inbound ports):
Install cloudflared on the Docker host (or run it as a sidecar container). Authenticate, create a tunnel, point a Cloudflare-managed DNS name at it.
Axis
Detail
Certificate source
Tunnel provider (Tailscale or Cloudflare)
Renewal
Fully automatic
Pros
Zero TLS config on the psLens side; no inbound ports opened on the firewall; mesh networking (Tailscale) is great for multi-DB connectivity
Cons
Adds a third-party dependency in the data path; some clients have policies against cloud tunnels for compliance-relevant tools; rate limits
Best for
Internal-only deployments where you want easy access for a small team without standing up a reverse proxy or opening firewall ports
4. Upgrades
The upgrade flow depends on whether you can reach ghcr.io and whether you’re pinning to a specific version. The data volume and config.yaml are untouched in all three cases.
Standard (online) upgrade
If you pinned to :latest or to a vMAJOR.MINOR tag that’s auto-receiving patch fixes:
cd /opt/pslens
docker compose pull pslens
docker compose up -d pslens
pull fetches the new image; up -d recreates the psLens container with the new image and reattaches the existing volume and config. Data is preserved.
Pinned-version upgrade (recommended for production)
To upgrade to v1.5: edit the file, then pull and recreate:
# Edit docker-compose.yml: v1.4 to v1.5docker compose pull pslens
docker compose up -d pslens
Rollback is a one-line edit back to the previous tag, then docker compose up -d pslens again. The old image is still in the local Docker cache (unless you ran docker image prune in between).
Air-gapped upgrade
# On a machine with internet:docker pull ghcr.io/cedarhillsgroup/pslens:v1.5
docker save ghcr.io/cedarhillsgroup/pslens:v1.5 | gzip > pslens-v1.5.tar.gz
# Transfer the .tar.gz to the target host, then:docker load < pslens-v1.5.tar.gz
docker compose up -d pslens
Cedar Hills Group’s breaking-change contract
Stable across minor versions: env-var names (PSLENS_DB_{NAME}_PASSWORD, PSLENS_MASTER_KEY), volume mount paths (/data, /app/config.yaml), and the data on disk.
Documented in CHANGELOG.md: any config schema change. Schema changes happen on major version bumps.
Automatic: NATS KV bucket schema migrations run on first start of a new version.
Before a major-version upgrade: always take a backup of the pslens_data volume (see Backups above). If something goes wrong, you can restore the volume and roll the image back to the previous tag.
How psLens connects to PeopleSoft: a small SWS framework inside your PeopleSoft environment, and a psLens Docker container hosted externally.
Architecture Overview
psLens has only two moving parts:
The SWS framework, a small Integration Broker service installed inside your PeopleSoft environment.
The psLens application, a single Docker container hosted externally (default: fly.io) or on your own infrastructure.
Everything psLens displays (search results, alerts, reports) flows over a single HTTPS connection from the psLens container into your SWS endpoint. There is no other channel.
The Short Version
Two components, nothing else. SWS inside PeopleSoft; psLens as a Docker container outside it.
Traffic only flows one way. psLens calls SWS over HTTPS. SWS never reaches out to psLens.
One protocol. REST + HTTP basic auth + psoftQL JSON queries. No database drivers, no ODBC, no jump hosts.
One scope. SWS only answers queries against PeopleTools metadata tables that you whitelist. Anything outside the list is rejected before it touches the database.
Dedicated deployment per customer. No shared psLens app, no shared storage, no multi-tenant SaaS backend.
How the Pieces Fit
%%{init: {"flowchart": {"htmlLabels": true, "padding": 16, "nodeSpacing": 60, "rankSpacing": 80, "subGraphTitleMargin": {"top": 10, "bottom": 14}}}}%%
flowchart LR
    USER(["Your team's<br/>web browser"])
    subgraph EXT["Cedar Hills Group hosted or your own infrastructure"]
        APP["psLens<br/>Docker container"]
    end
    subgraph PS["Your PeopleSoft Environment"]
        SWS["SWS Framework<br/>REST endpoint"]
        DB[("PeopleSoft DB<br/>read-only<br/>whitelisted tables")]
        SWS --> DB
    end
    USER -- "HTTPS" --> APP
    APP -- "HTTPS · Basic auth<br/>psoftQL JSON" --> SWS

    classDef ps fill:#e8f4fd,stroke:#0d6efd,stroke-width:2px,color:#000
    classDef ext fill:#fff5e6,stroke:#fd7e14,stroke-width:2px,color:#000
    classDef user fill:#e9f7ef,stroke:#198754,stroke-width:2px,color:#000
    classDef subgraphStyle fill:#fafafa,stroke:#666,stroke-width:1px,color:#000
    class SWS,DB ps
    class APP ext
    class USER user
    class PS,EXT subgraphStyle
Your team reaches psLens with any current web browser over HTTPS. There is no desktop client to install. Everything the user sees comes from the psLens container; the browser never talks to PeopleSoft directly.
Inside Your PeopleSoft Environment: SWS
The SWS framework is a small Integration Broker service Cedar Hills Group provides. Your PeopleSoft team installs it once, alongside everything else PeopleSoft already runs. It exposes a single REST endpoint that accepts a structured query language called psoftQL and returns JSON.
What SWS gives you control over:
The whitelist. Your PeopleSoft admins decide which PeopleTools metadata tables SWS is allowed to read. psLens cannot ask for anything off the list.
The credentials. SWS authenticates incoming requests with HTTP basic auth. Your team owns the token; rotating it is a config change on both ends.
The audit trail. Calls land on your Integration Broker like any other inbound service, visible in the tooling your team already monitors.
No PeopleSoft database username or password is ever shared with psLens.
Outside Your Environment: psLens Container
psLens itself is a single Docker container: one Go binary, with embedded NATS for storing alert history and report output. That’s the entire runtime.
Default deployment is on fly.io as a managed instance dedicated to your organization.
Self-hosting is fully supported. Docker, docker-compose, bare-metal, and air-gapped environments are all covered in the installation guide.
Stateless toward PeopleSoft. psLens does not copy your business data. The only things it persists are alert history and report output, both inside its own dedicated storage. See the Security & Trust page for details on what is and isn’t stored.
When you upgrade psLens, you pull a new container image. Nothing inside PeopleSoft changes.
psLens renders pages on the server with Go templates and streams updates over Server-Sent Events using Datastar. There is no React, no Angular, no JSON API. The browser receives HTML fragments over SSE (TLS at the transport layer) and renders them.
Two consequences fall out of this:
Nothing from PeopleSoft is stored in the browser. psLens does not write to LocalStorage, SessionStorage, or IndexedDB. Closing the tab takes the active session data with it.
No JSON wire format. The server sends pre-rendered HTML; there is no client-side data structure for an attacker to scrape or tamper with. Page transitions are server round-trips of a few KB of HTML, and the browser tab holds no result set.
Why This Shape
Bounded blast radius. Even in a worst case where the psLens container were compromised, the SWS whitelist is the ceiling on what an attacker could read. They cannot drop into PeopleSoft, run PeopleCode, or pivot to other tables.
Easy to upgrade and operate. New psLens features ship as a new container image. No PeopleSoft change request, no App Designer migration, no downtime on the PeopleSoft side.
Multi-environment from day one. A single psLens deployment can connect to DEV, TEST, and PROD at the same time. Point at the SWS endpoint in each environment via separate database entries in config.yaml.
Where Next
Installation installs SWS in PeopleSoft and runs the psLens container.
Configuration wires psLens to your PeopleSoft environments.
Security & Trust covers the read-only design, dedicated deployment, and what psLens does and doesn’t store.
3 - Use Cases
See how different PeopleSoft team members use psLens: developers, security administrators, system administrators, and business analysts.
Look up a record without opening App Designer. Catch a stuck IB message before users do. Audit who can run a web service from one screen.
Developers
Search records, fields, pages, components, SQL objects, and application packages from a browser. No App Designer VM, no menu navigation.
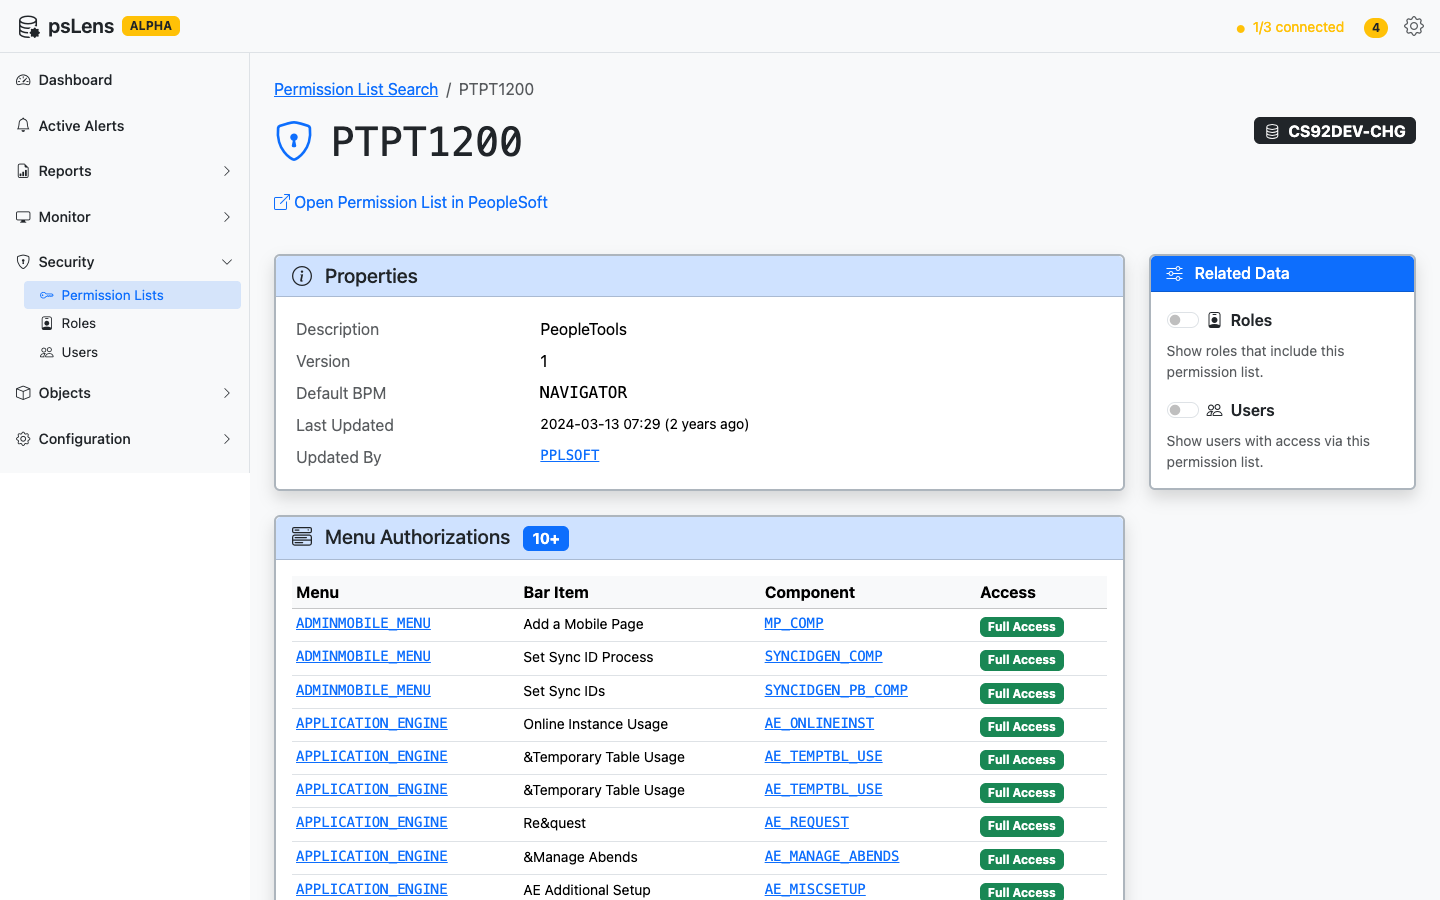
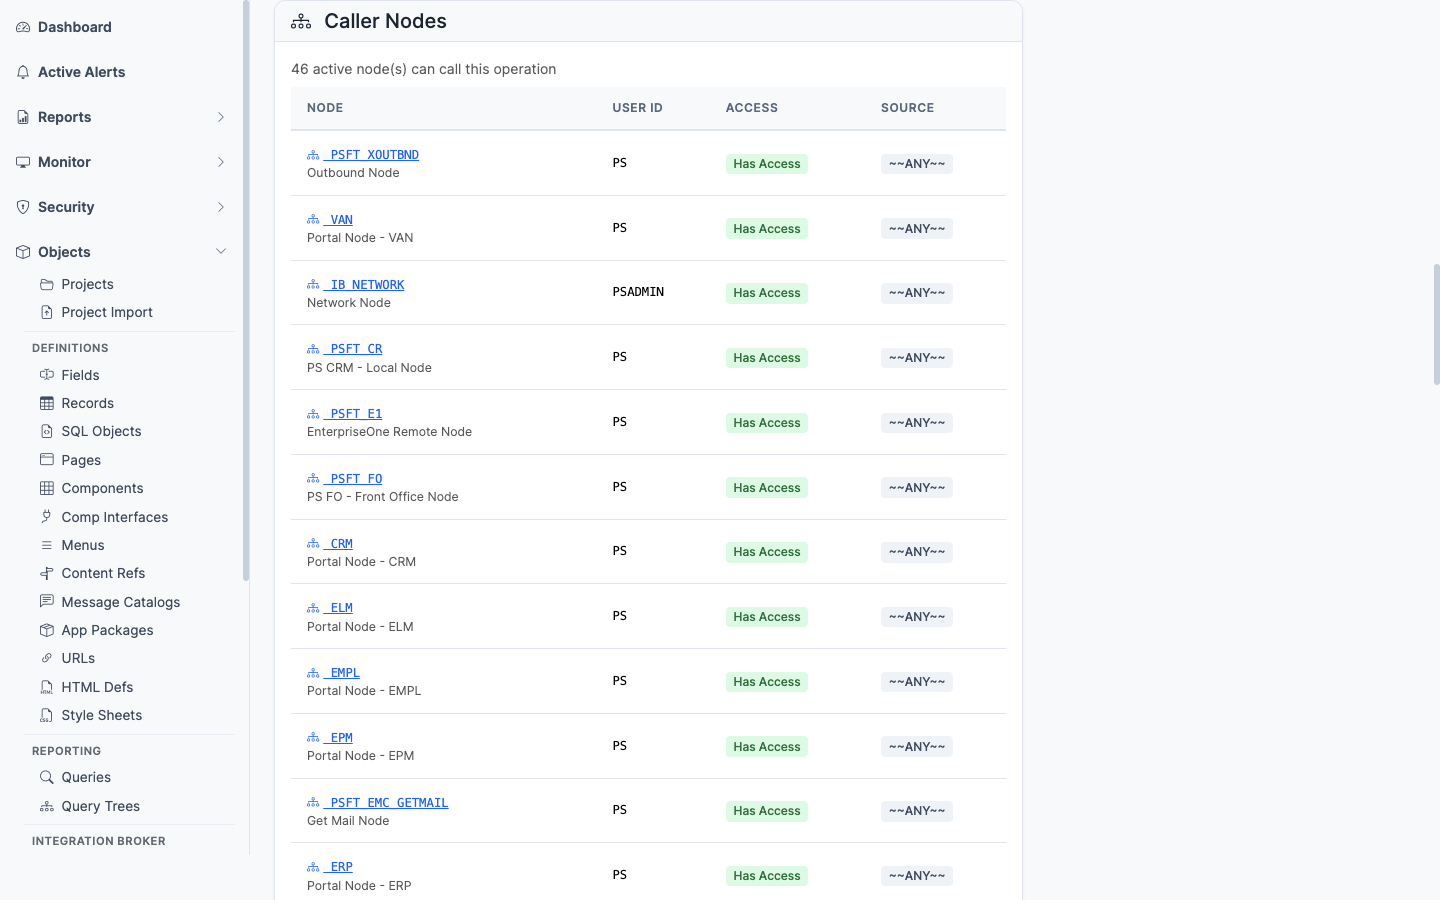
Reports surface permission lists granting access to hundreds of components, nodes without passwords, and web service endpoints anyone with PTPT1000 can call. Trace access from users through roles to permission lists in one screen.
Understand PeopleSoft configuration without needing App Designer or database access. Research components, security setup, and page structure independently.
Stop granting developer tools for research tasks. psLens gives your team read-only access to PeopleSoft object definitions without the security risk of App Designer.
Export PeopleSoft objects to Markdown and feed them to ChatGPT, Claude, or Copilot for code review, documentation, impact analysis, and knowledge transfer.
How PeopleSoft developers use psLens to research objects, understand code, and work faster without App Designer.
The Daily Grind
You are working on a customization. You need to check the structure of PSOPRDEFN, find which pages reference a specific record, or look up a Message Catalog entry. So you open a remote desktop session to the App Designer VM, wait for it to connect, launch App Designer, wait for it to load against the database, navigate through menus, and eventually find what you need. Then you do it again. And again.
On a busy day, you might spend more time looking things up than actually writing code.
Walkthrough: How developers use psLens to speed up daily lookups
How psLens Changes This
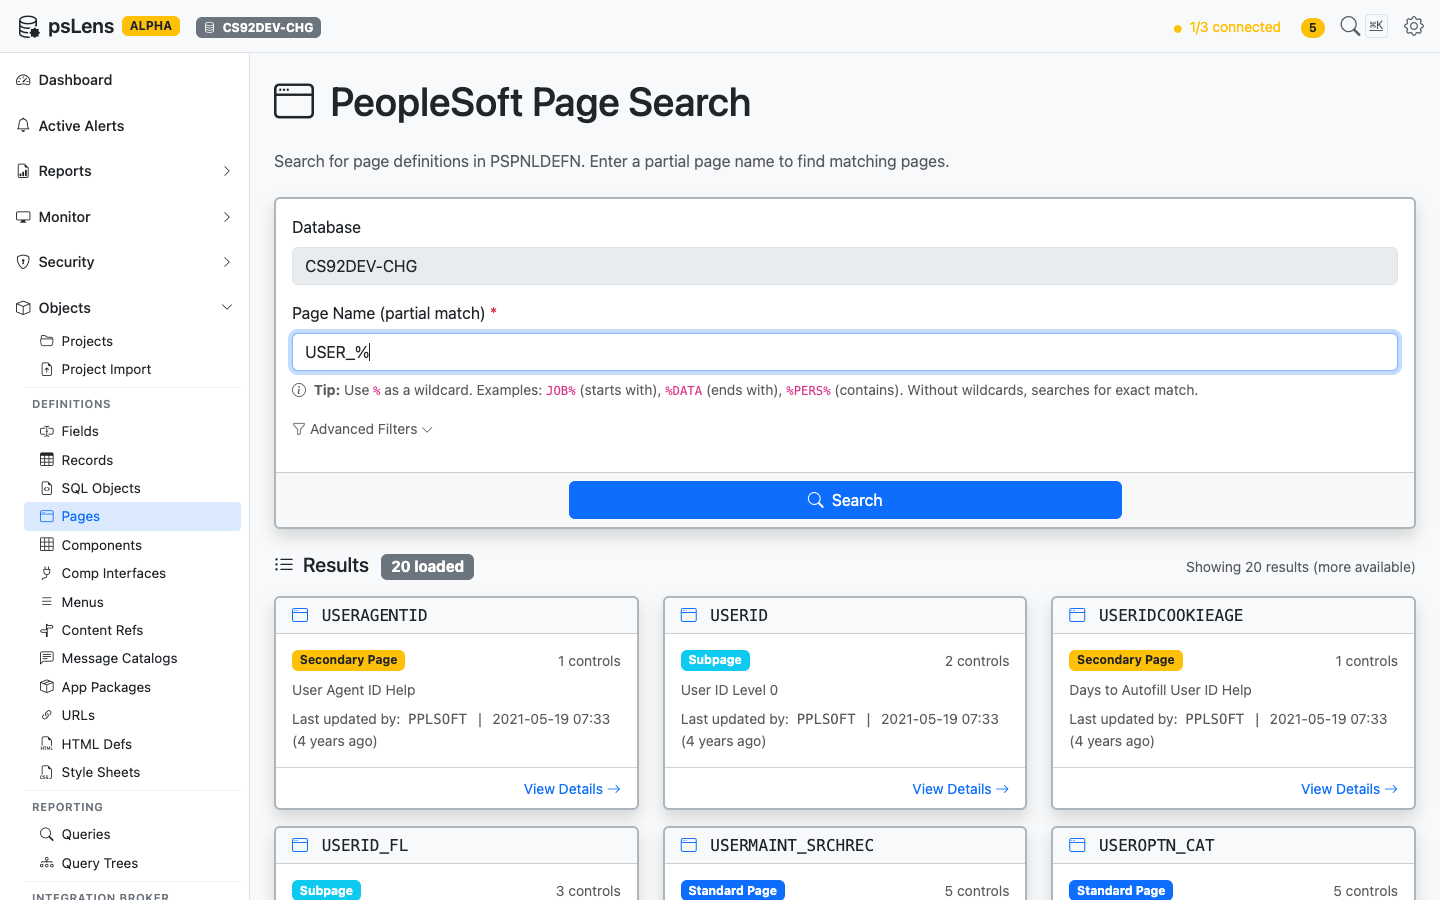
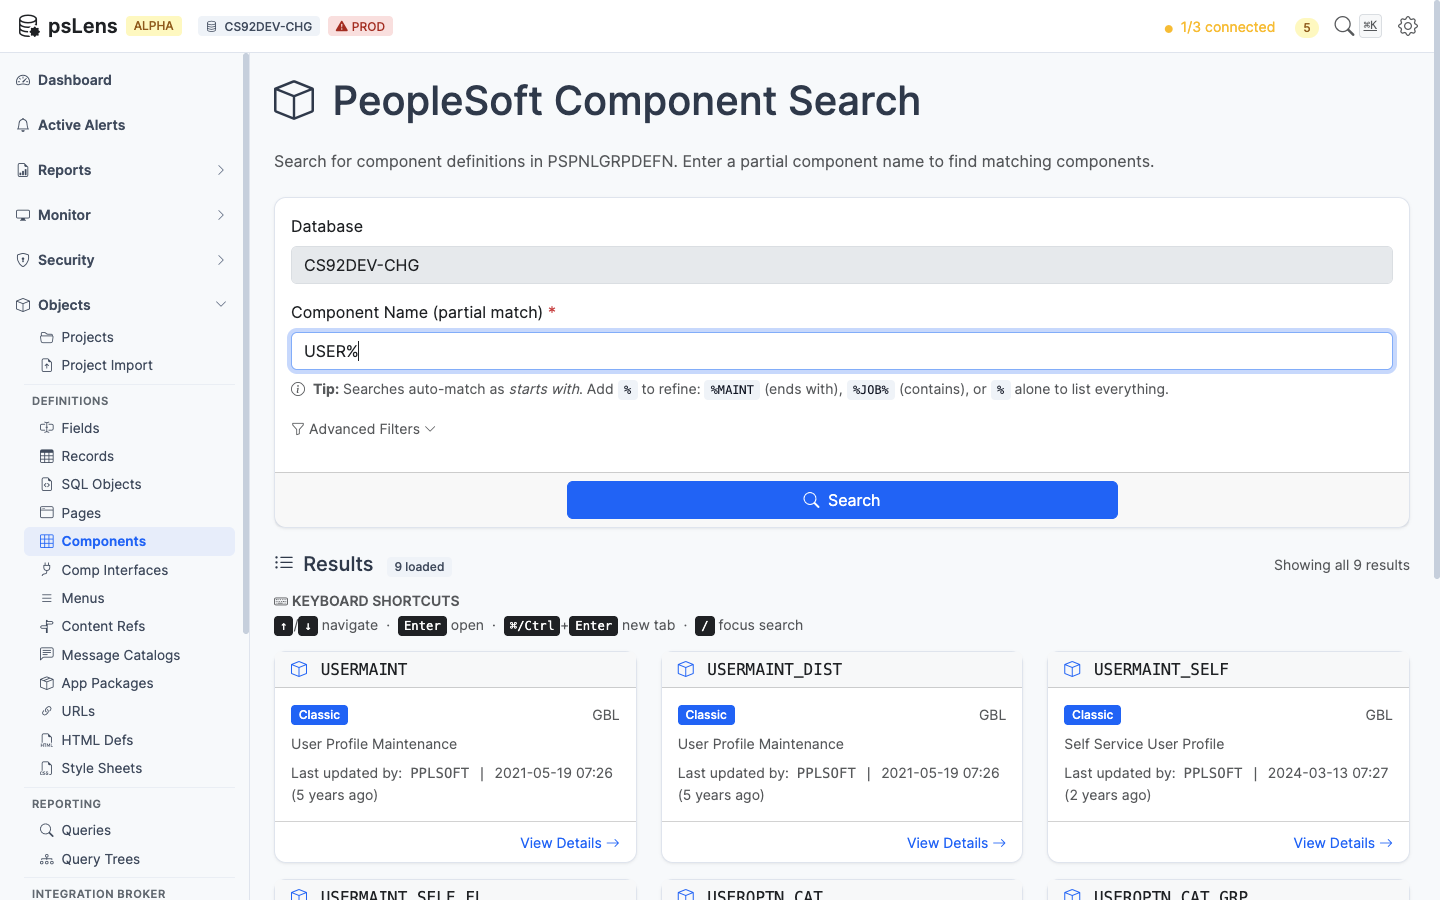
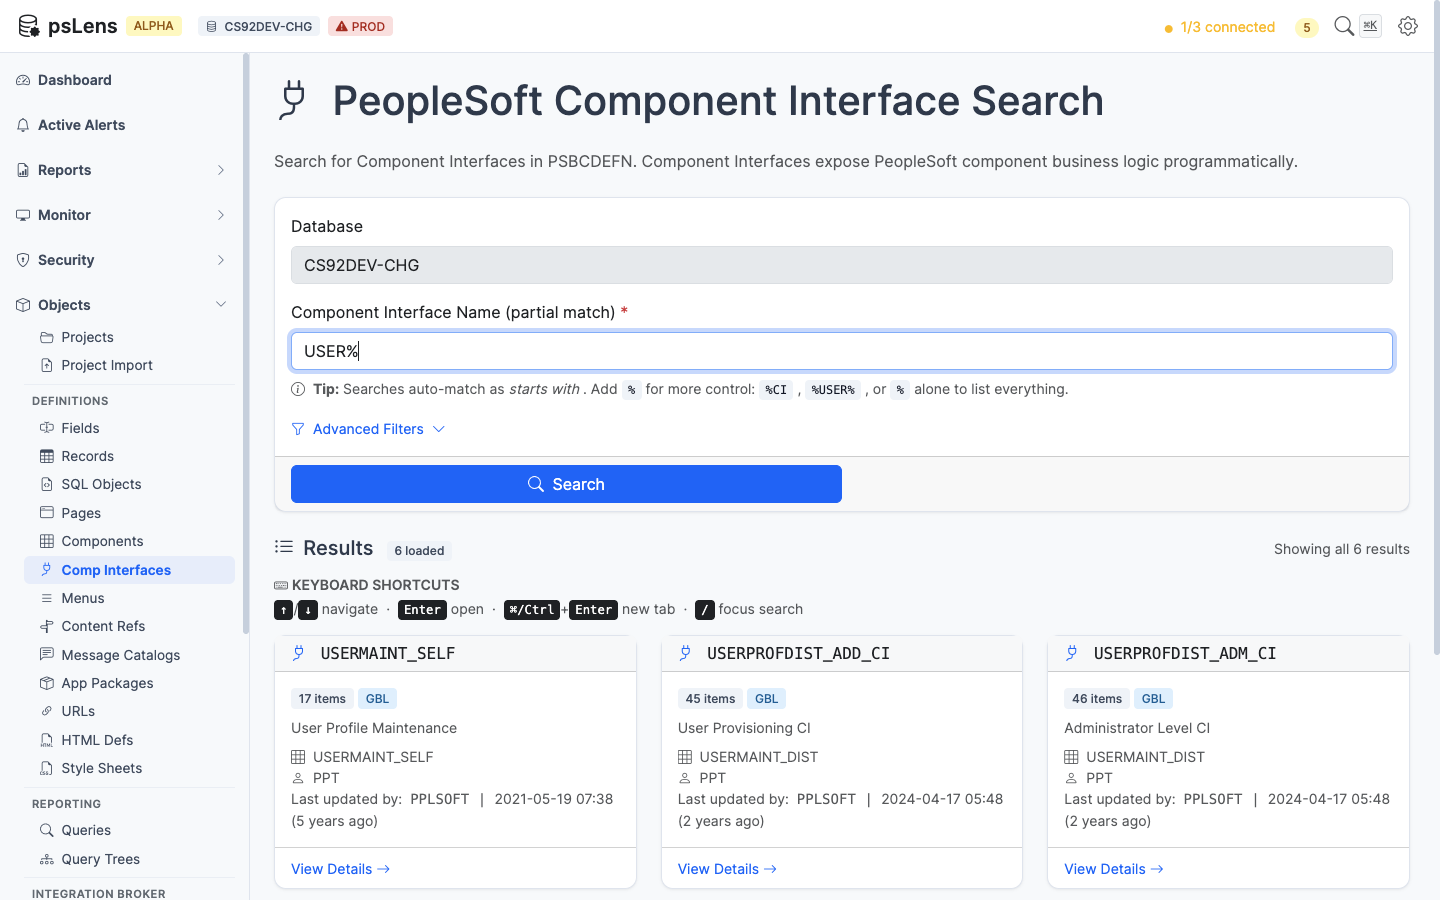
Instant Object Search
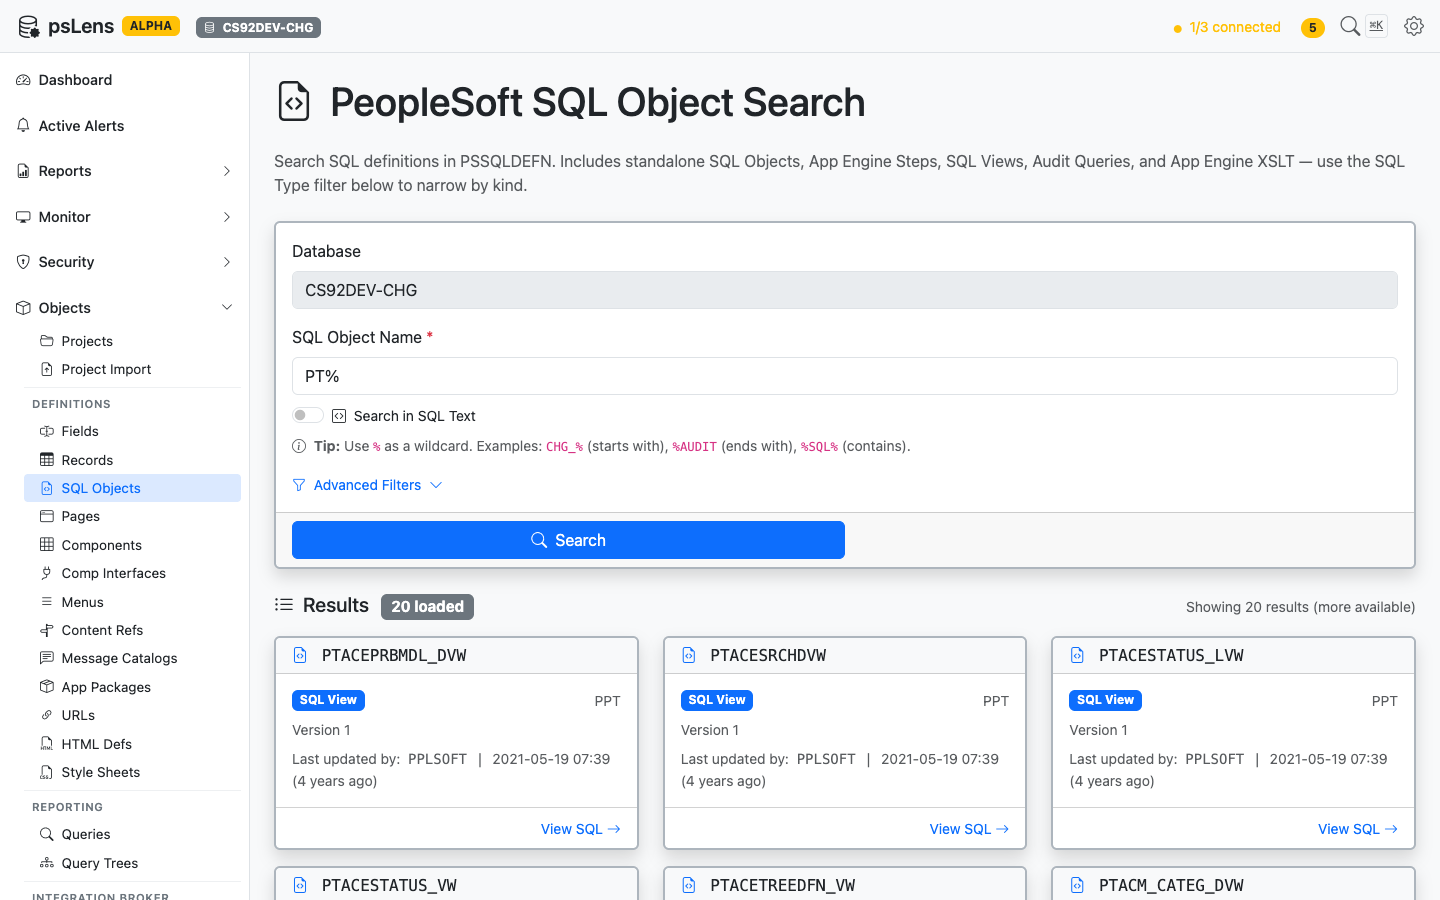
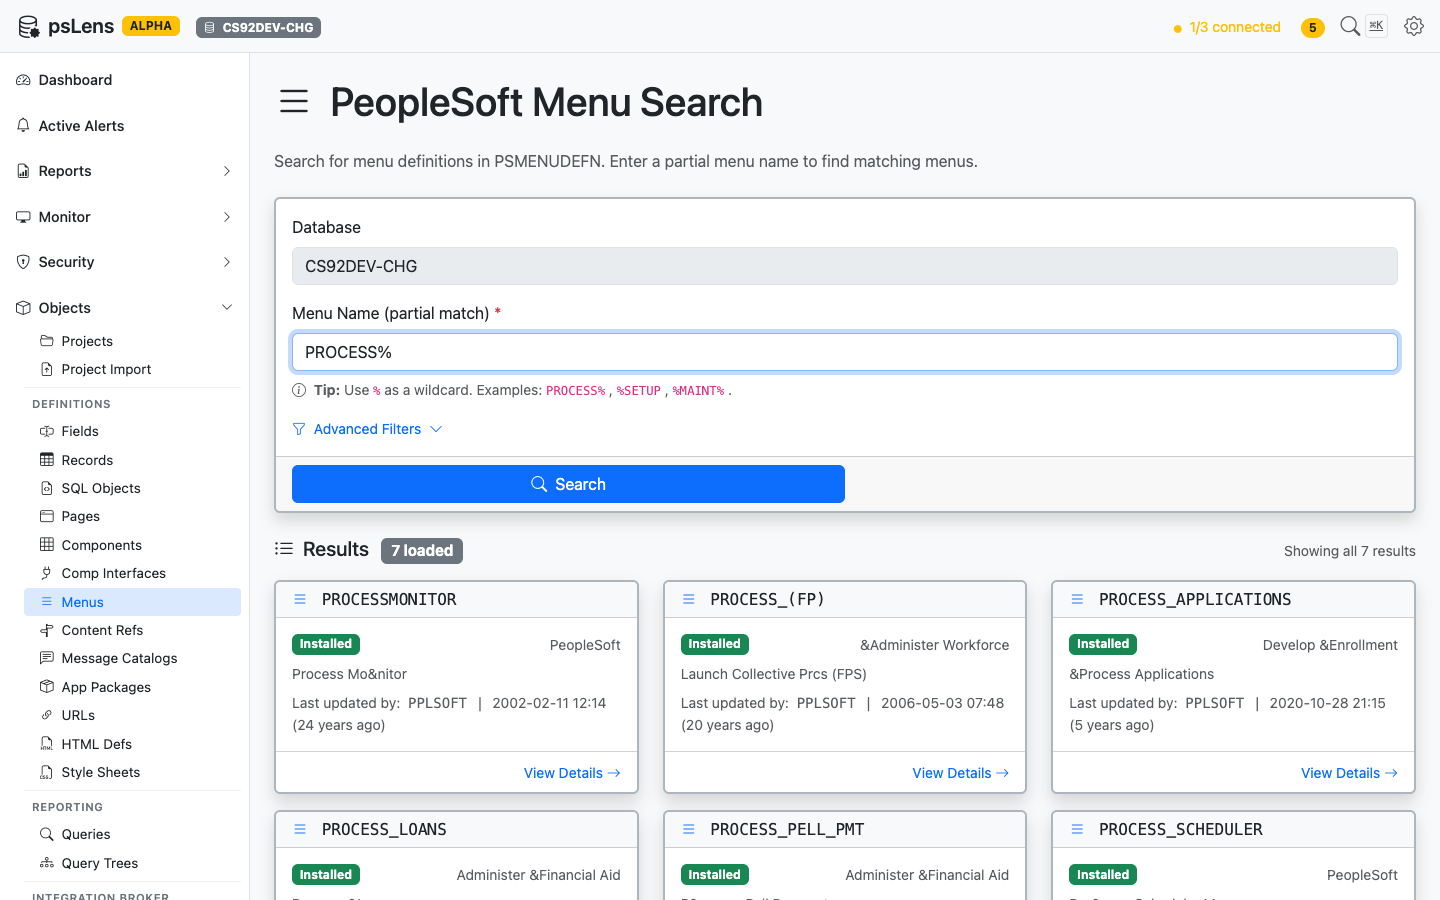
Type a record name, field name, or any PeopleSoft object identifier into psLens. Results render as you type. You skip the App Designer launch sequence and the menu walk entirely.
Search across all object types at once, or filter to exactly what you need: records, fields, pages, components, SQL objects, application packages, Application Engines, and more.
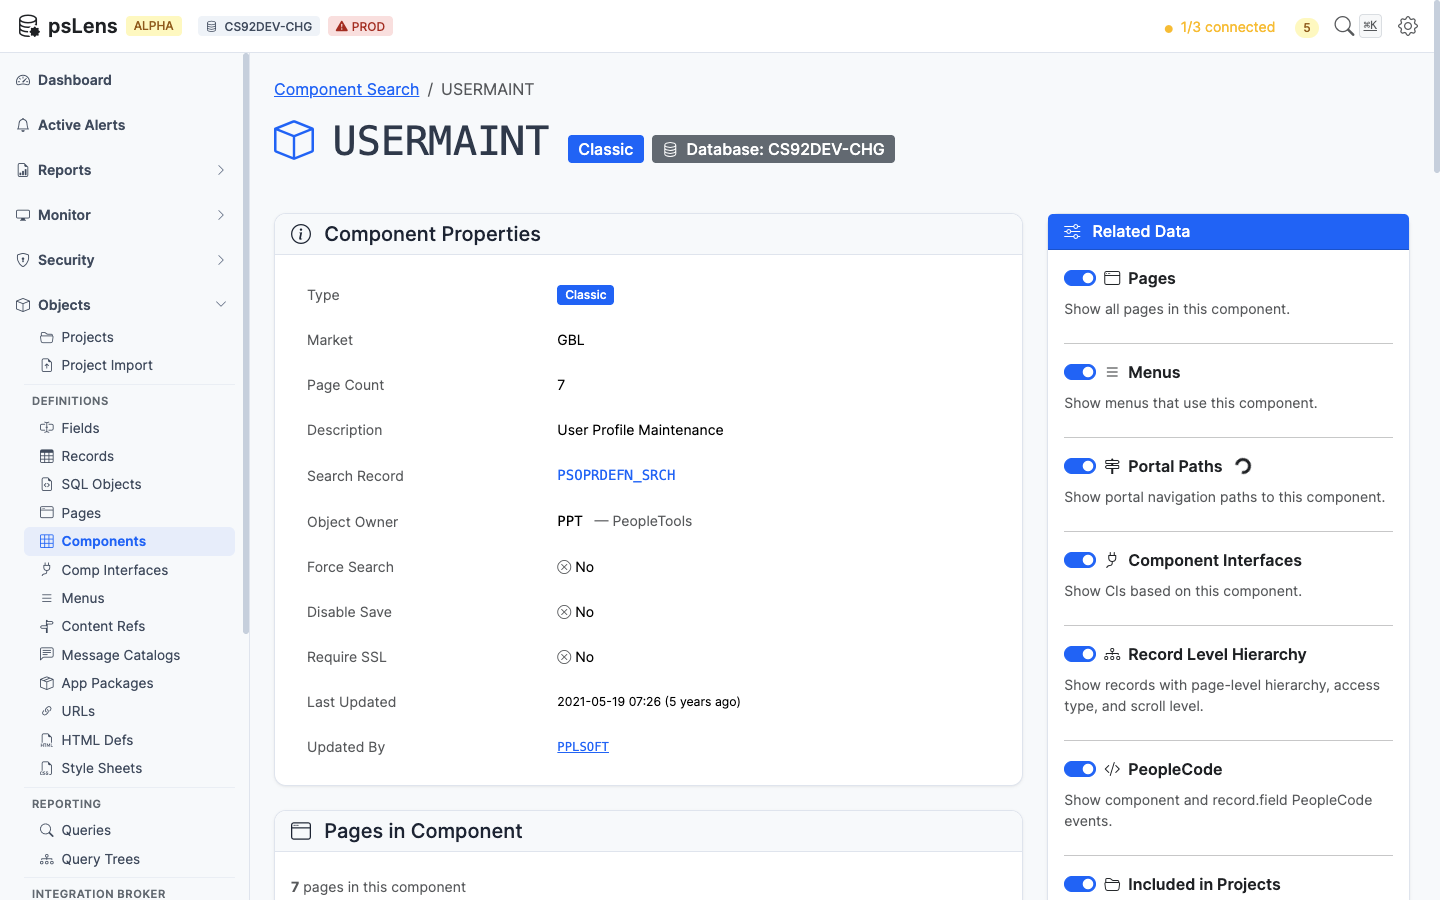
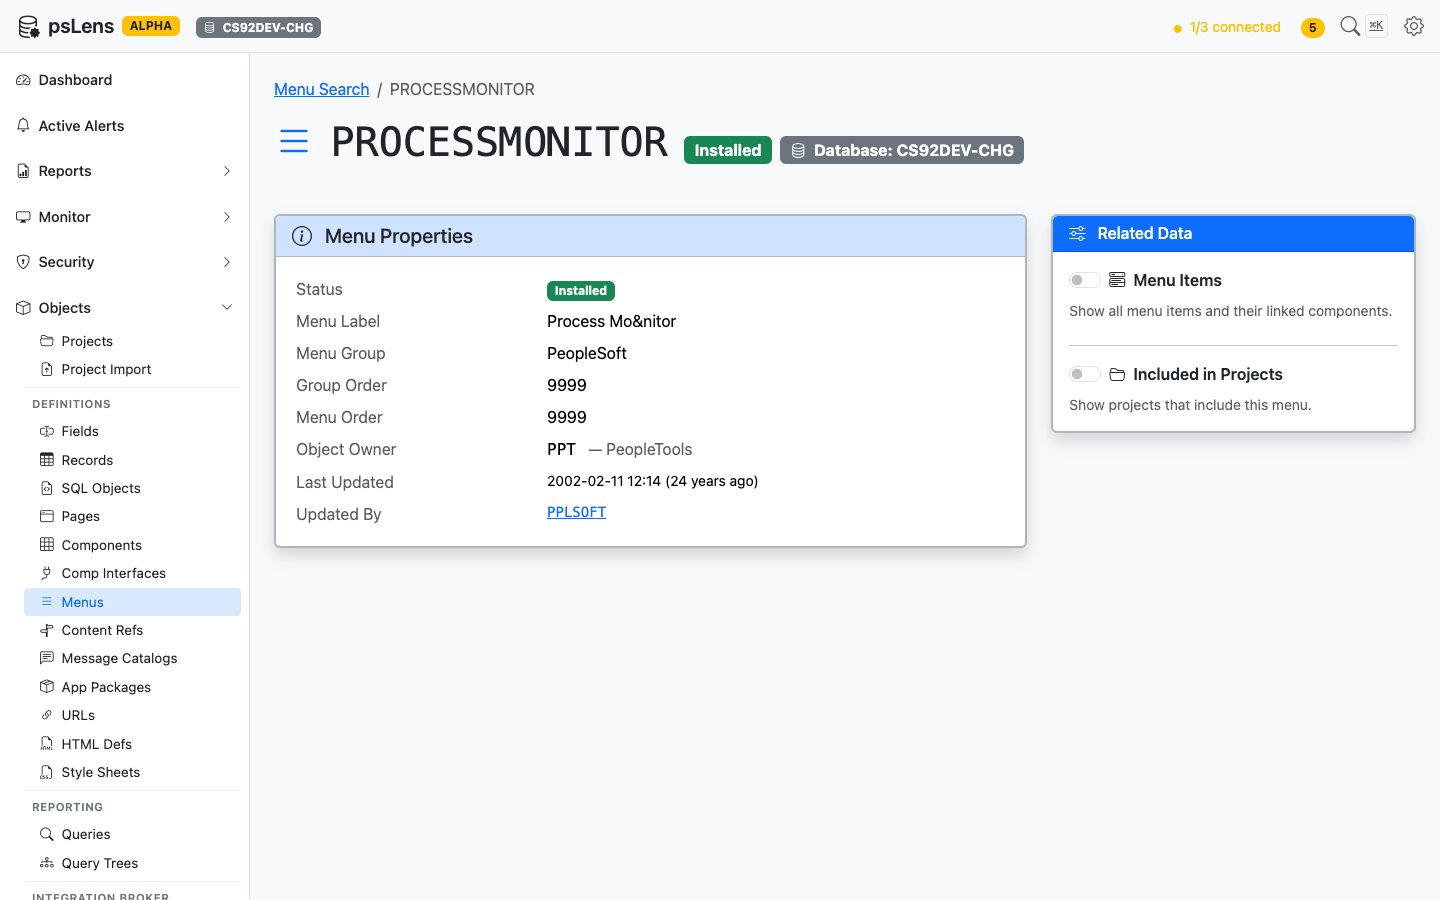
Understand Relationships
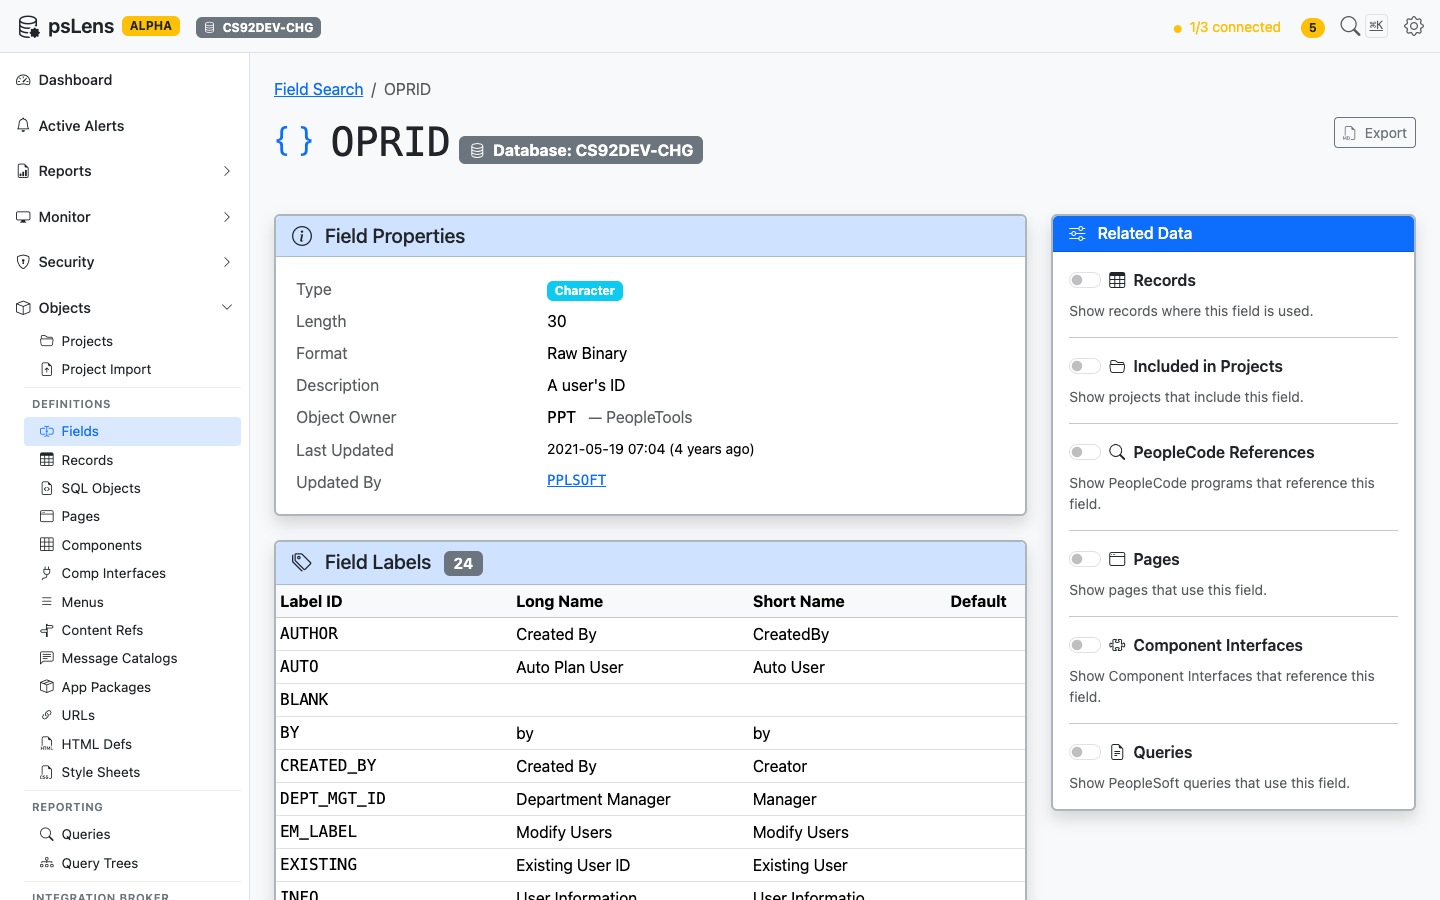
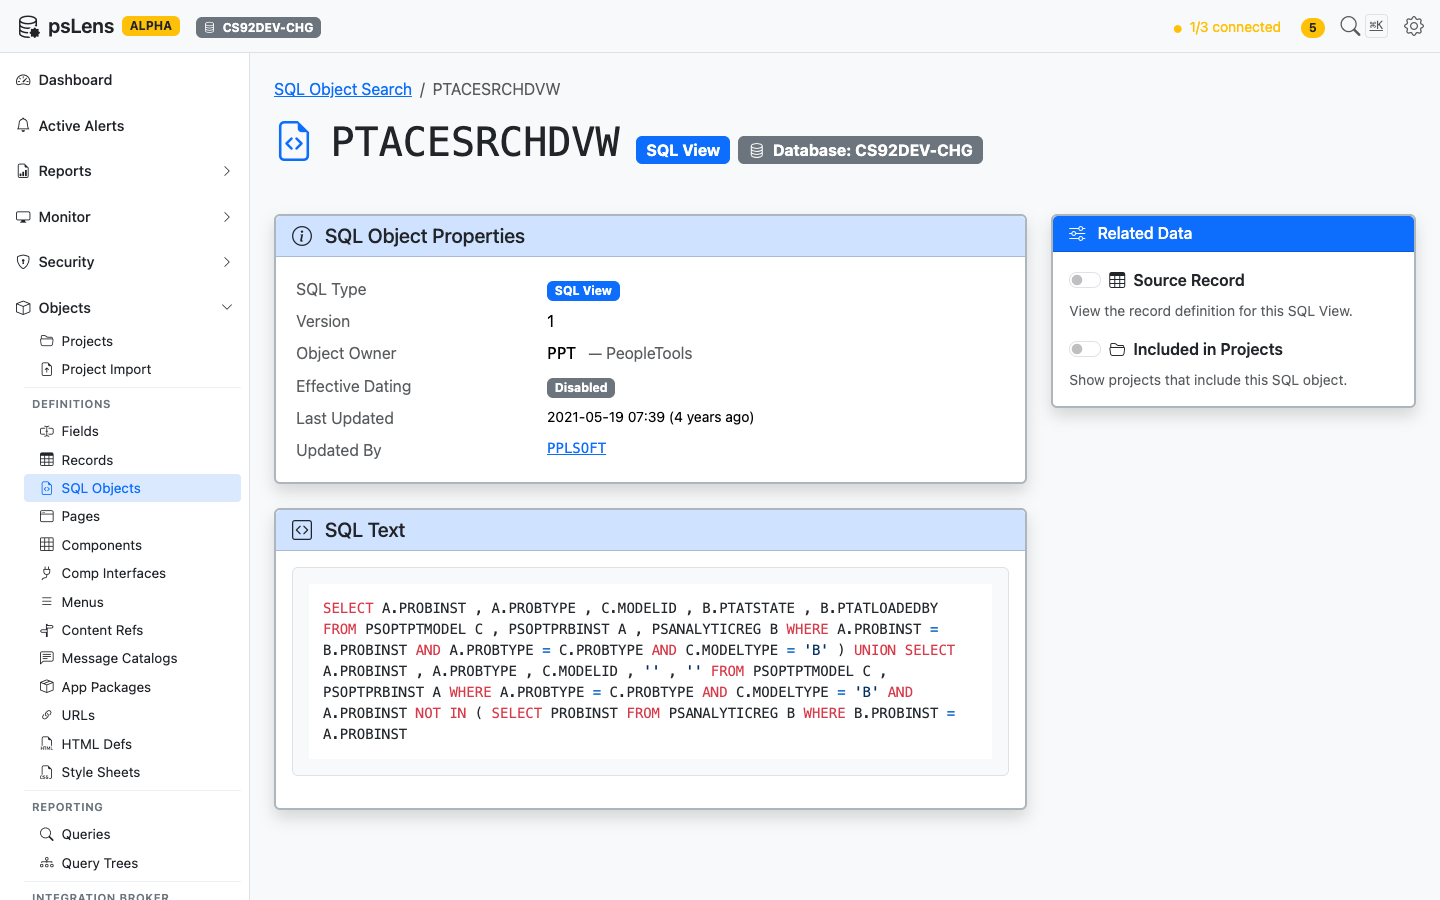
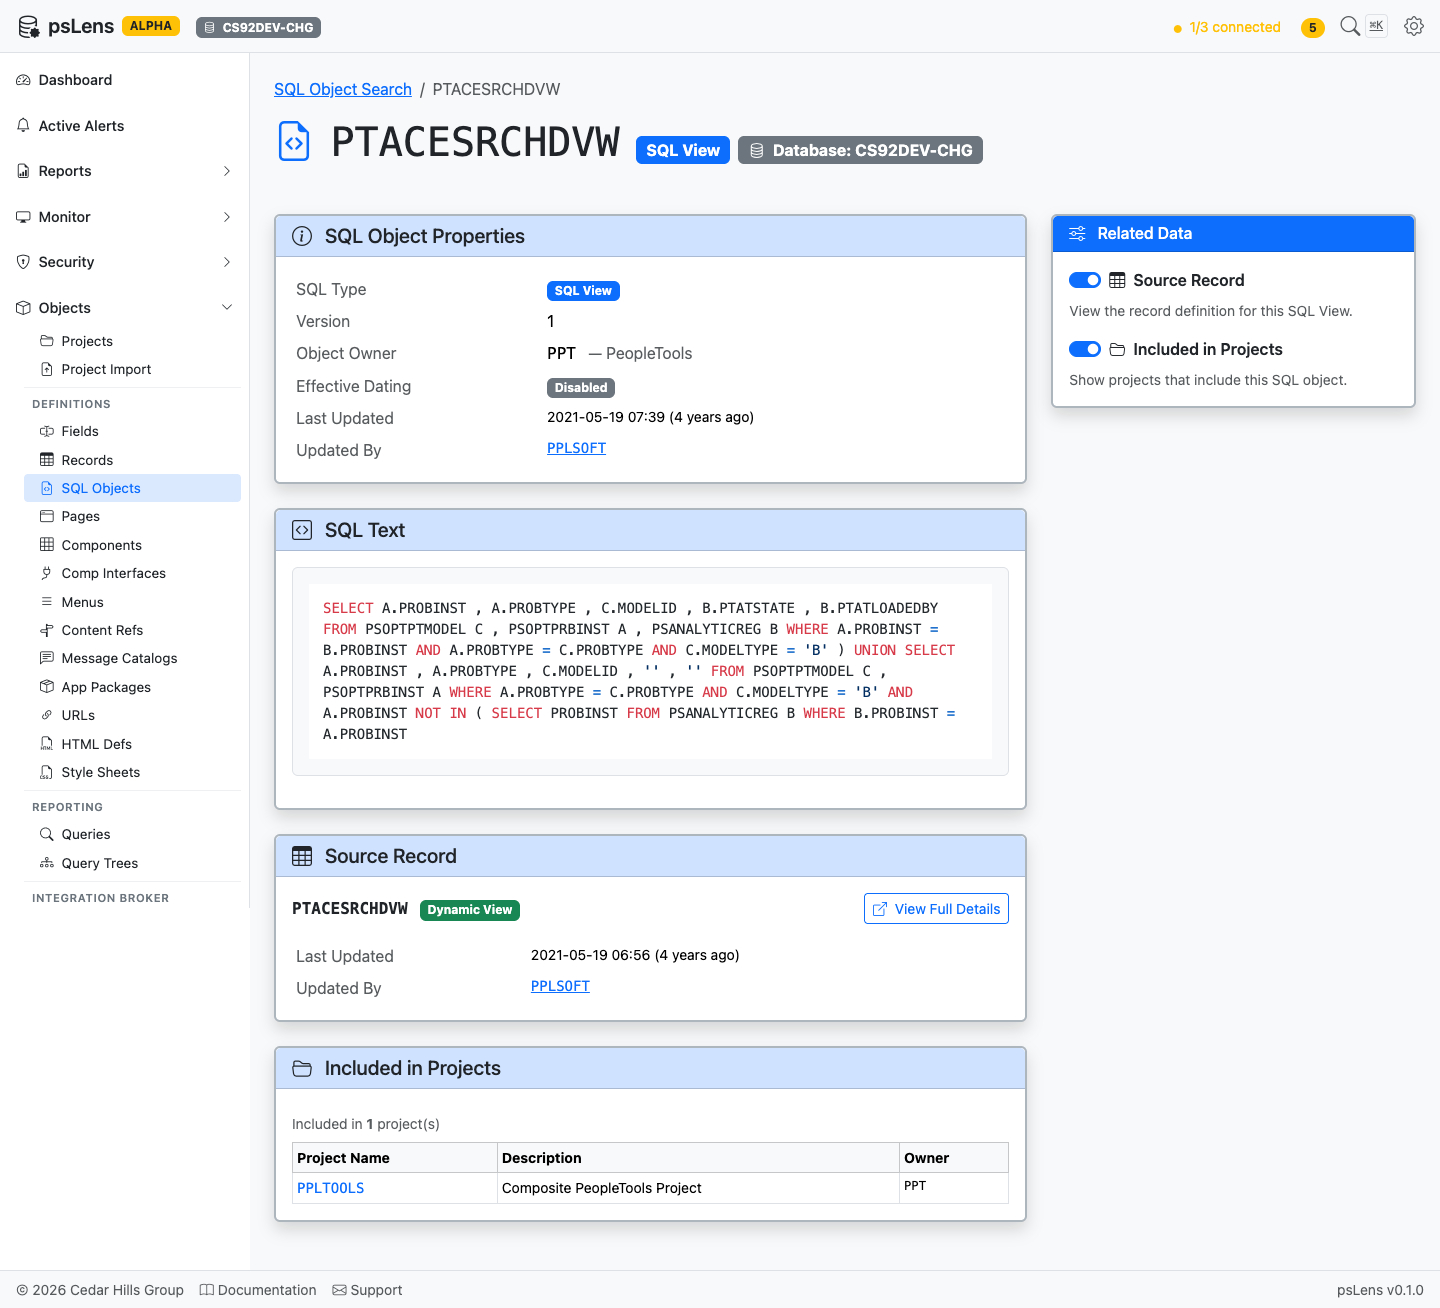
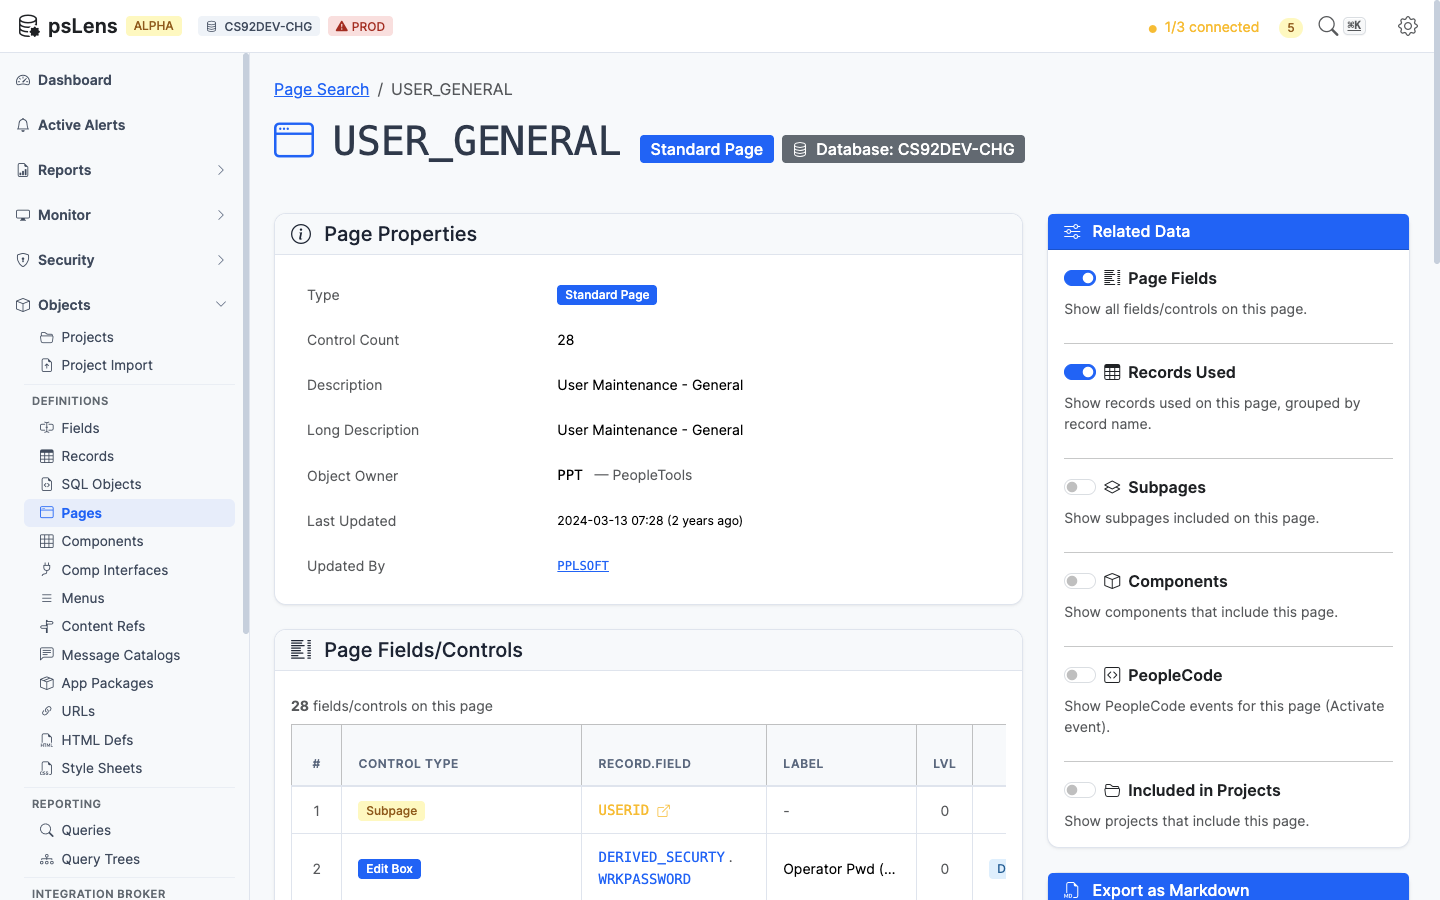
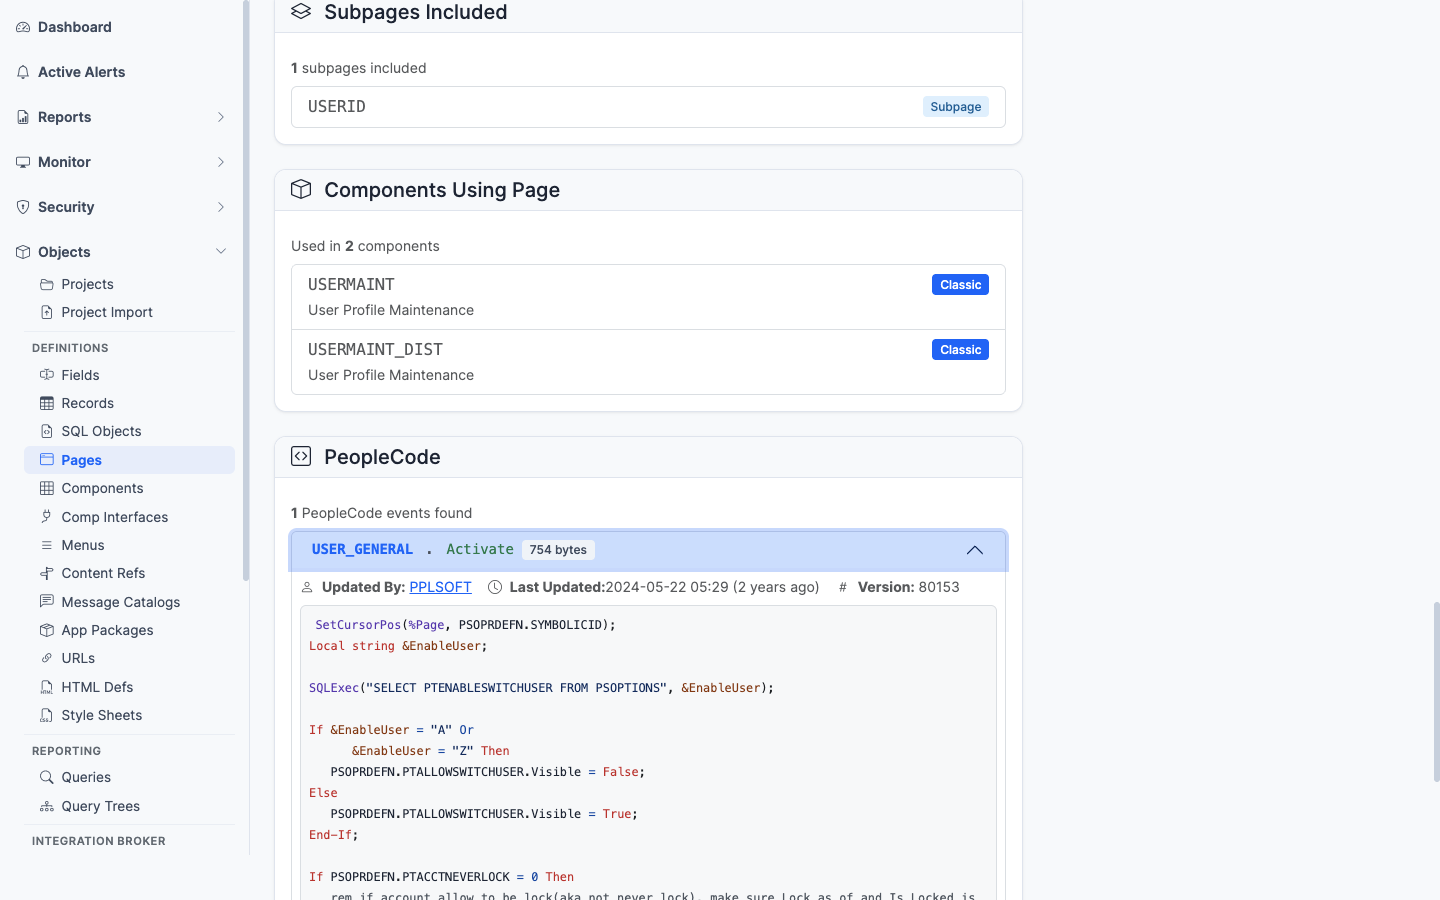
Click into any object and see its relationships immediately:
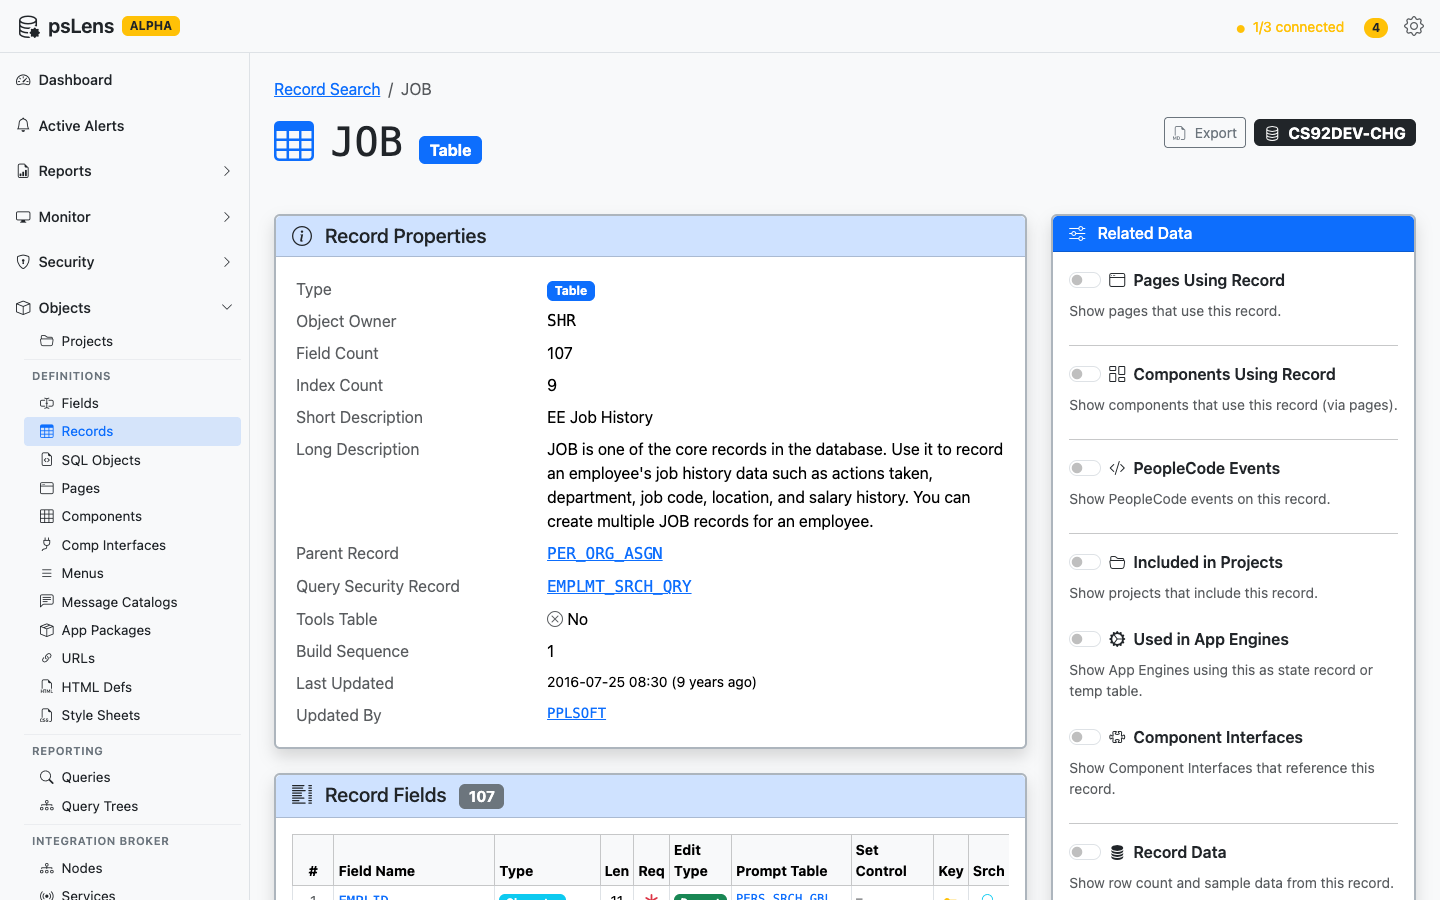
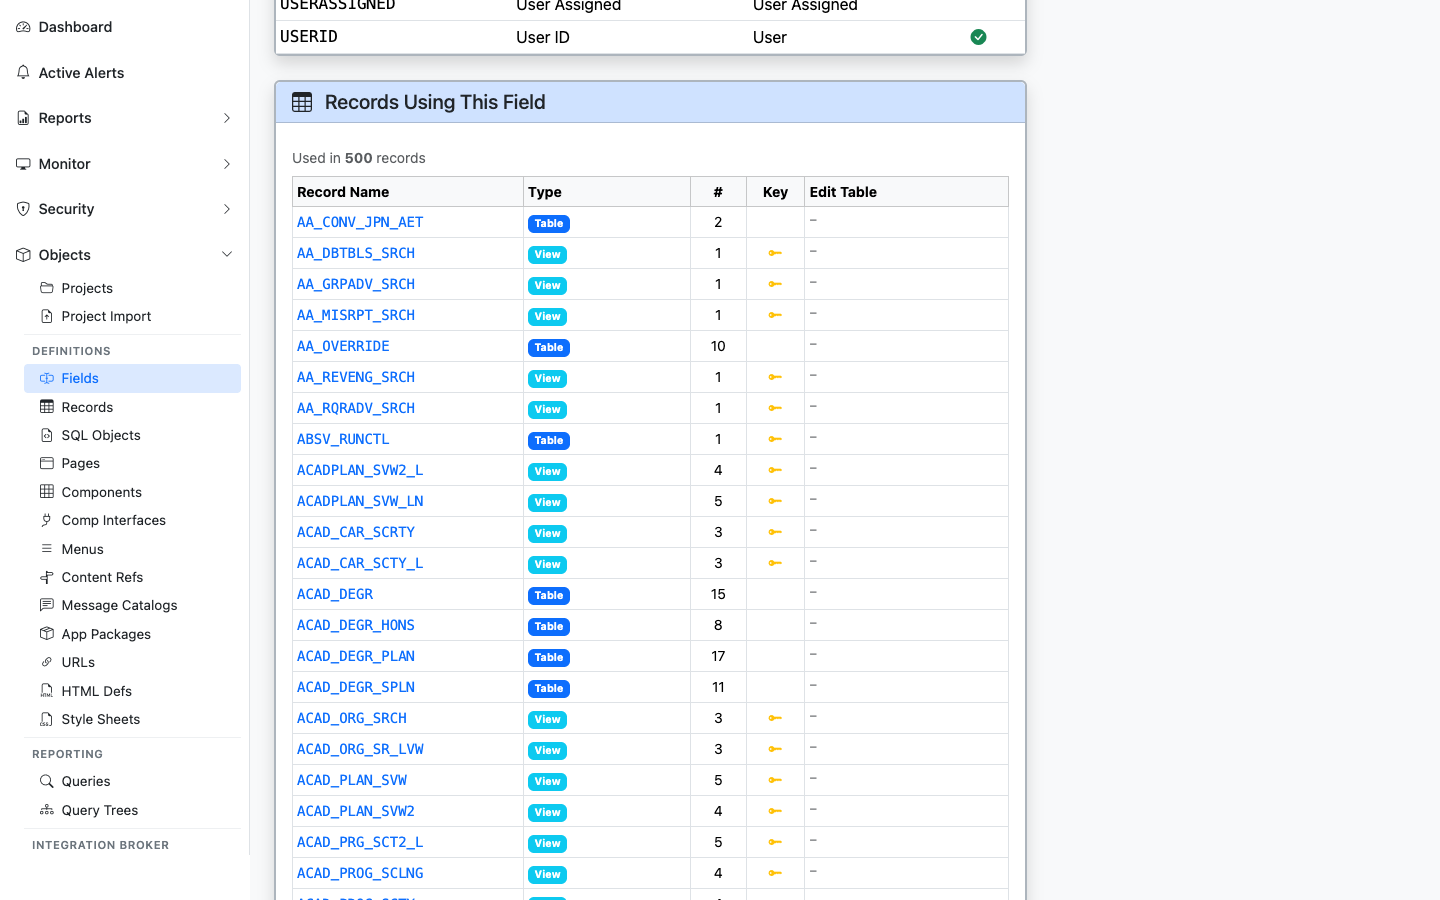
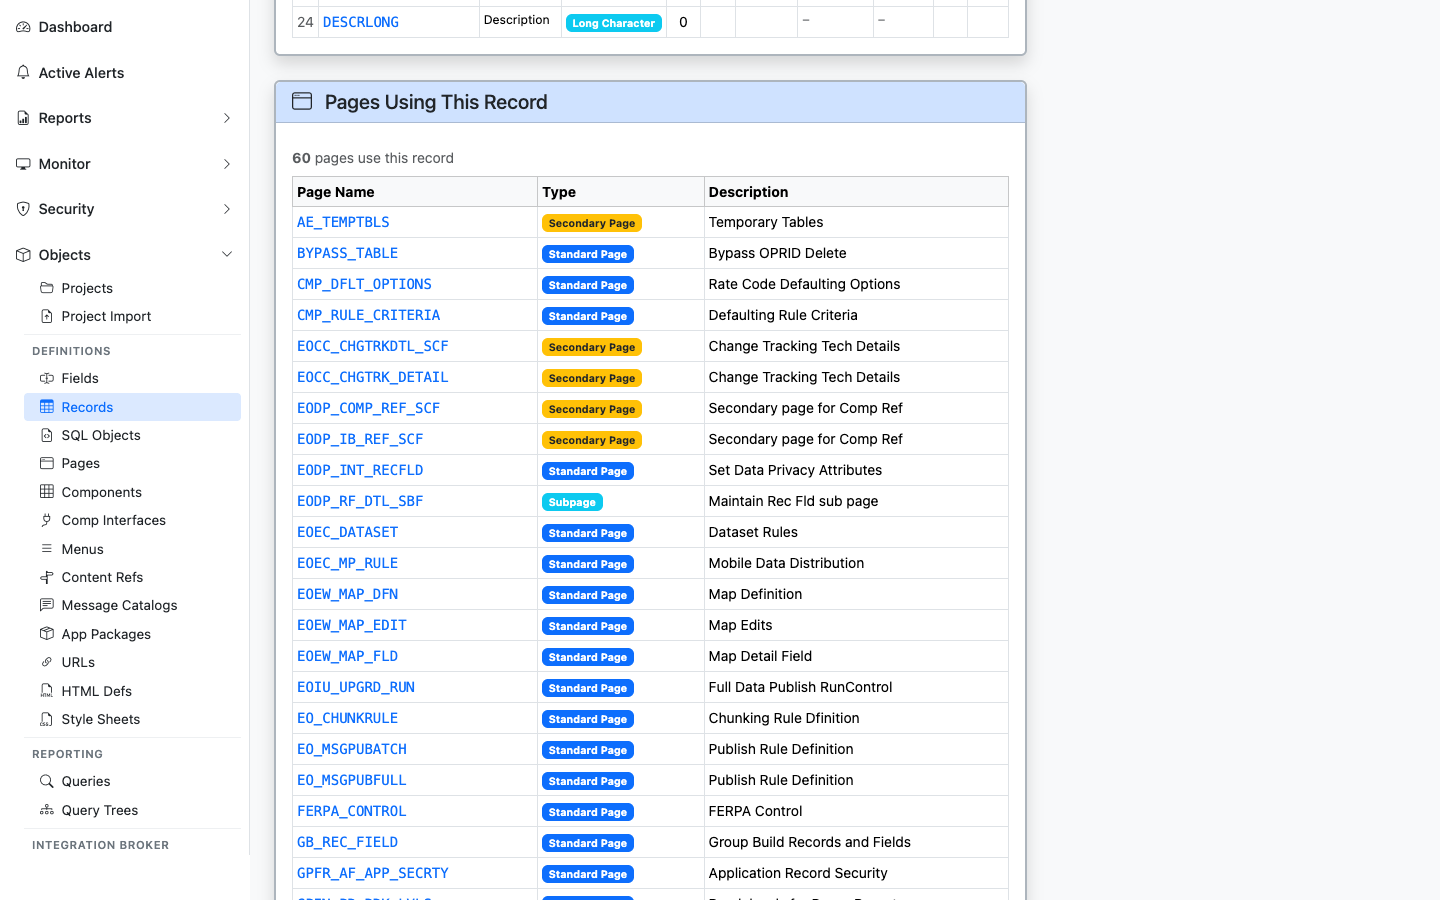
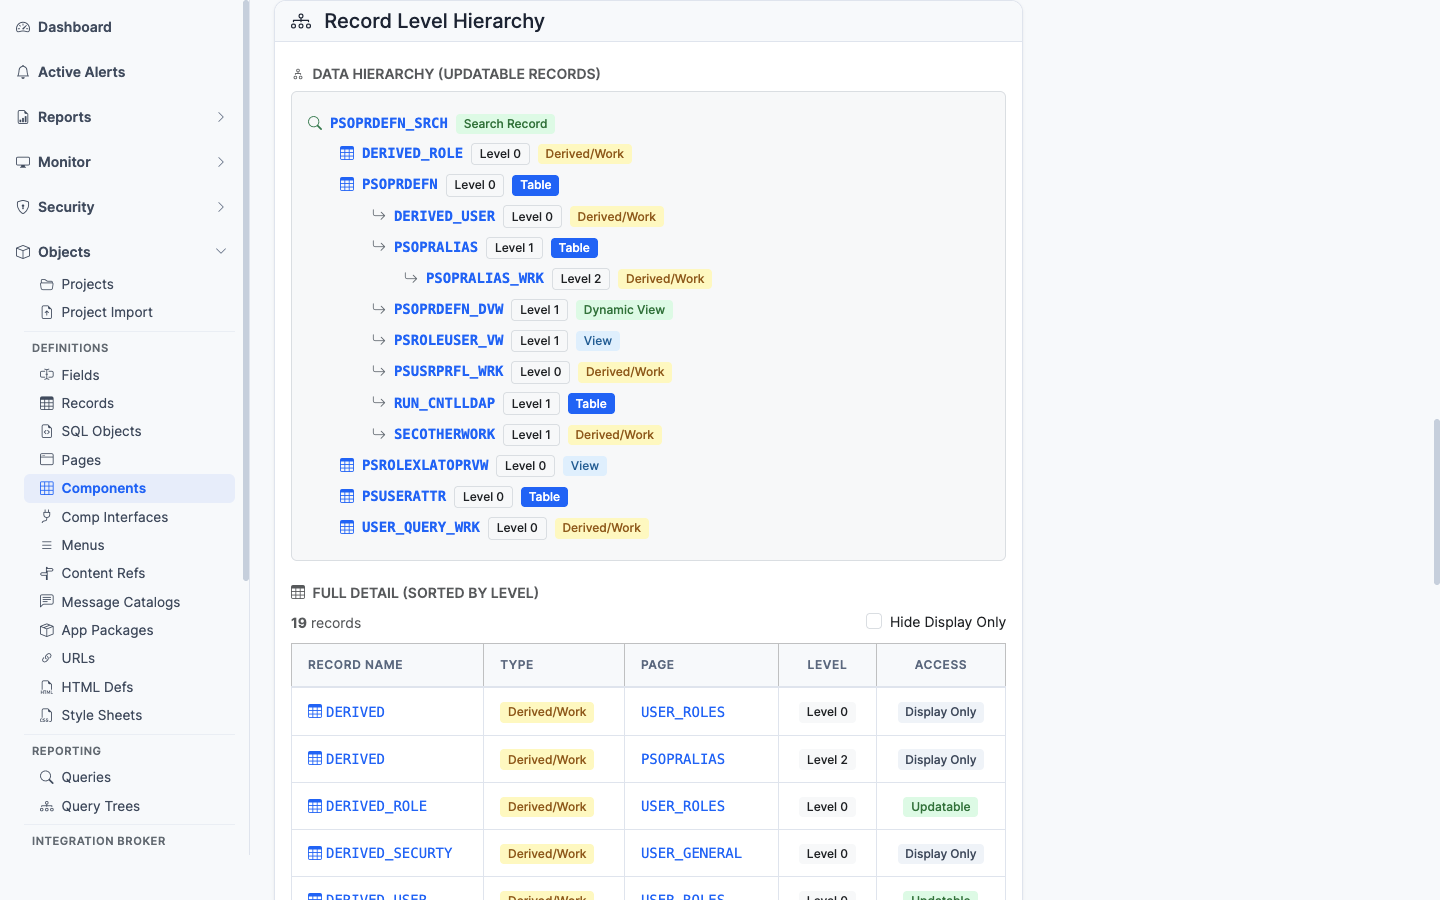
Records: See all fields, key structure, related pages and components
Fields: See every record that uses the field, plus translate values
Pages: See the component and menu path
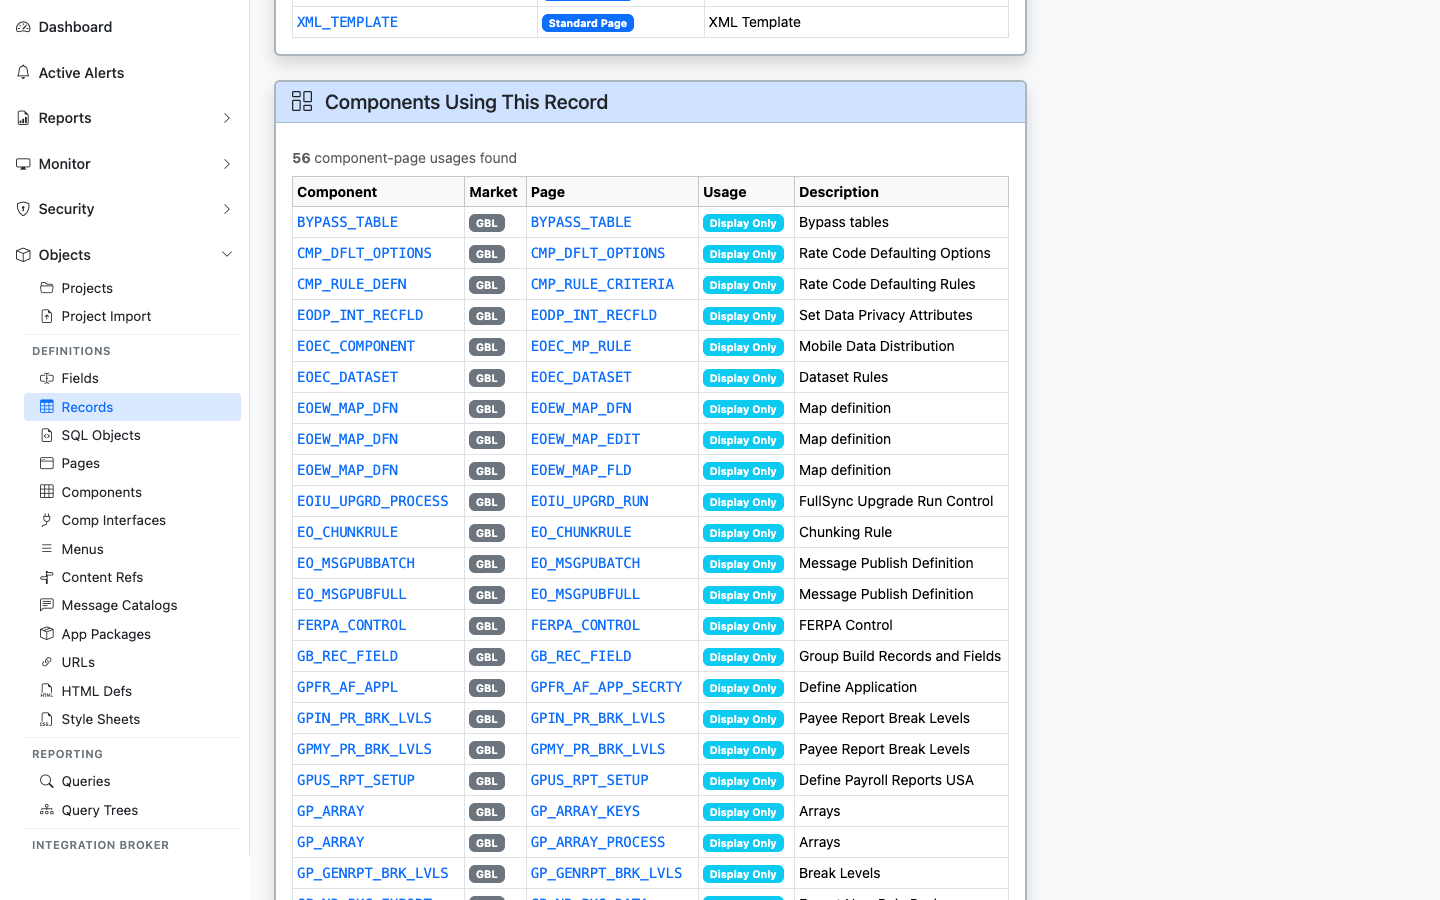
Components: See pages, permission lists, and menu navigation
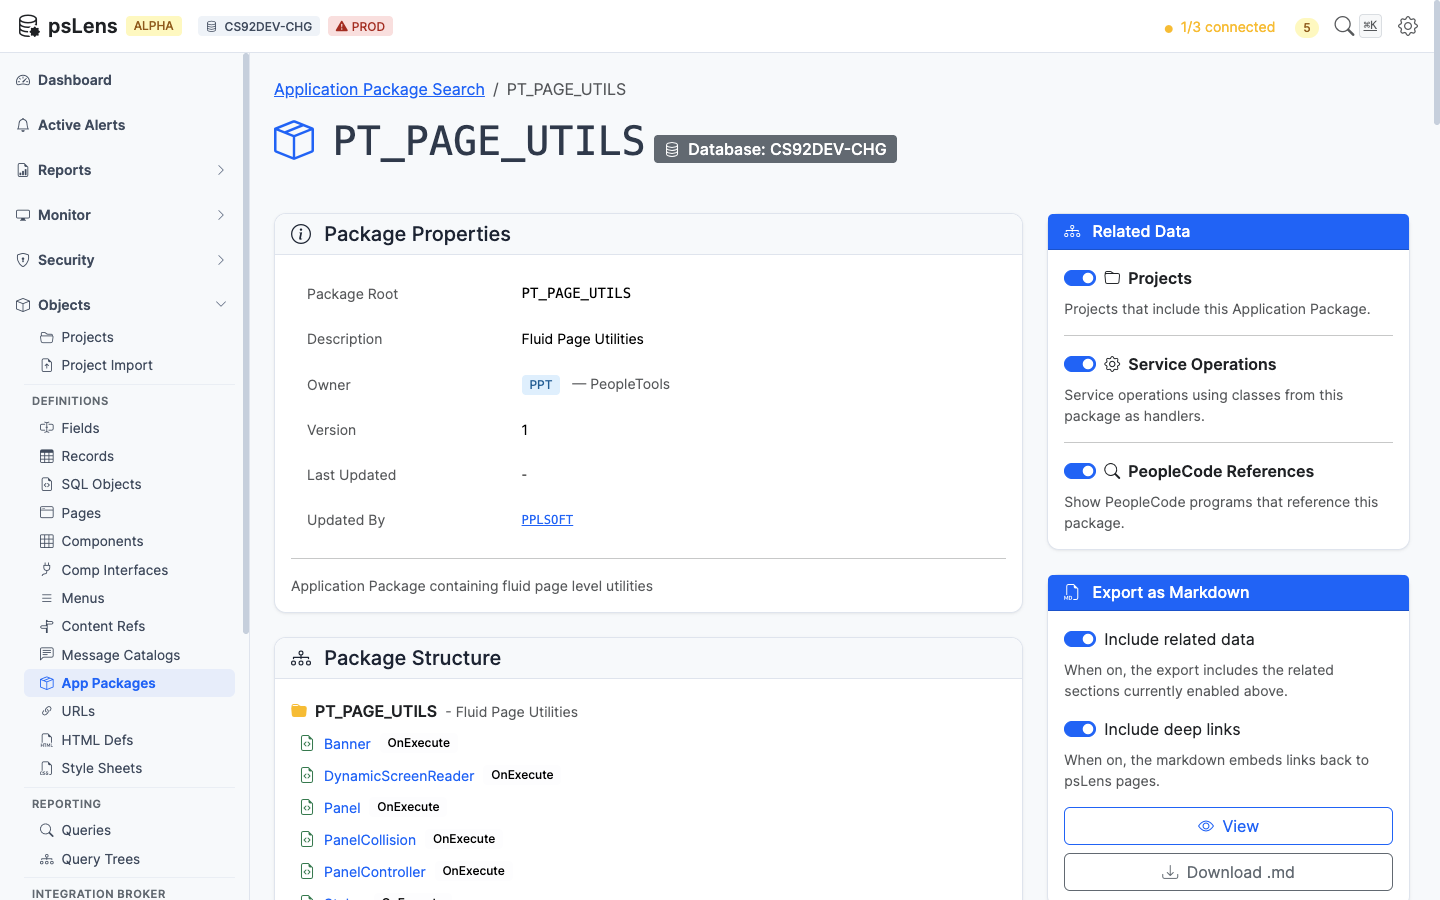
Application Packages: Browse the full class hierarchy
Deep Links for Team Communication
Every object in psLens has a permanent URL. Instead of telling a colleague “look at the DERIVED_HR record in App Designer,” send them a link. They click it and see the full definition, no App Designer needed.
Useful for:
Jira tickets and code review comments
Slack conversations about technical issues
Wiki documentation and runbooks
Onboarding materials for new developers
Markdown Export
Export any object definition to structured Markdown. Use it to:
Document your customizations
Create change request descriptions
Feed into AI tools (ChatGPT, Claude) for code analysis and generation
Build team knowledge bases
Keep App Designer Access Tight
App Designer is a full development environment. It connects directly to your PeopleSoft database (two-tier), can modify any object, view all PeopleCode, and run arbitrary SQL. That level of access is appropriate for developers who are actively building, not for lookups.
Because App Designer is a Windows-only desktop client that requires specialized network access, most organizations provision dedicated VMs or terminal servers just to run it. That infrastructure needs to be maintained, patched, and secured.
When developers use psLens for day-to-day research, they spend less time in App Designer. That means fewer VM sessions, less infrastructure to maintain, and App Designer access stays scoped to the people who actually need it.
How PeopleSoft security administrators use psLens to audit access, run security reports, and manage permission lists, roles, and users.
The Challenge
PeopleSoft security is complex. Users are assigned to roles. Roles contain permission lists. Permission lists grant access to components, pages, and web services. Understanding who has access to what means tracing through multiple layers, often across dozens of screens or with custom SQL queries.
An overly-broad permission list can expose sensitive data; a forgotten role assignment can give someone access they should not have. Manual review misses both because there is too much to check.
Walkthrough: How security administrators audit access and trace permissions in psLens
How psLens Changes This
Automated Security Reports
psLens includes built-in security audit reports that analyze your configuration and surface findings automatically:
Full Access Report: Identifies permission lists with unusually broad access across components
Nodes Without Passwords: Flags integration nodes configured without authentication
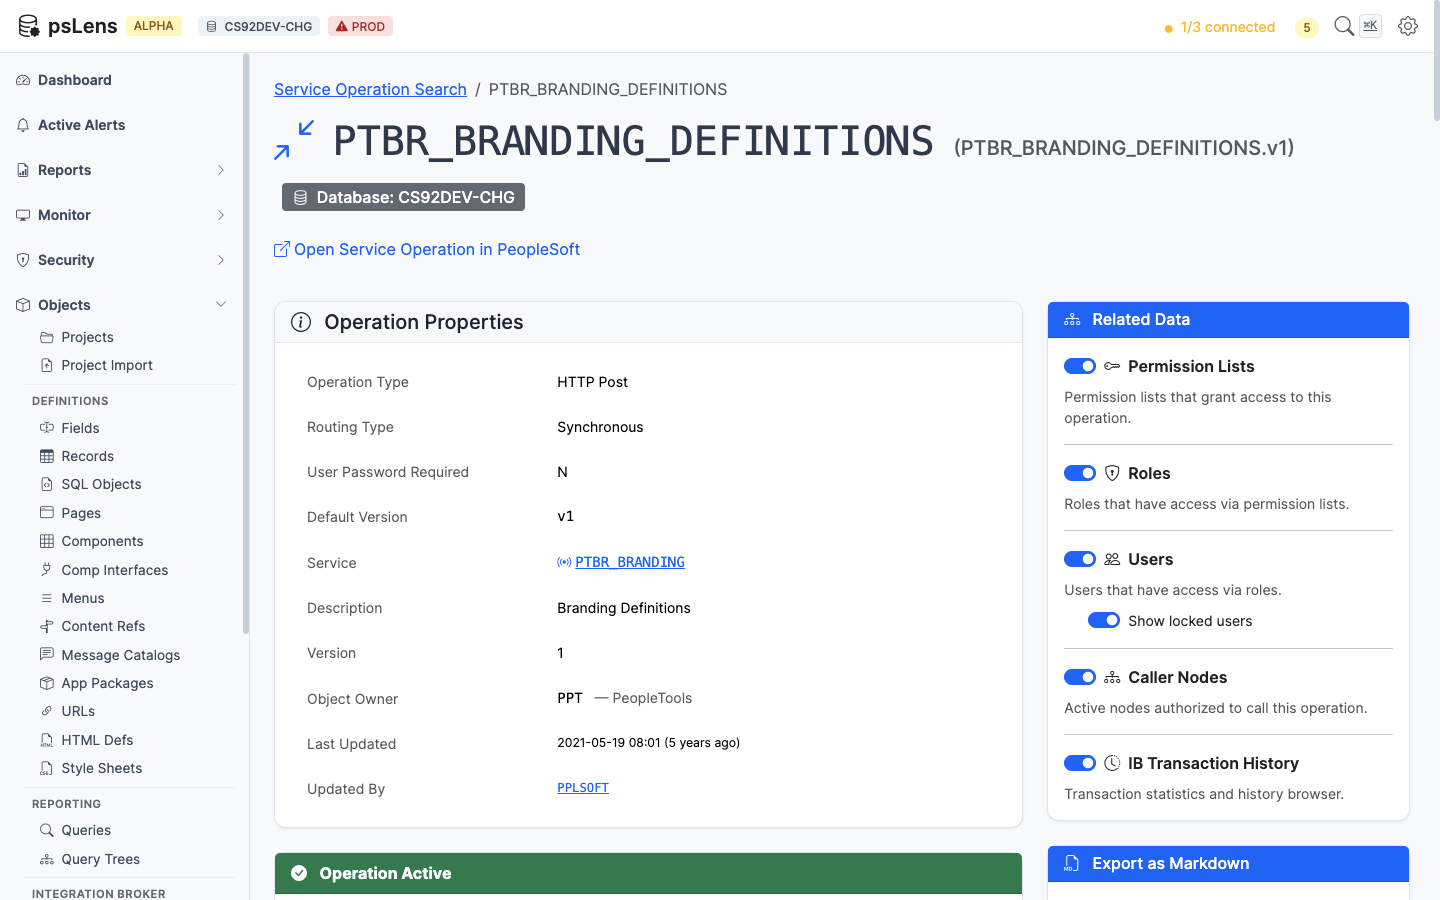
Web Service Access Report: Shows which permission lists can invoke web services and REST endpoints
Reports run in the background and store results for review, download, and sharing. Run them on demand or schedule them as part of your regular audit cycle.
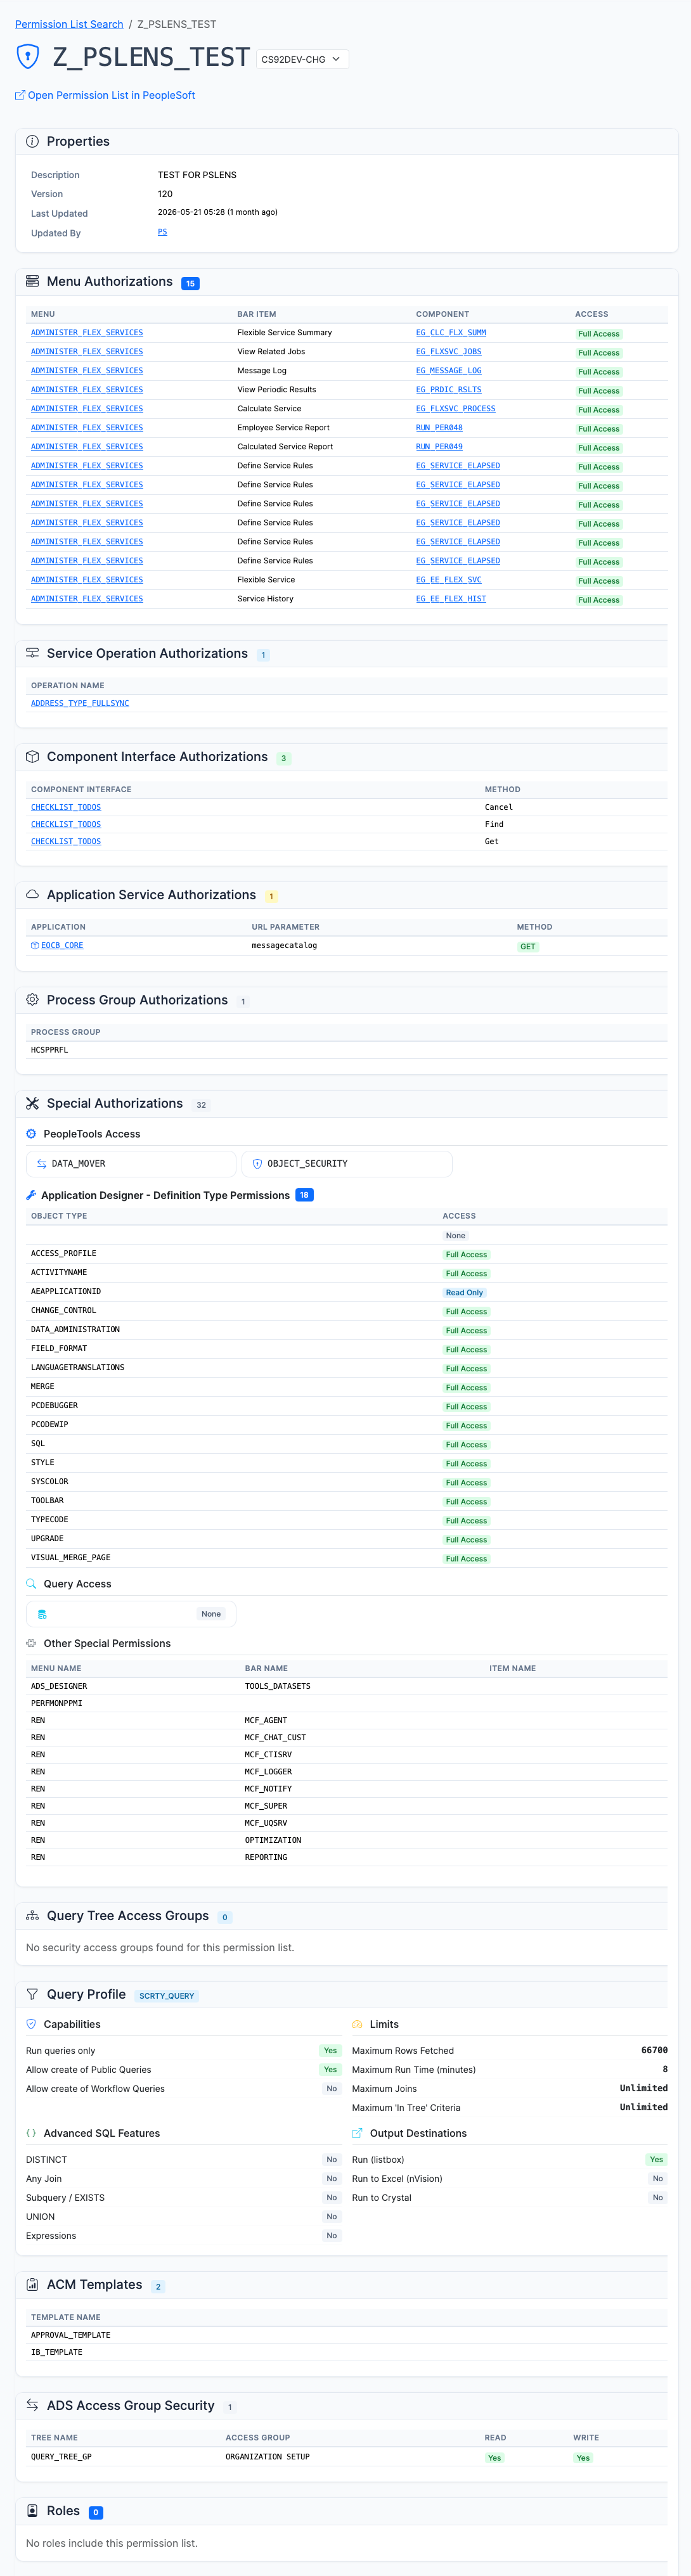
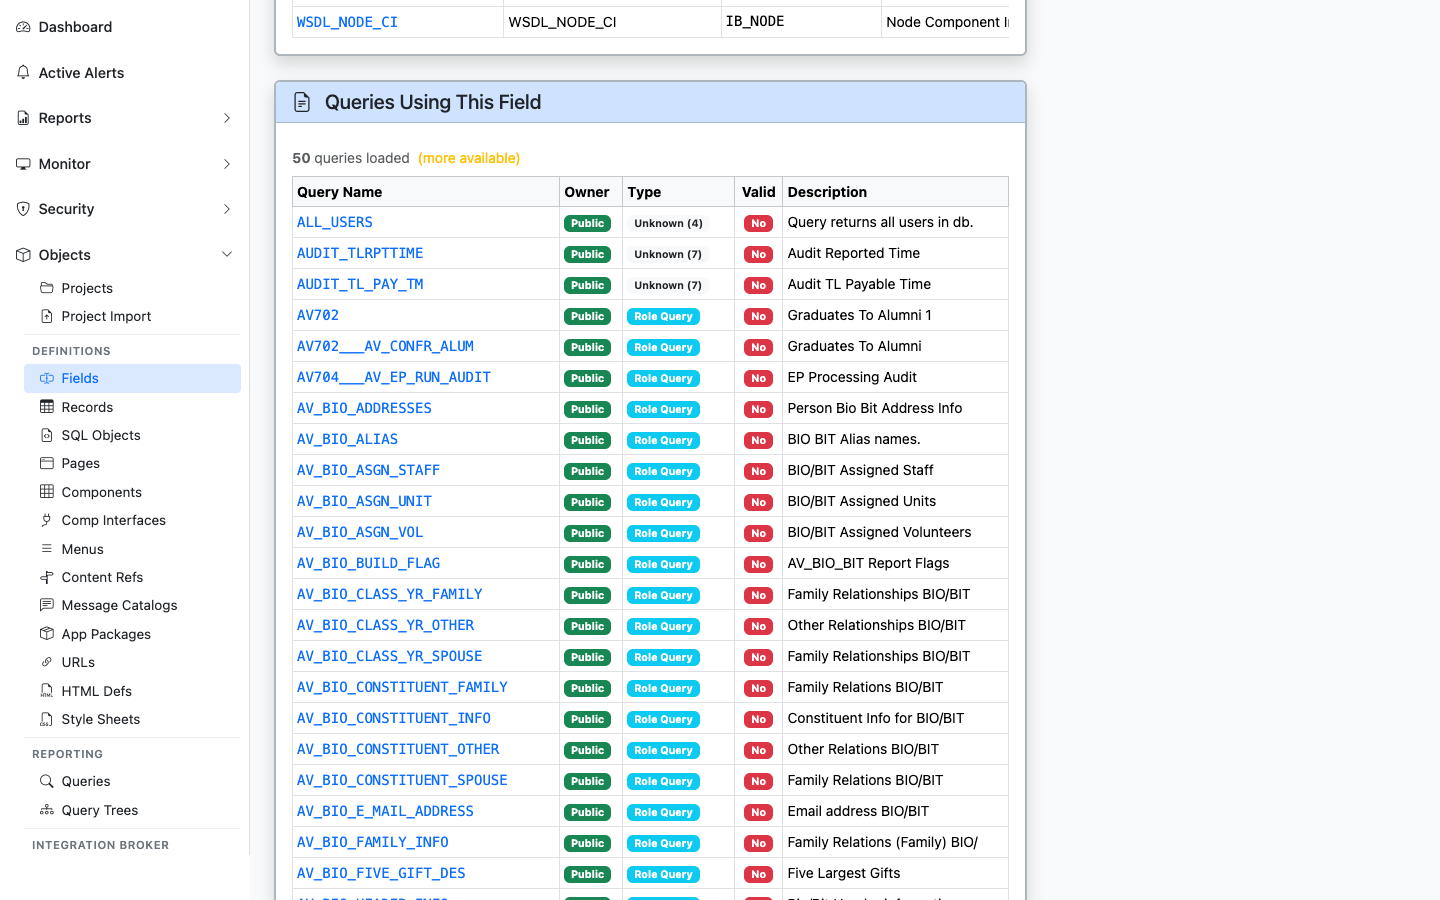
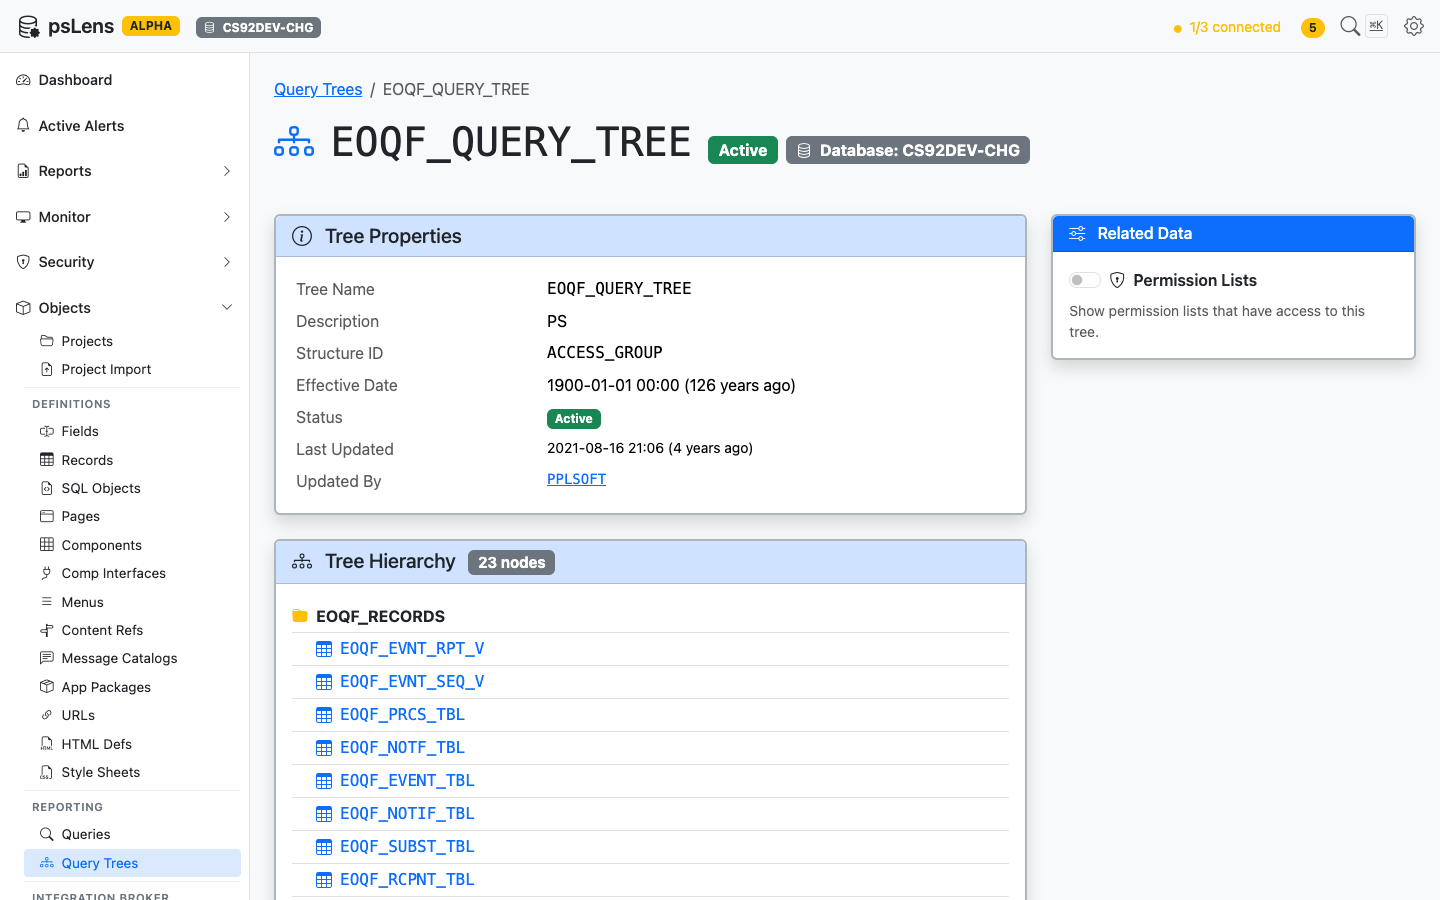
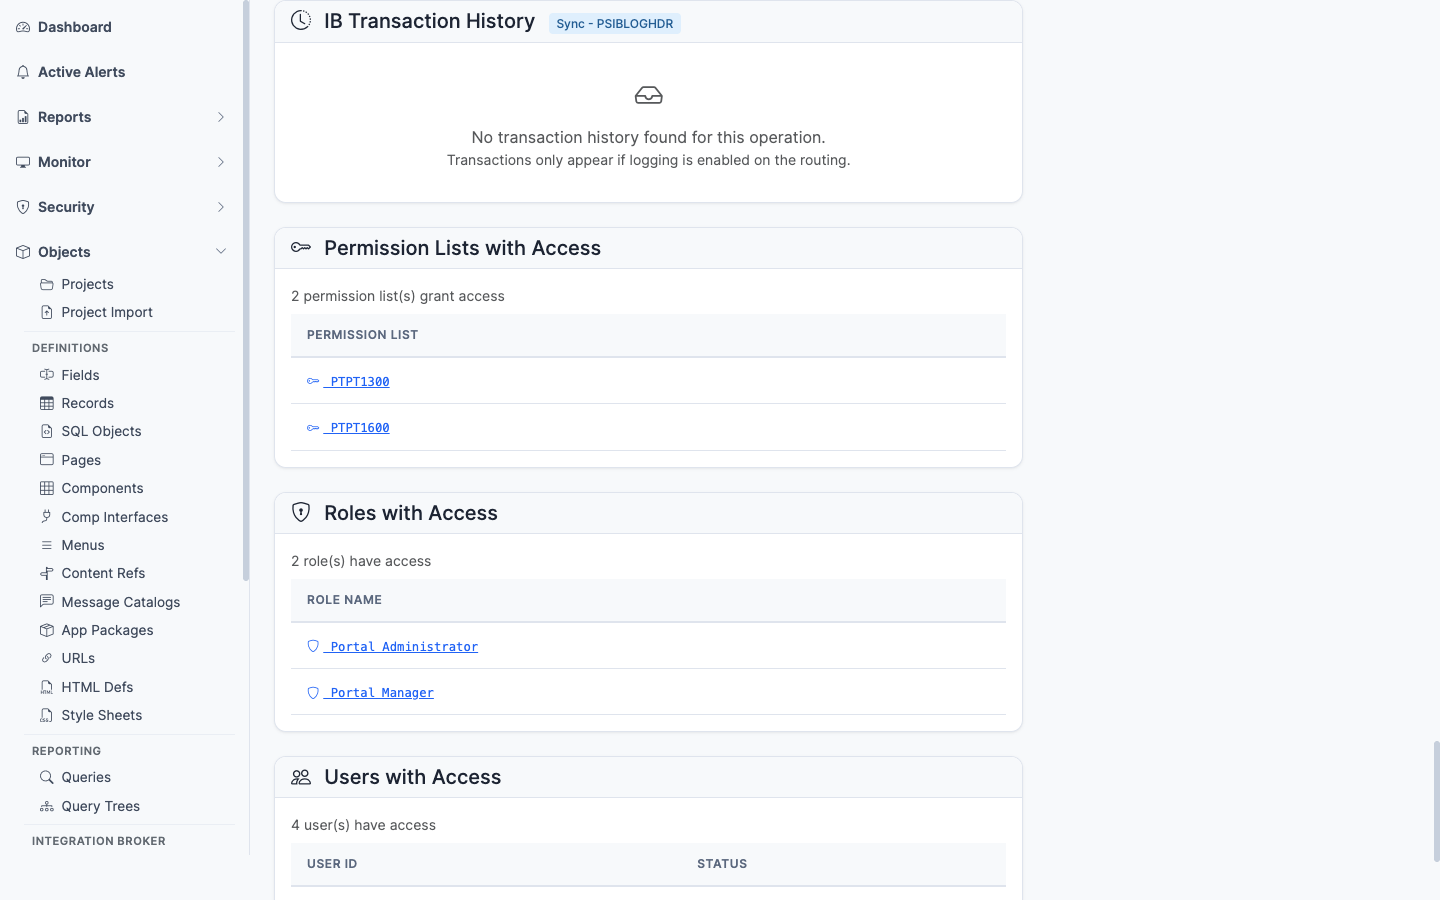
Permission List Deep Dives
Search for any permission list and instantly see:
Component access grants
Page-level permissions within each component
Which roles include this permission list
Which users are ultimately affected
You skip the SQL and the page-by-page click-through.
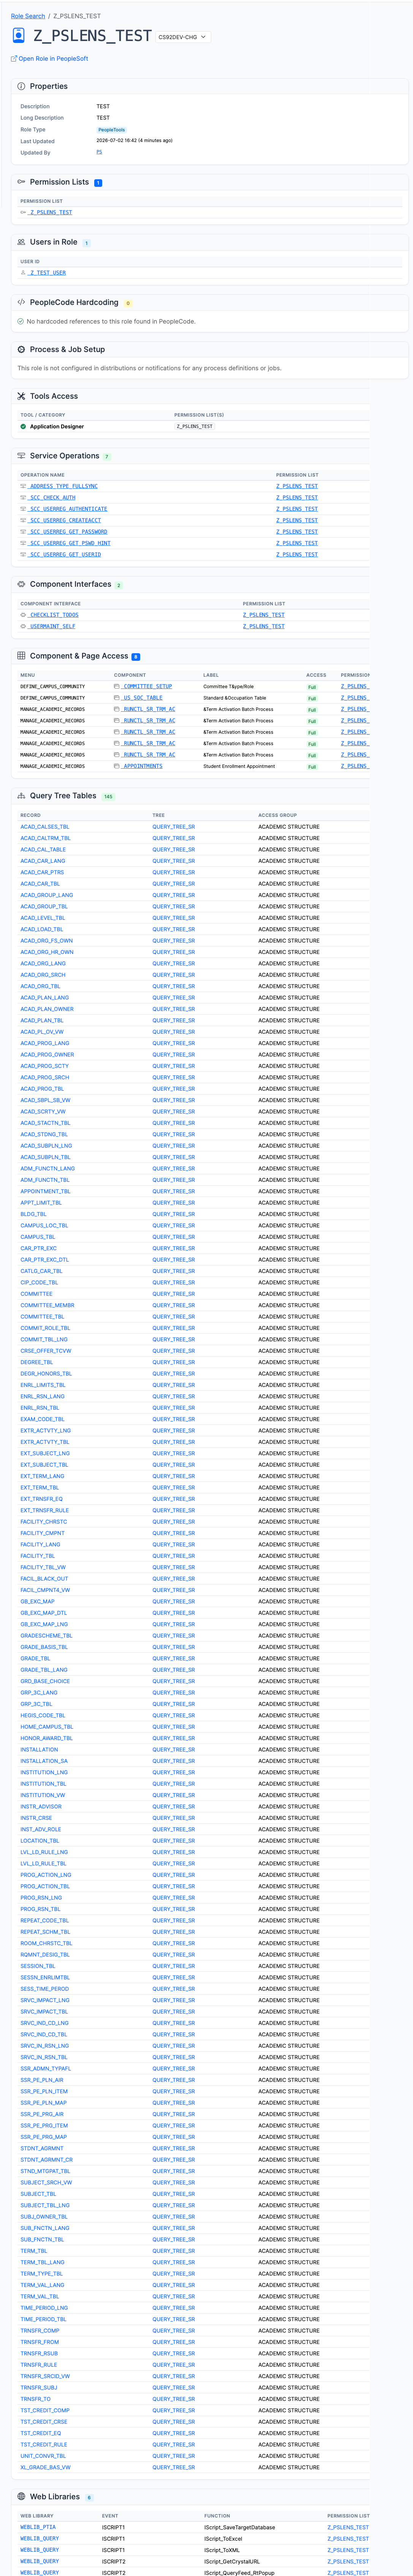
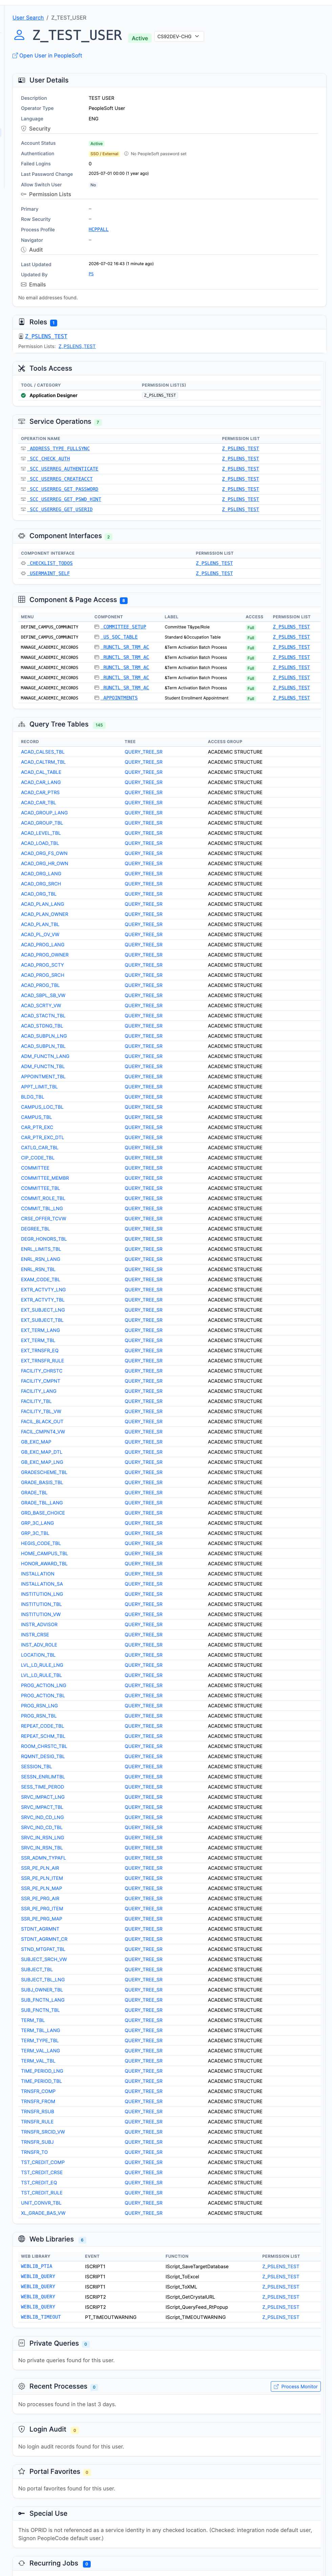
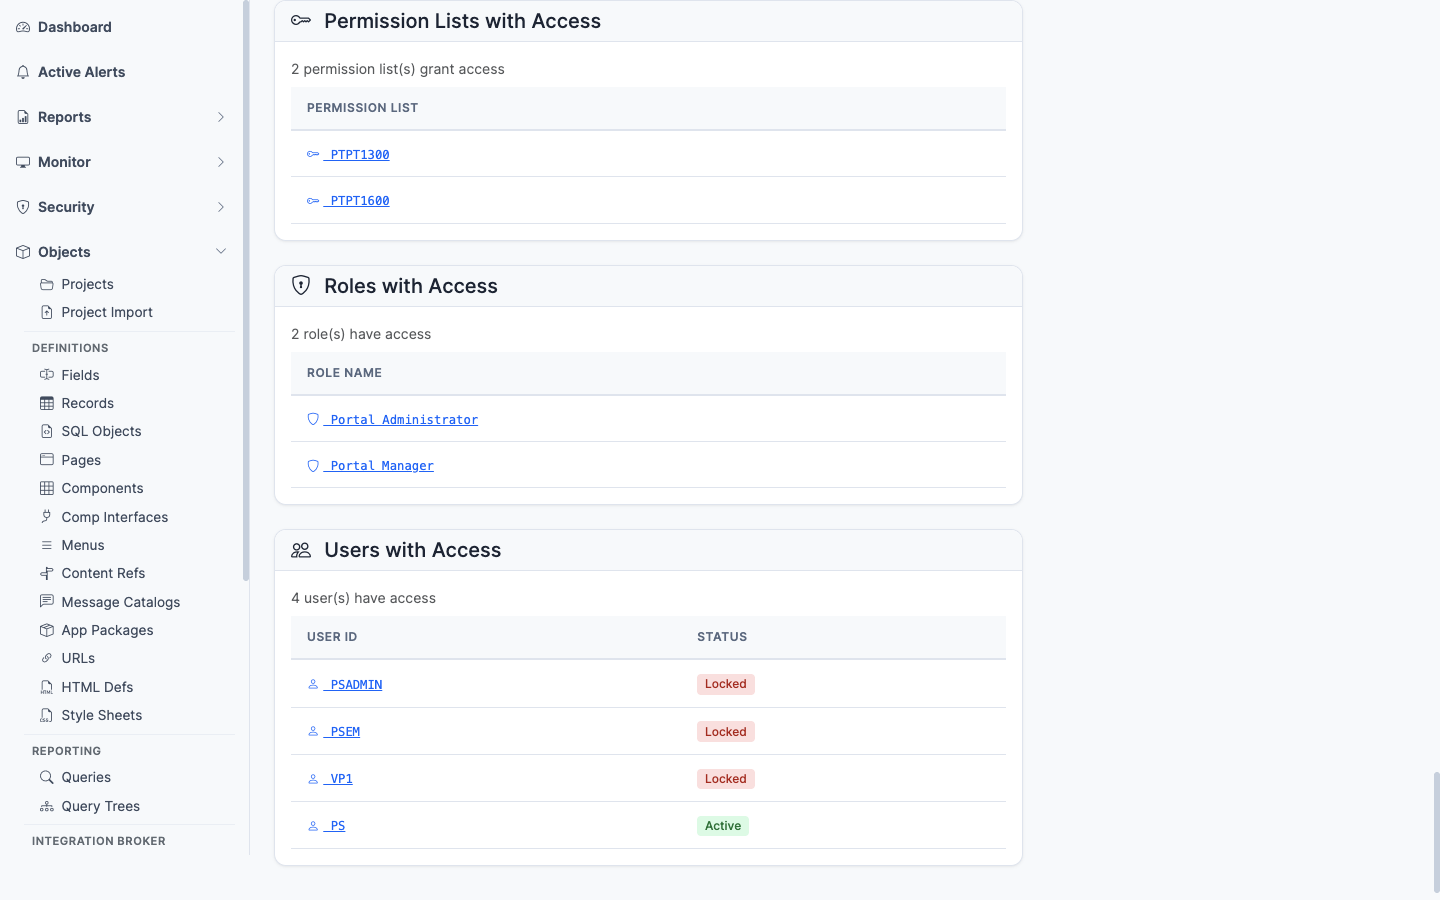
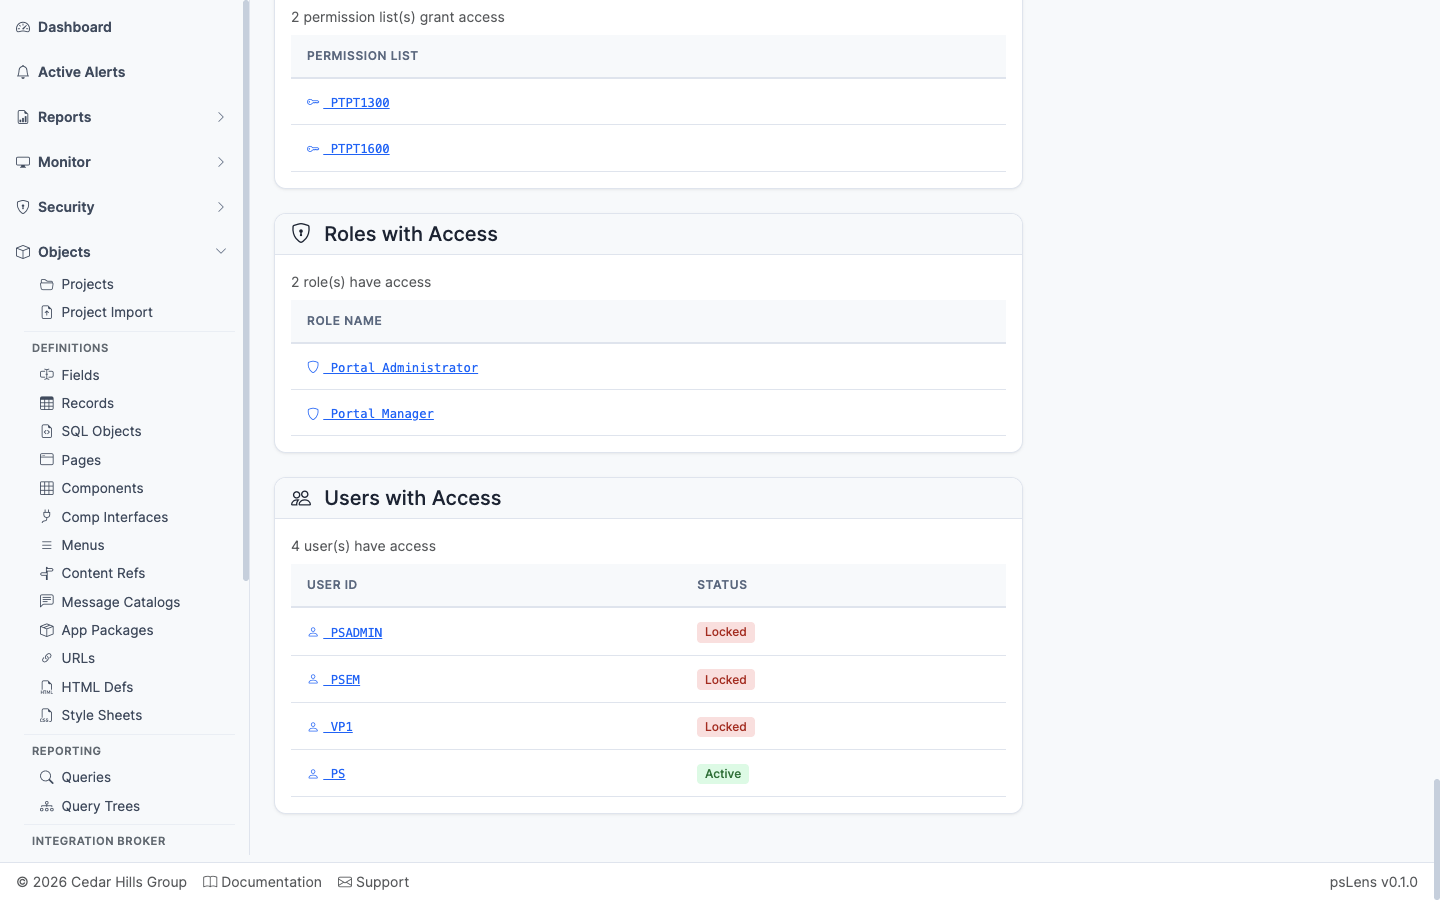
Role and User Tracing
Start from any direction:
From a user: See all assigned roles and the permission lists they carry
From a role: See which users have it and what permission lists it contains
From a permission list: See which roles use it and which users are affected
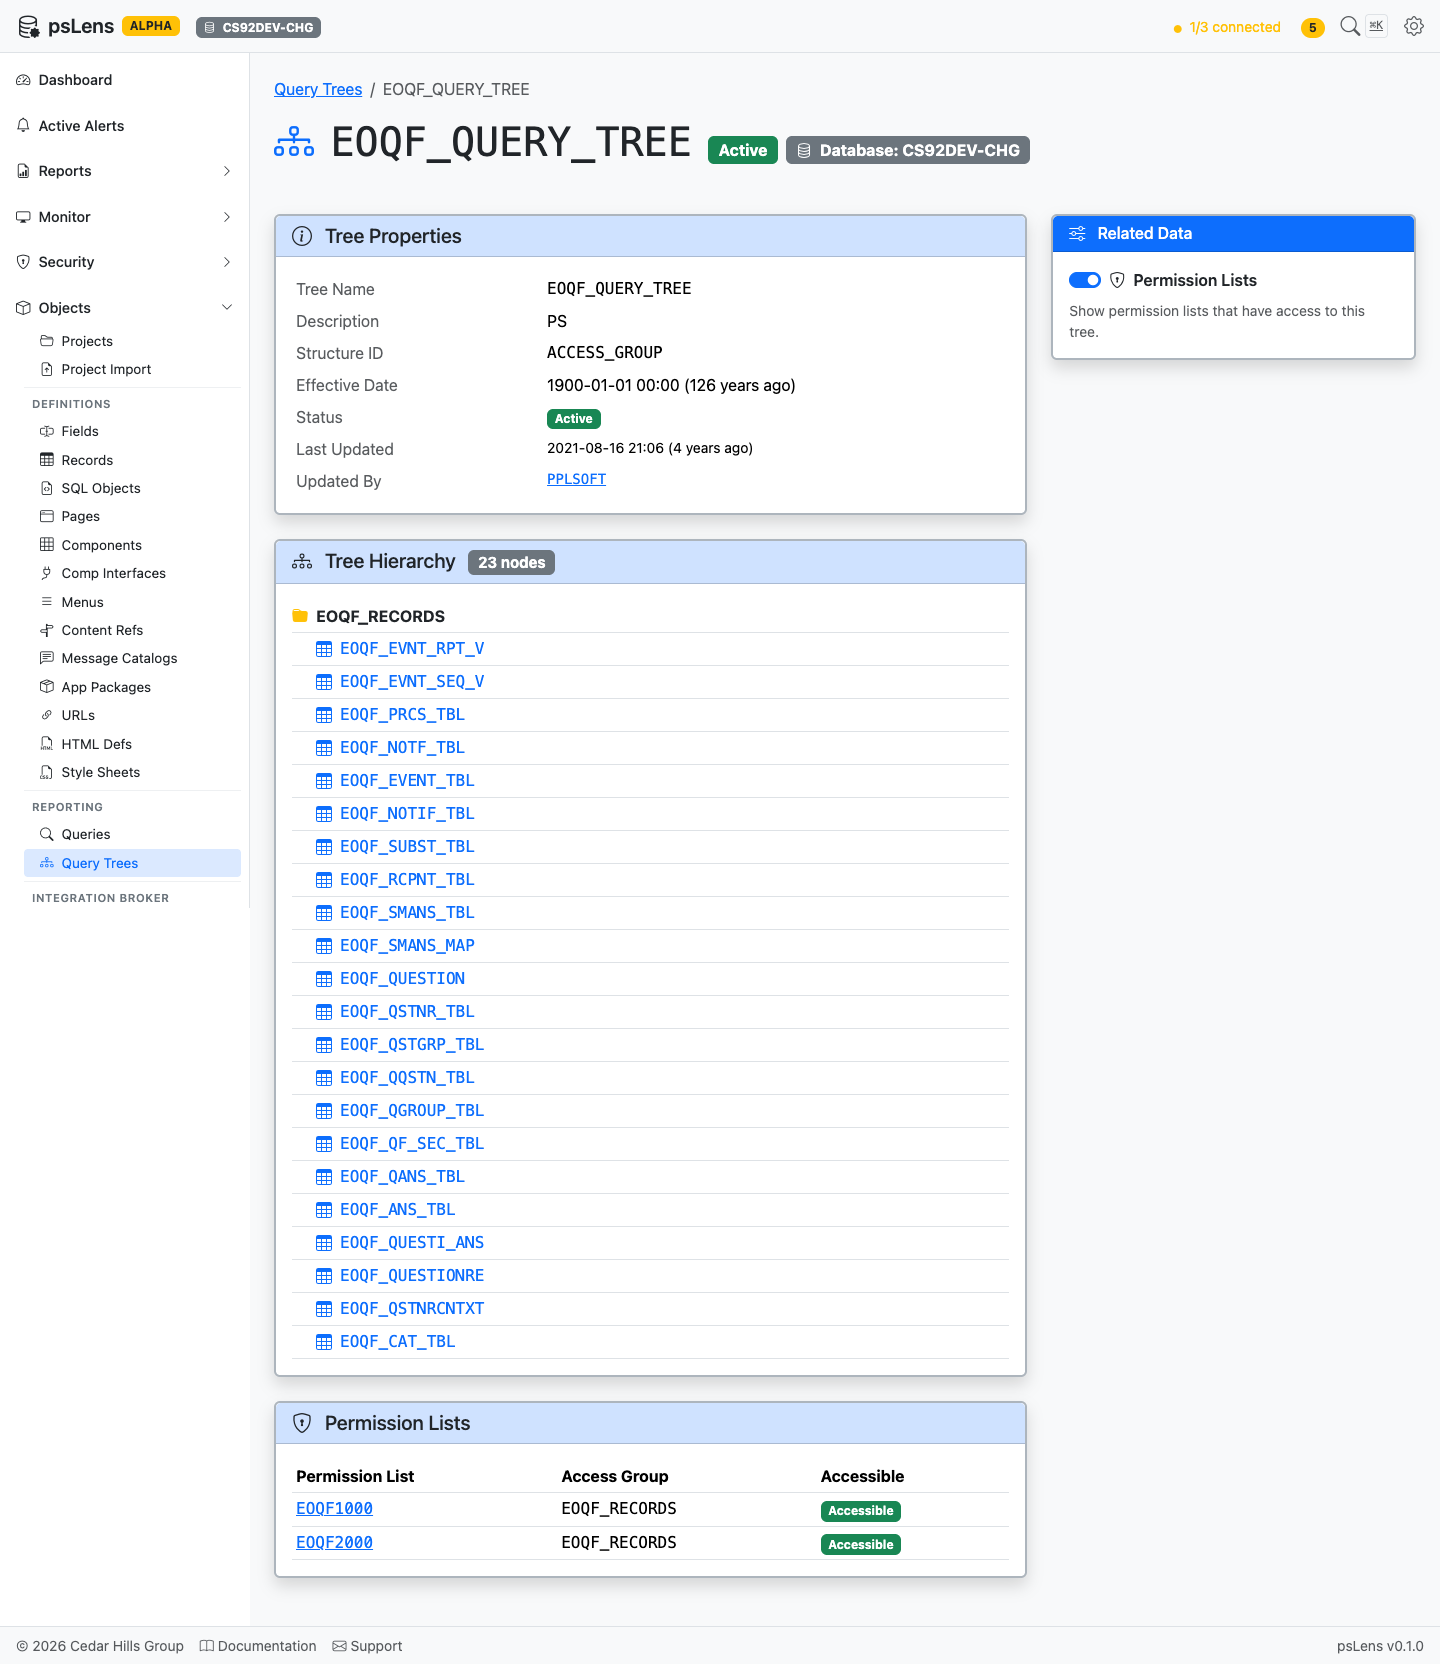
Security Chain Visualization
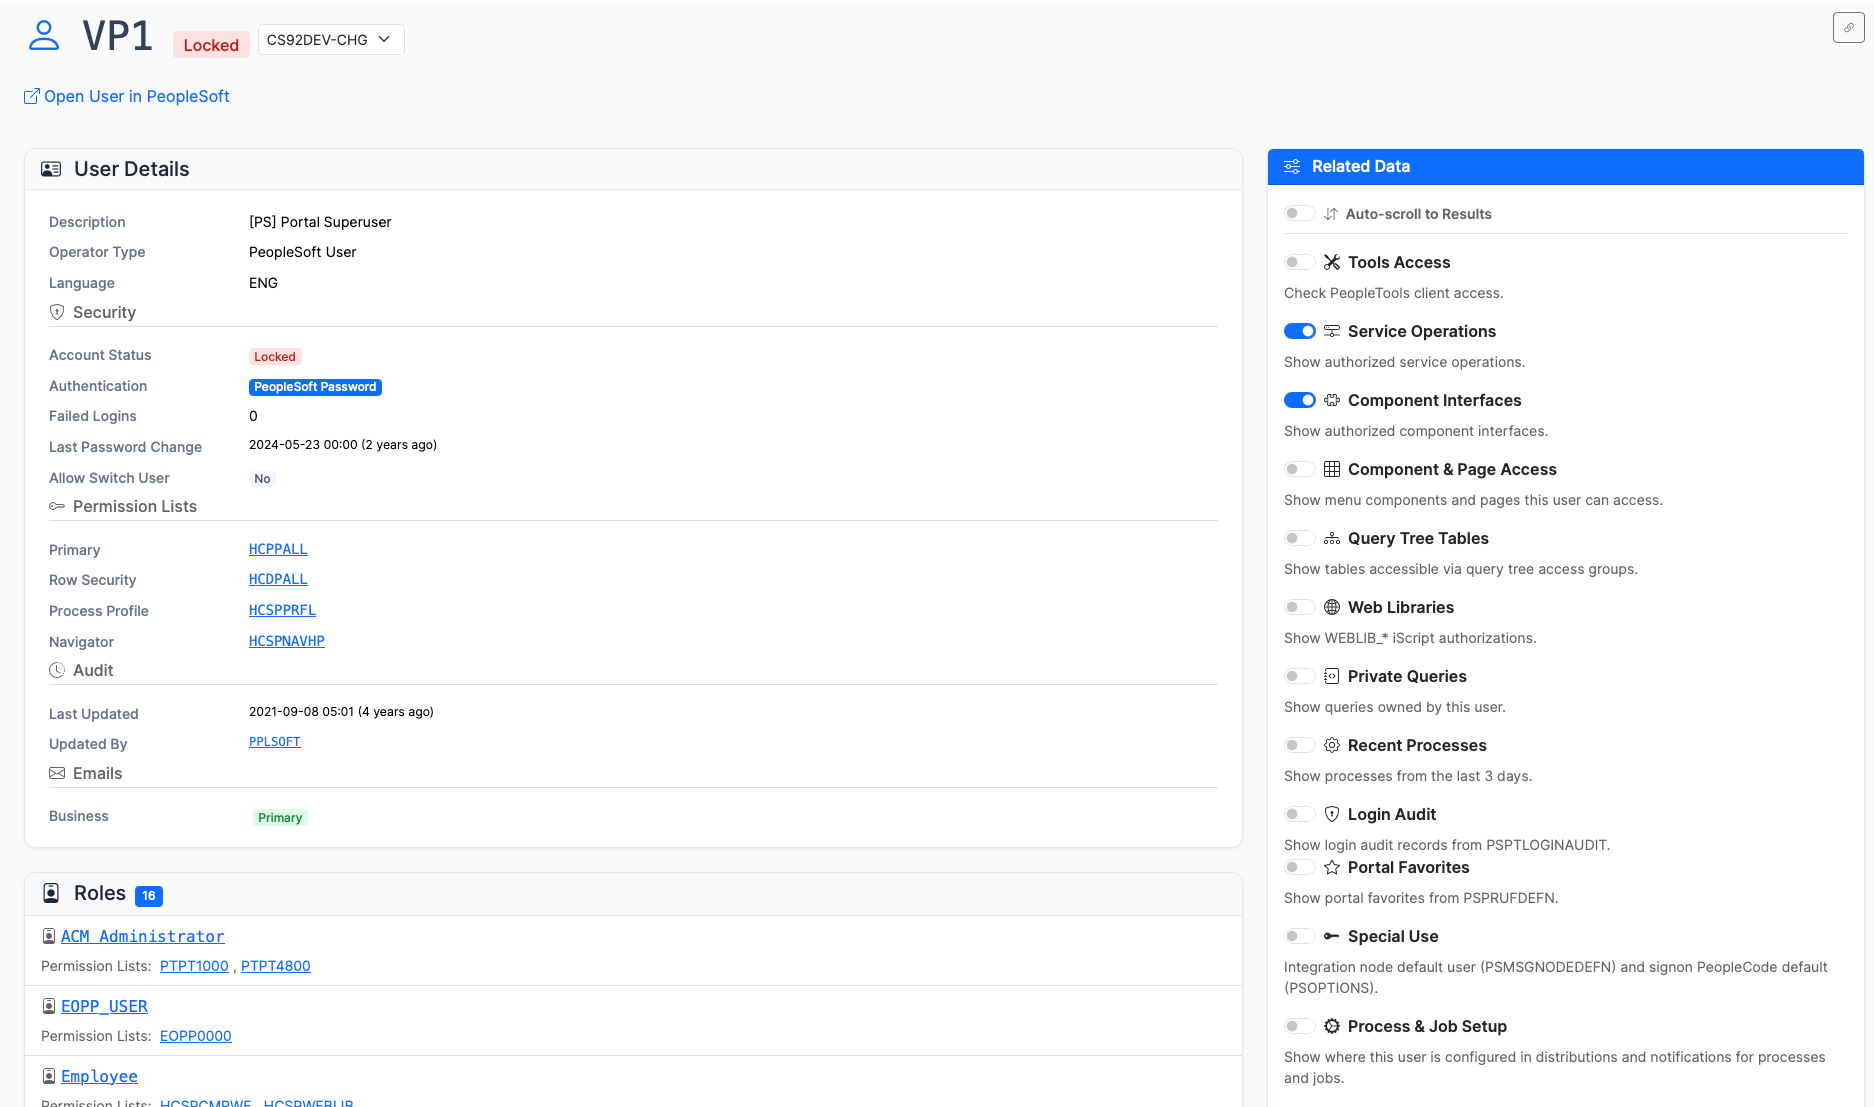
Understanding the full security chain (User > Roles > Permission Lists > Component Access) usually means opening multiple windows and cross-referencing. psLens links everything together — click through the chain from any starting point.
A security review starts from any point in the chain and stays in one linked workflow instead of jumping between tools and SQL
Reduce App Designer Access
One of the simplest ways to improve your security posture is to remove App Designer access from people who only use it for research. Business analysts, functional consultants, auditors, and support staff often have App Designer access because there is no other way to look up PeopleSoft metadata. psLens gives them that capability without the ability to modify objects, run SQL, or connect directly to the database. See Reducing App Designer Access for details.
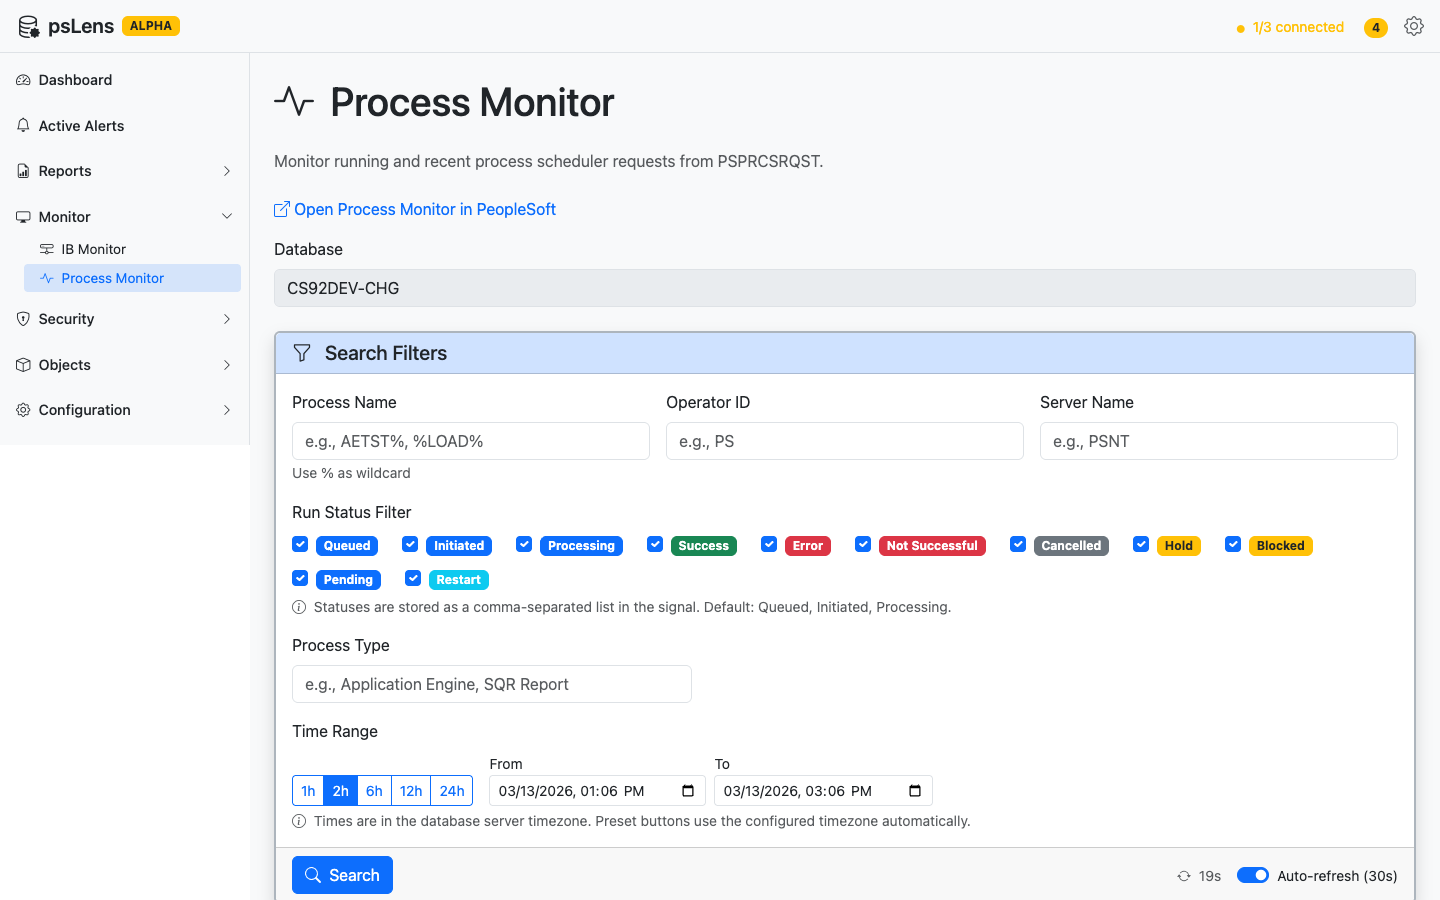
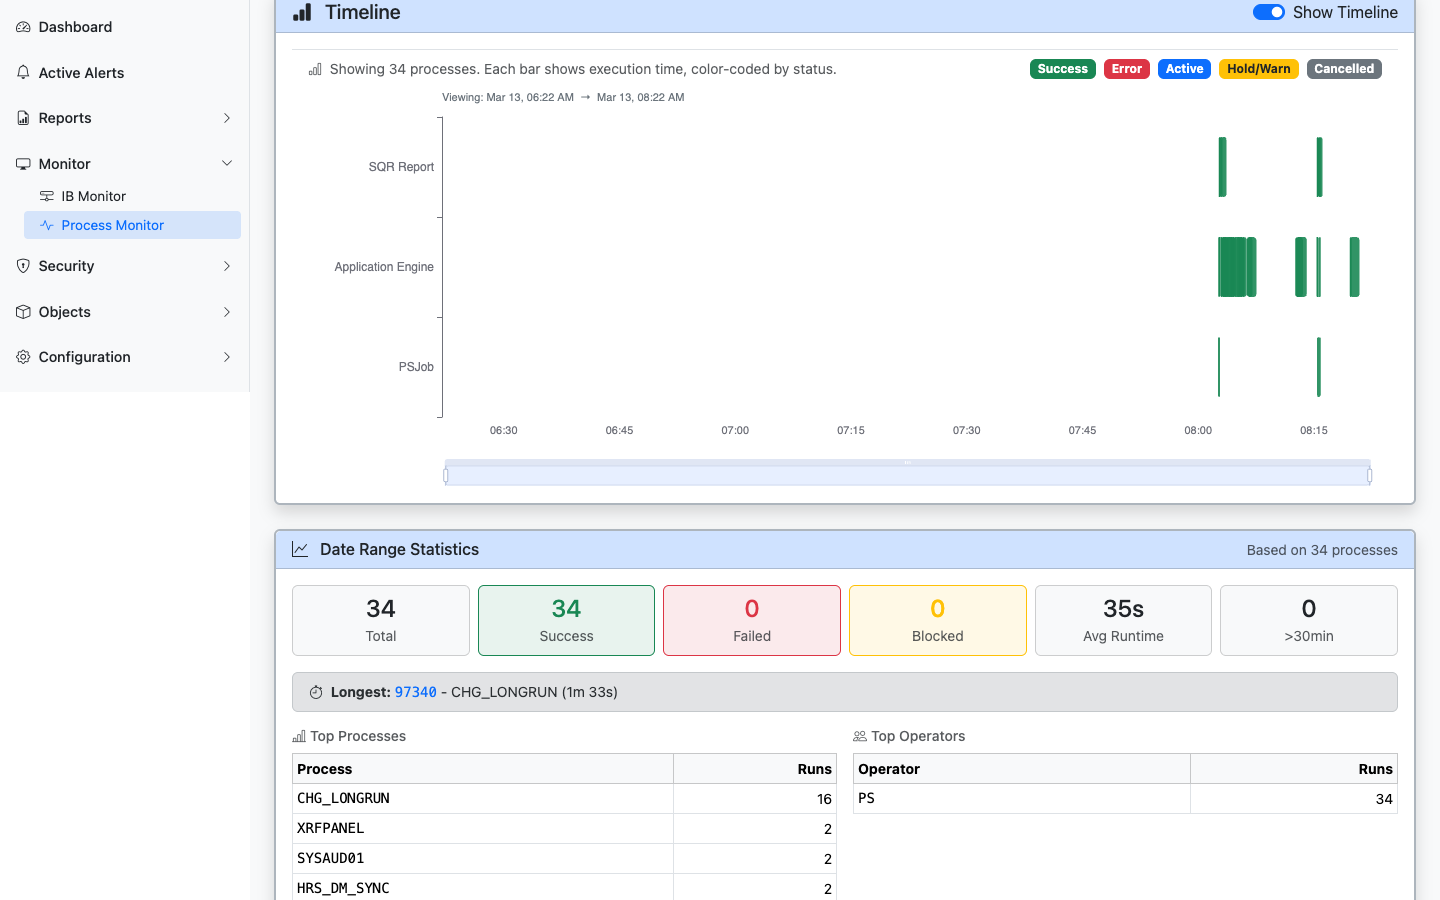
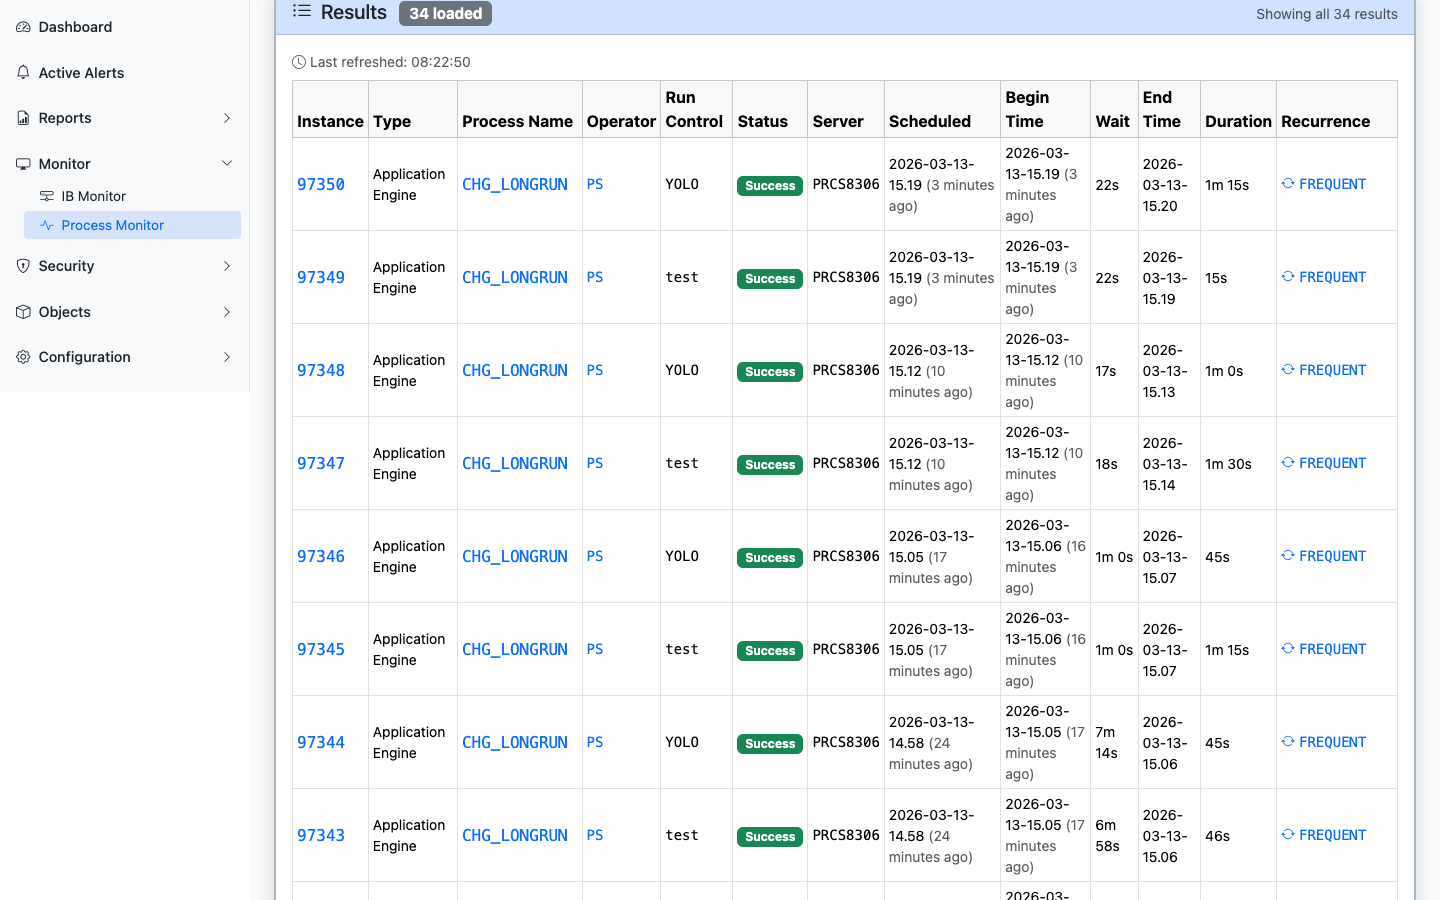
How PeopleSoft system administrators use psLens to monitor processes, Integration Broker, and get real-time alerts on problems.
The Problem
You find out about problems when users call. A batch process failed overnight. Integration Broker messages have been stuck for hours. A long-running process is blocking the queue. By the time someone notices, the impact has already spread.
Checking manually means logging into PeopleSoft, navigating to Process Monitor or IB Monitor, setting filters, and scanning for issues. Multiply that by the number of environments you manage.
How psLens Changes This
Real-Time Alerts
psLens runs background checks every few minutes and surfaces problems on the dashboard as they happen.
9 built-in alert types:
Long-Running Processes: Jobs running longer than expected thresholds
How business analysts use psLens to understand PeopleSoft configuration, research components, and make informed decisions without developer tools.
The Gap
You need to understand how something works in PeopleSoft. Maybe you are writing requirements for a customization. Maybe you are trying to understand why a process behaves a certain way. Maybe you need to know what data a page collects and where it goes.
But the tools for answering these questions — App Designer, SQL Developer, PeopleSoft’s technical pages — are built for developers. They require licenses, training, and technical knowledge that is outside your role. So you ask a developer. They look it up and get back to you later. Or you wait.
Walkthrough: Using psLens to speed up daily lookups
How psLens Changes This
Self-Service Research
psLens gives you a web browser interface to explore PeopleSoft configuration without needing developer tools or database access. Search for any object by name and see its definition, structure, and relationships.
You don’t need an App Designer license, SQL skills, or a developer’s time.
This also means you do not need App Designer access just to research metadata. App Designer is a full development tool: it can modify objects, run SQL, and connect directly to the database. Granting it for research gives people far more access than they need. psLens provides the research capabilities without that risk. See Reducing App Designer Access for the full picture.
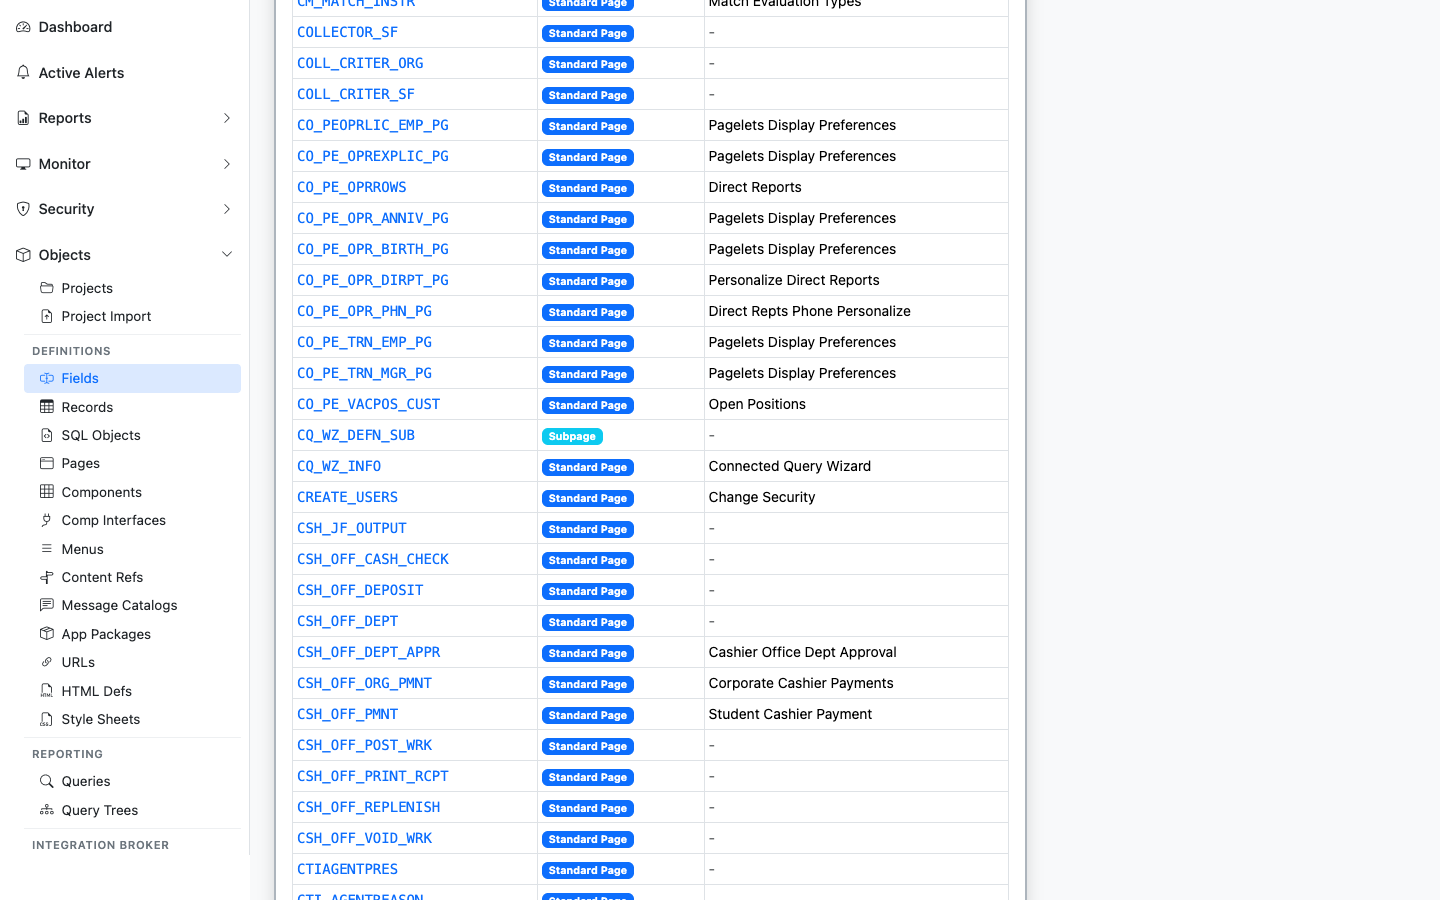
Understand Page and Component Structure
Need to know what fields are on a page? What record drives a component? Which menu path leads to it? Search for the component or page name in psLens and see:
The pages within a component
The records and fields on each page
The menu navigation path
The security (permission lists and roles) that control access
Research Security Configuration
When you need to understand who can access what:
Search for a user and see their roles
Search for a role and see its permission lists
Search for a permission list and see what it grants access to
Trace the full chain without asking anyone for help
Share What You Find
psLens deep links let you share a direct URL to any PeopleSoft object. Include links in your requirements documents, Jira tickets, or emails. When someone clicks the link, they see exactly what you are referencing, no instructions needed.
Export to Markdown for inclusion in documentation, presentations, or analysis.
Bridge the Communication Gap
One of the hardest parts of working with PeopleSoft is the gap between business needs and technical implementation. psLens helps bridge that gap by giving non-technical team members visibility into the technical side:
Understand what fields exist on a record before writing requirements
See how components are structured before requesting changes
Review security configuration before requesting access changes
Cite “PS_PERSONAL_DATA, field BIRTHDATE” in a Jira ticket and paste the psLens deep link, so the developer does not have to guess which page you meant
Common BA Tasks in psLens
Task
What You See
Research a component
Pages, records, fields, menu path, security
Understand a record
All fields with types, keys, descriptions, and labels
Check who has access
User > Role > Permission List > Component chain
Document a process
Export object definitions to Markdown
Write requirements
Reference exact field names, record structures, and component layouts
Why granting App Designer access for metadata research creates unnecessary risk, and how psLens provides a safer alternative with read-only browsing.
The Problem
Someone on the team needs to look something up in PeopleSoft. Maybe a business analyst is writing requirements and needs to see what fields are on a record. Maybe an auditor needs to understand how security is configured. Maybe a functional consultant needs to trace a component’s menu path.
The default answer is: give them App Designer.
This happens because App Designer is the only tool that lets you browse PeopleSoft object definitions. There is no read-only alternative built into PeopleSoft. So people who only need to look things up end up with the same tool that developers use to build and modify the application.
Walkthrough: Replacing App Designer with psLens for read-only metadata lookups
What App Designer Access Actually Grants
App Designer is a full development environment. When you give someone App Designer access, you are giving them the ability to:
Open and modify any object definition: records, pages, components, Application Engine programs, PeopleCode, and more
View all PeopleCode source across the entire application
Use SQL Editor to run arbitrary queries directly against the database
Create and migrate projects between environments
Connect directly to the database. App Designer requires a two-tier connection, which means the user’s workstation has network-level access to the database server.
Require specialized infrastructure. Because of the two-tier connectivity requirement, organizations often provision dedicated virtual machines or terminal servers just so users can run App Designer. That is additional infrastructure to maintain, patch, and secure, all so someone can look something up.
And critically: App Designer activity is difficult to audit. There is no built-in log of which objects a user opened, viewed, or modified through the tool. You are trusting that users will only do what they are supposed to do, with no way to verify.
The Principle of Least Privilege
Least privilege is straightforward: give people the minimum access they need to do their job. If someone needs to look up a record definition, they should not need a tool that can also modify that record, run SQL against the database, and view every line of PeopleCode in the system.
This is not a theoretical concern. Internal and external auditors (SOX, SOC 2, and others) increasingly ask about developer tool access:
Who has App Designer access?
Why do they have it?
What controls exist to prevent misuse?
When the answer is “they have it because they need to look things up and there is no other way,” that is a gap psLens removes by giving the same researchers a read-only browser UI with no SQL, no PeopleCode write access, and no database connection.
How psLens Compares
Capability
App Designer
psLens
View object definitions
Yes (plus can modify)
Yes (read-only)
View PeopleCode source
Yes
Yes (read-only)
Modify PeopleSoft objects
Yes
No, by design
Run SQL queries
Yes (SQL Editor)
No
Database connectivity
Direct two-tier connection
None, uses web services API
Infrastructure
Desktop client, often a dedicated VM or terminal server
License savings. PeopleTools client licenses are not free. Every user who moves from App Designer to psLens is a license you do not need to maintain.
No desktop installation or VM access. App Designer requires installation on a workstation or access to a dedicated virtual machine or terminal server. psLens runs in any browser, no specialized infrastructure needed.
Immediate productivity. New team members can start researching PeopleSoft configuration on their first day. No App Designer training, no connectivity setup, no waiting for access provisioning.
Access from anywhere. psLens is a web application. No VPN or direct database connectivity required (depending on your network configuration).
Who This Applies To
Any role that uses App Designer primarily for research rather than development:
Business Analysts: researching components, records, and page structures for requirements
Functional Consultants: understanding configuration and tracing security chains
Auditors: reviewing security setup, permission lists, and access grants
Support Analysts: looking up object definitions during incident investigation
Project Managers: understanding scope and impact of proposed changes
New Team Members: learning the system during onboarding
If they are not writing PeopleCode or building projects, they probably do not need App Designer.
How psLens exports PeopleSoft metadata as Markdown so AI and LLM tools like ChatGPT and Claude can read objects, code, and projects.
The Problem: PeopleSoft Is a Black Box to AI
PeopleSoft hides its source code from the filesystem. Object definitions live in a relational database, not in files. PeopleCode is embedded in the runtime, not on a filesystem where tools can read it. There are no Git repositories, no IDEs with language server support, no standard ways to extract metadata programmatically.
This means AI tools like ChatGPT, Claude, and Copilot cannot see your PeopleSoft system. They have general knowledge of PeopleTools concepts, but they have no way to read your specific records, your PeopleCode, your component structure, or your security configuration. You cannot point an LLM at your PeopleSoft environment and ask it to help.
Unless you can get the data out first.
How psLens Exports PeopleSoft for AI
psLens exports PeopleSoft object definitions to structured Markdown. Every object type has a one-click export, and the output works in two places:
Web chat boxes like ChatGPT and Claude. Paste the Markdown into the conversation and the model reads the full object definition with structure preserved.
Local AI coding agents like Claude Code, Cursor, and Aider. Save the export as a file in your project and the agent reads it as context the same way it reads any other source file.
Both paths use the same Markdown artifact. Pick whichever your team already works in.
See the Artifact Before You Install
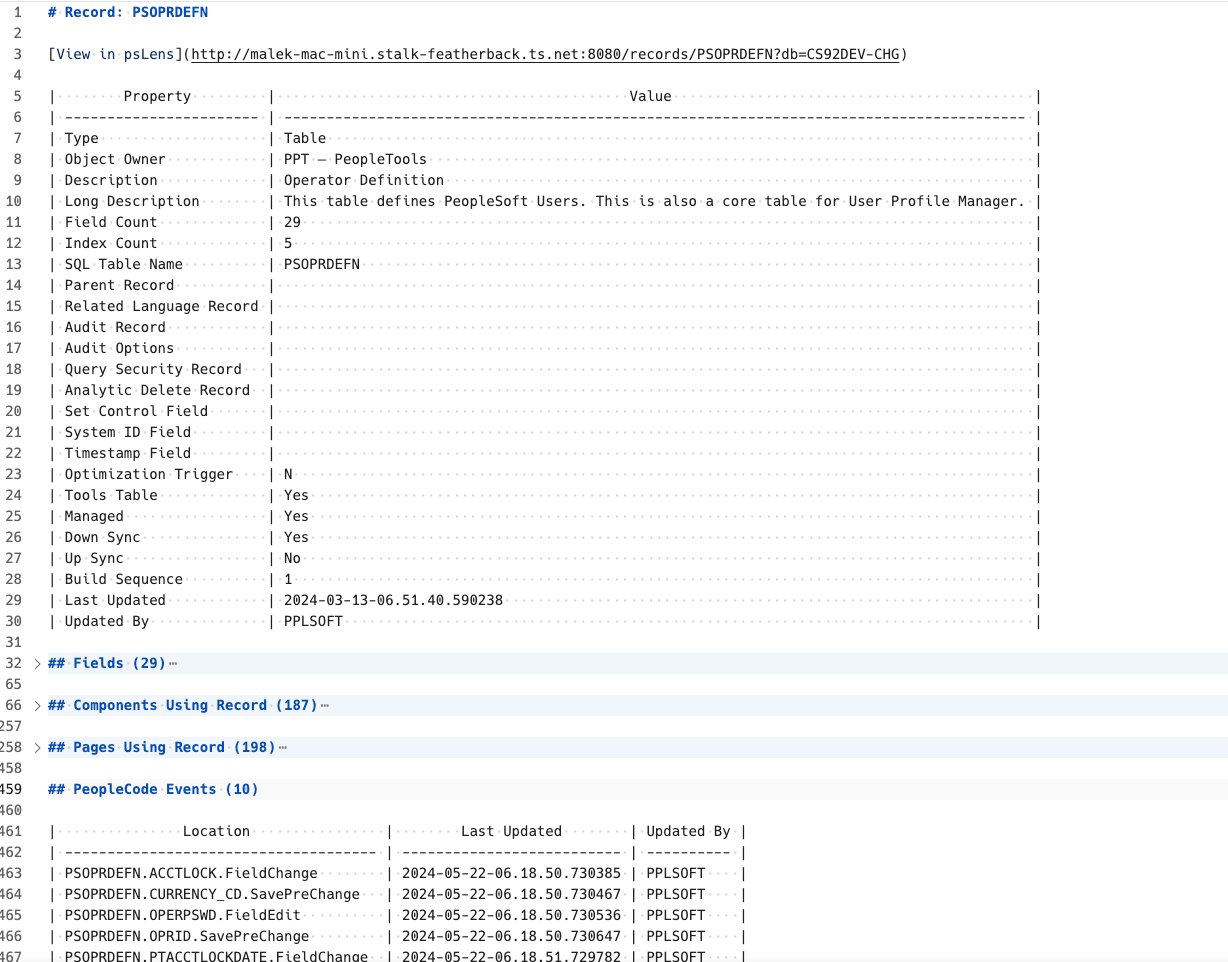
If you want to inspect the kind of plain-text output psLens produces before deploying anything, start with Sample Report Output. Those files are real exported Markdown documents from a development environment, with only hostnames and service-account names changed.
The export is structured Markdown, not a flat text dump, so AI tools keep the hierarchy, tables, and code context intact
What You Can Export
Object Type
What the Export Contains
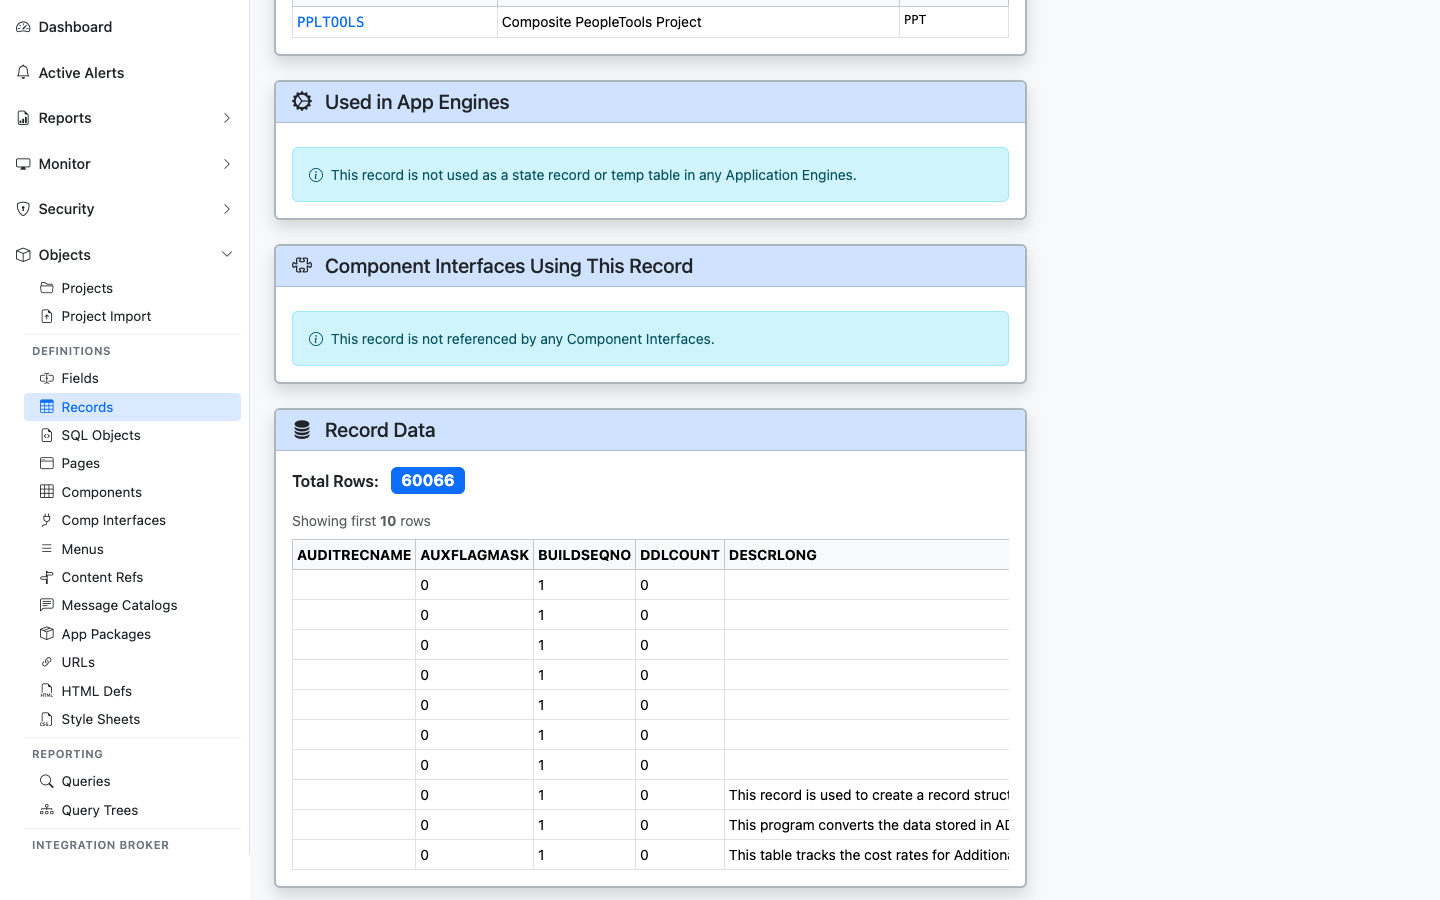
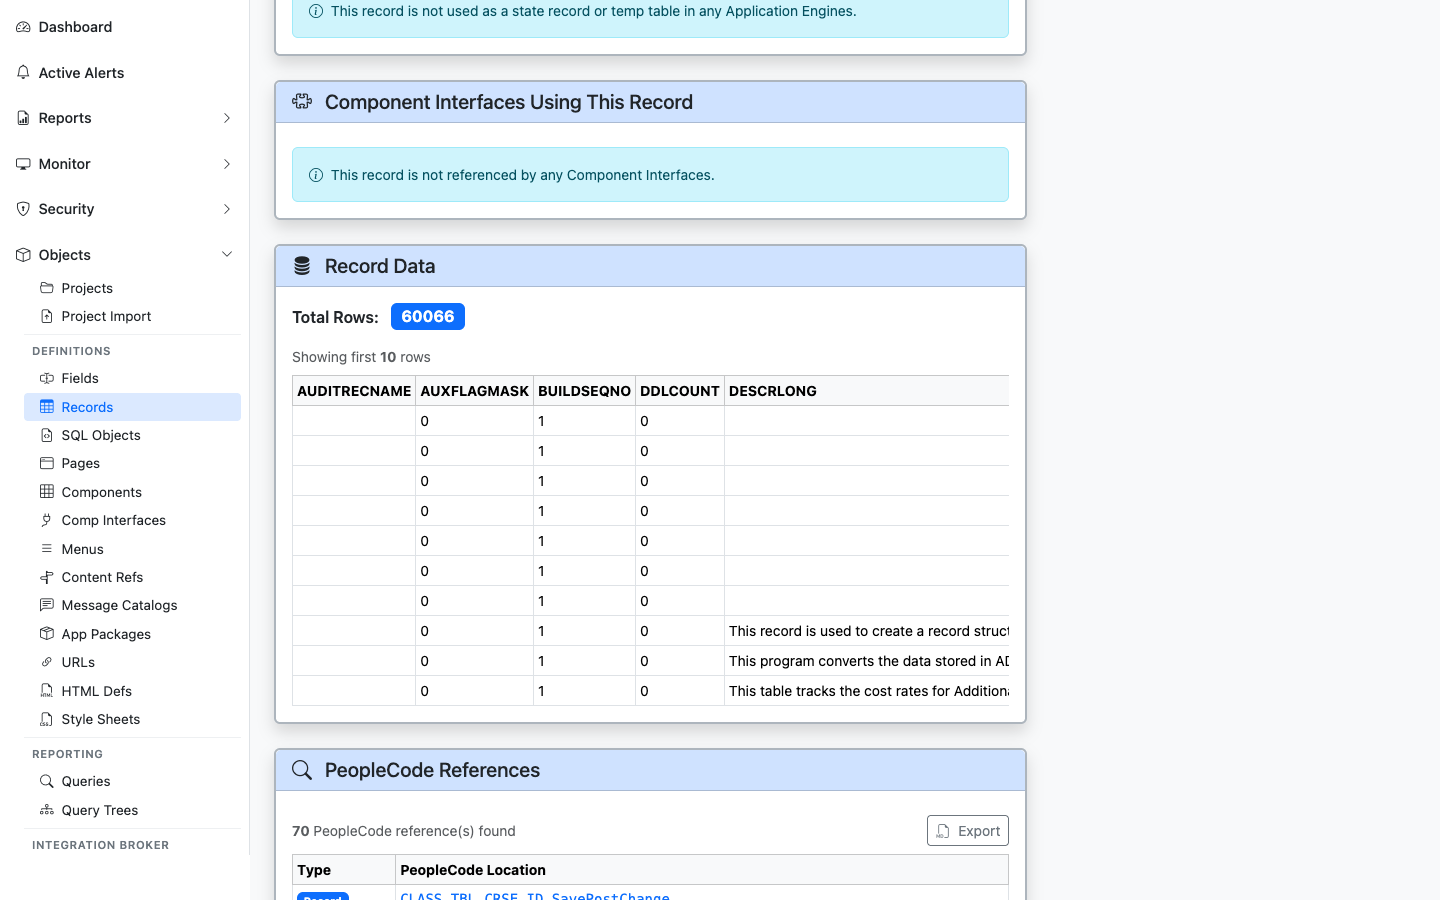
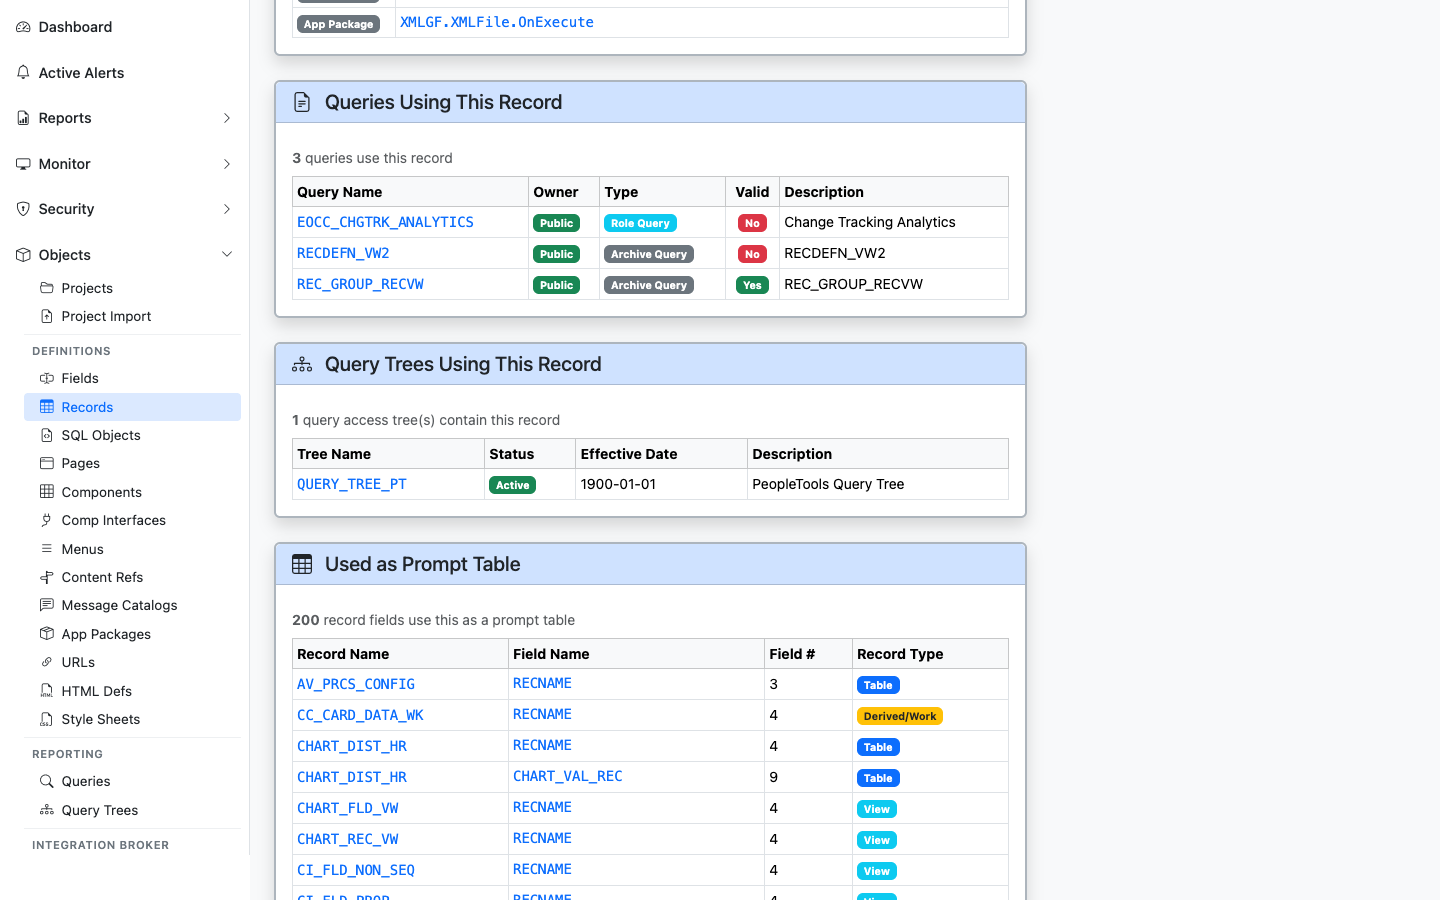
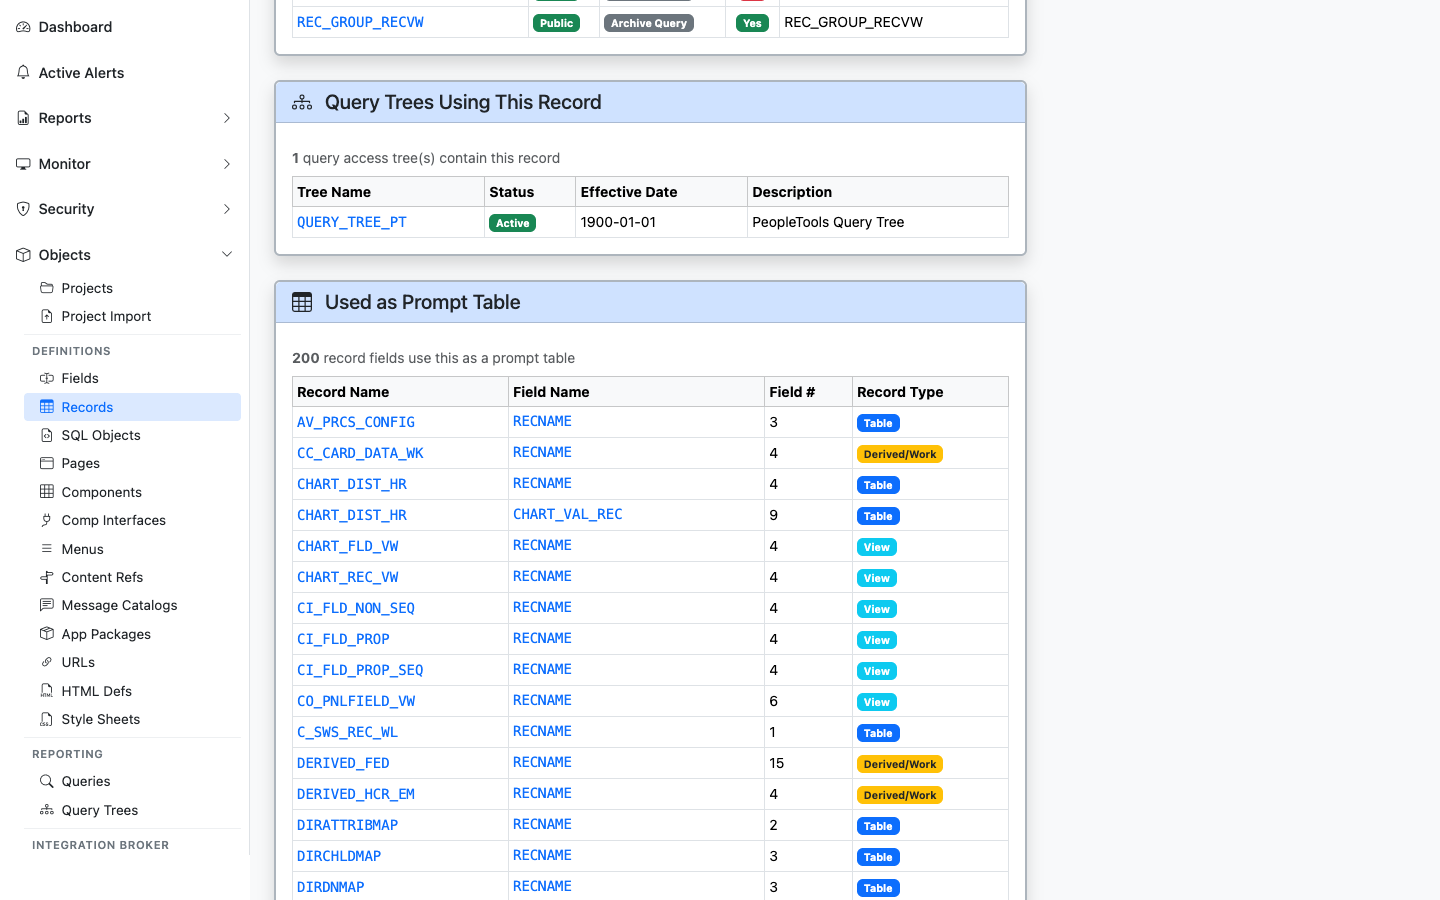
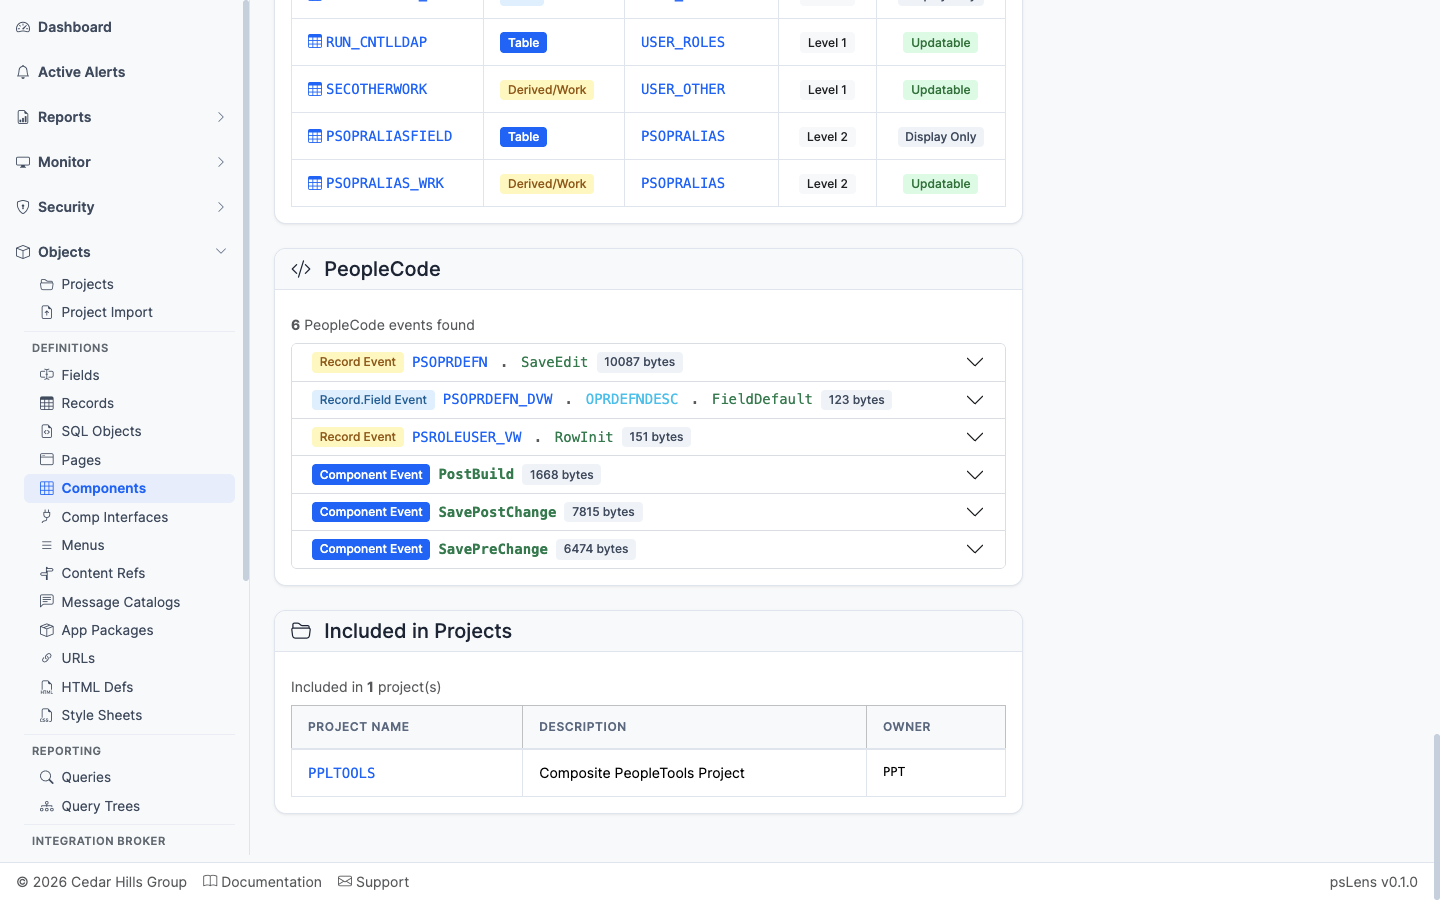
Records
Field definitions, types, keys, lengths, descriptions, labels, sub-records, SQL definitions, related pages, PeopleCode events, project membership
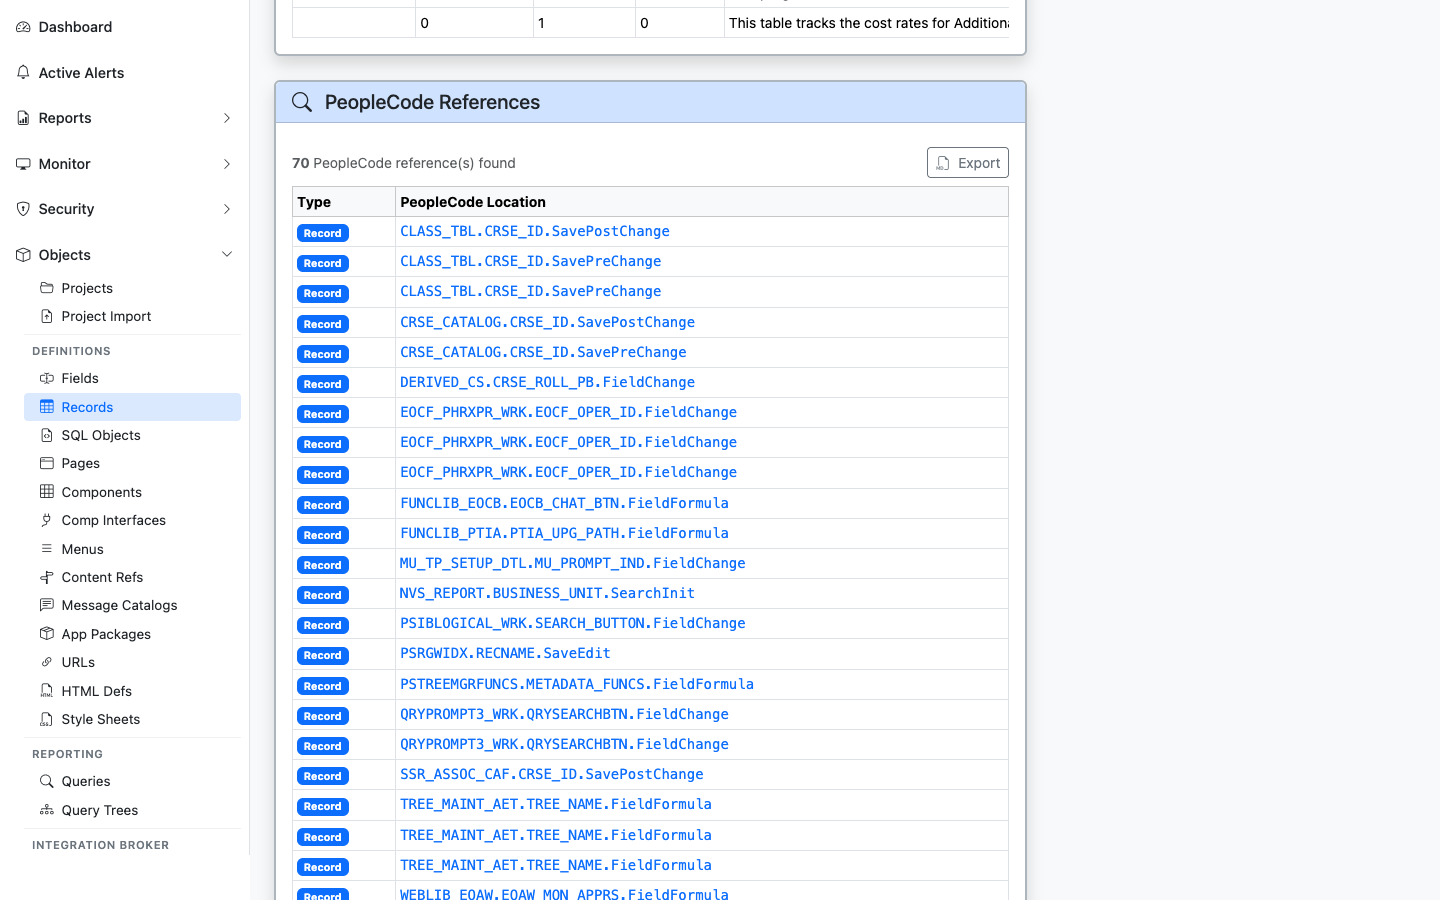
Fields
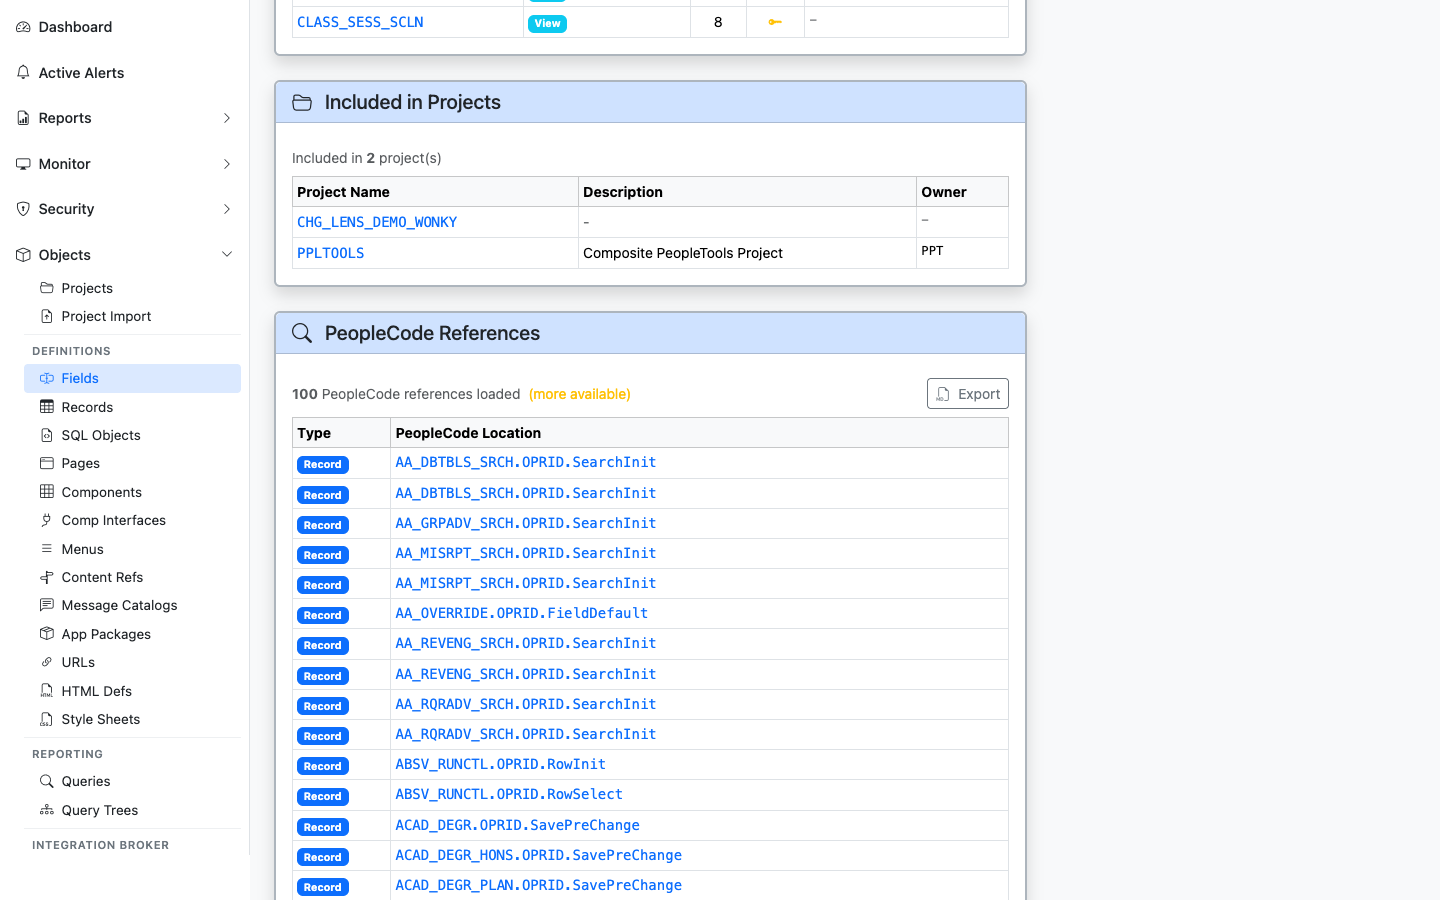
Field metadata, translate values, labels, records using the field, PeopleCode references
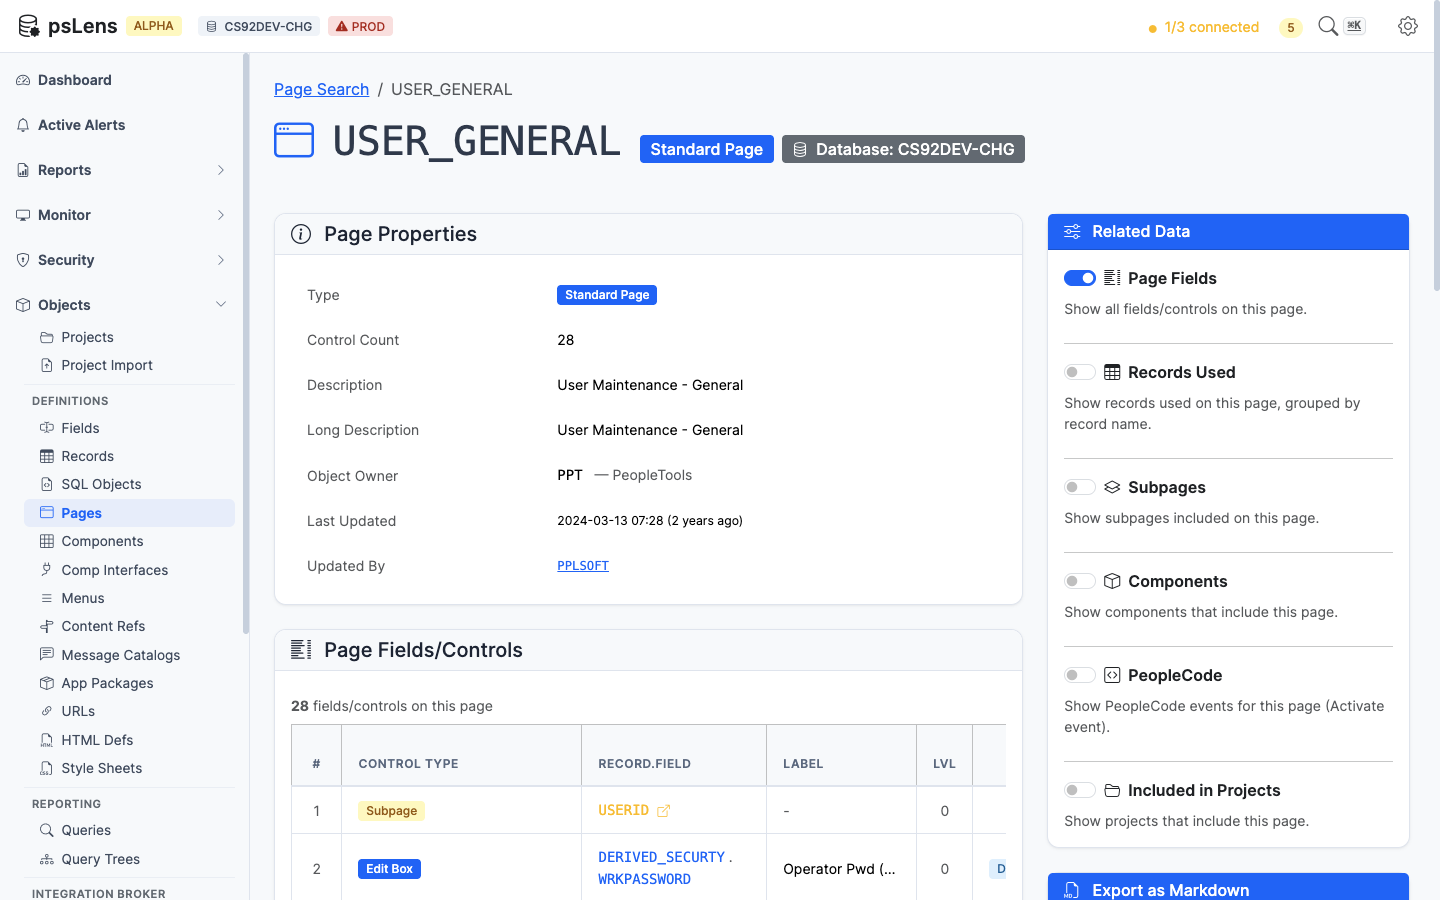
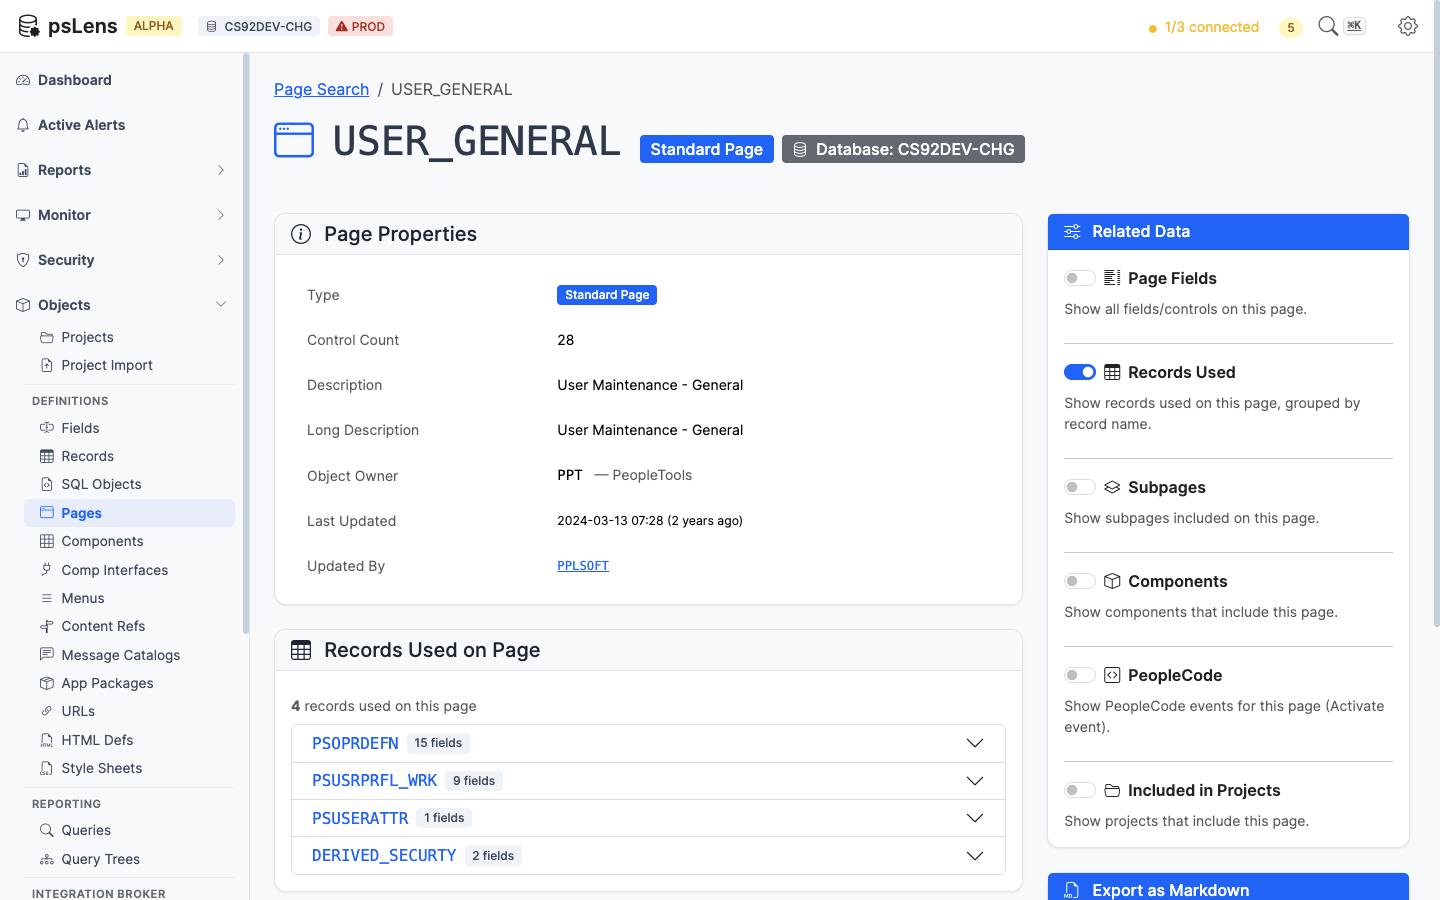
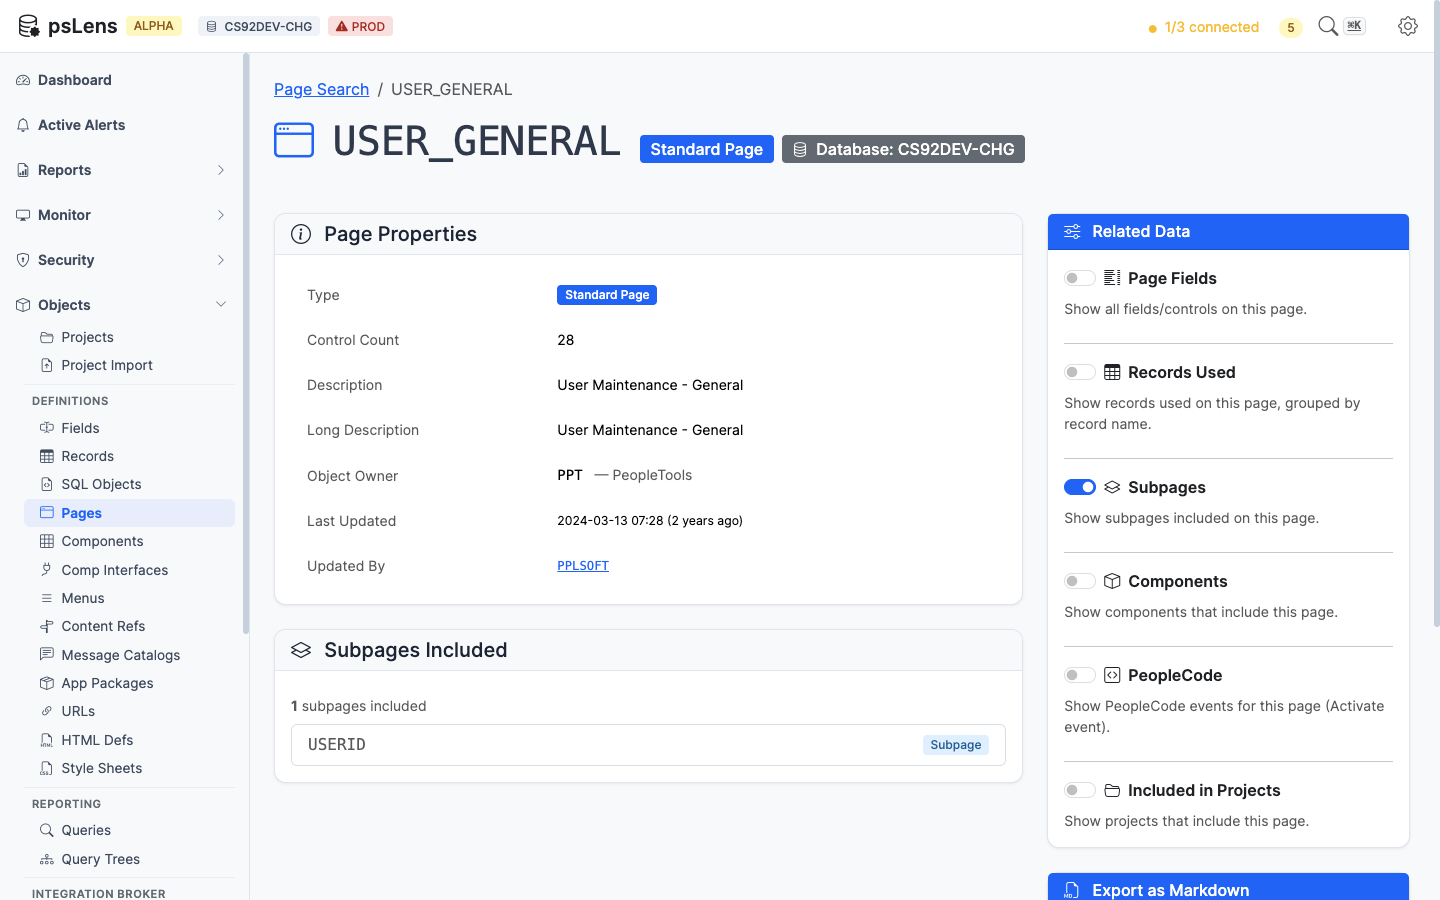
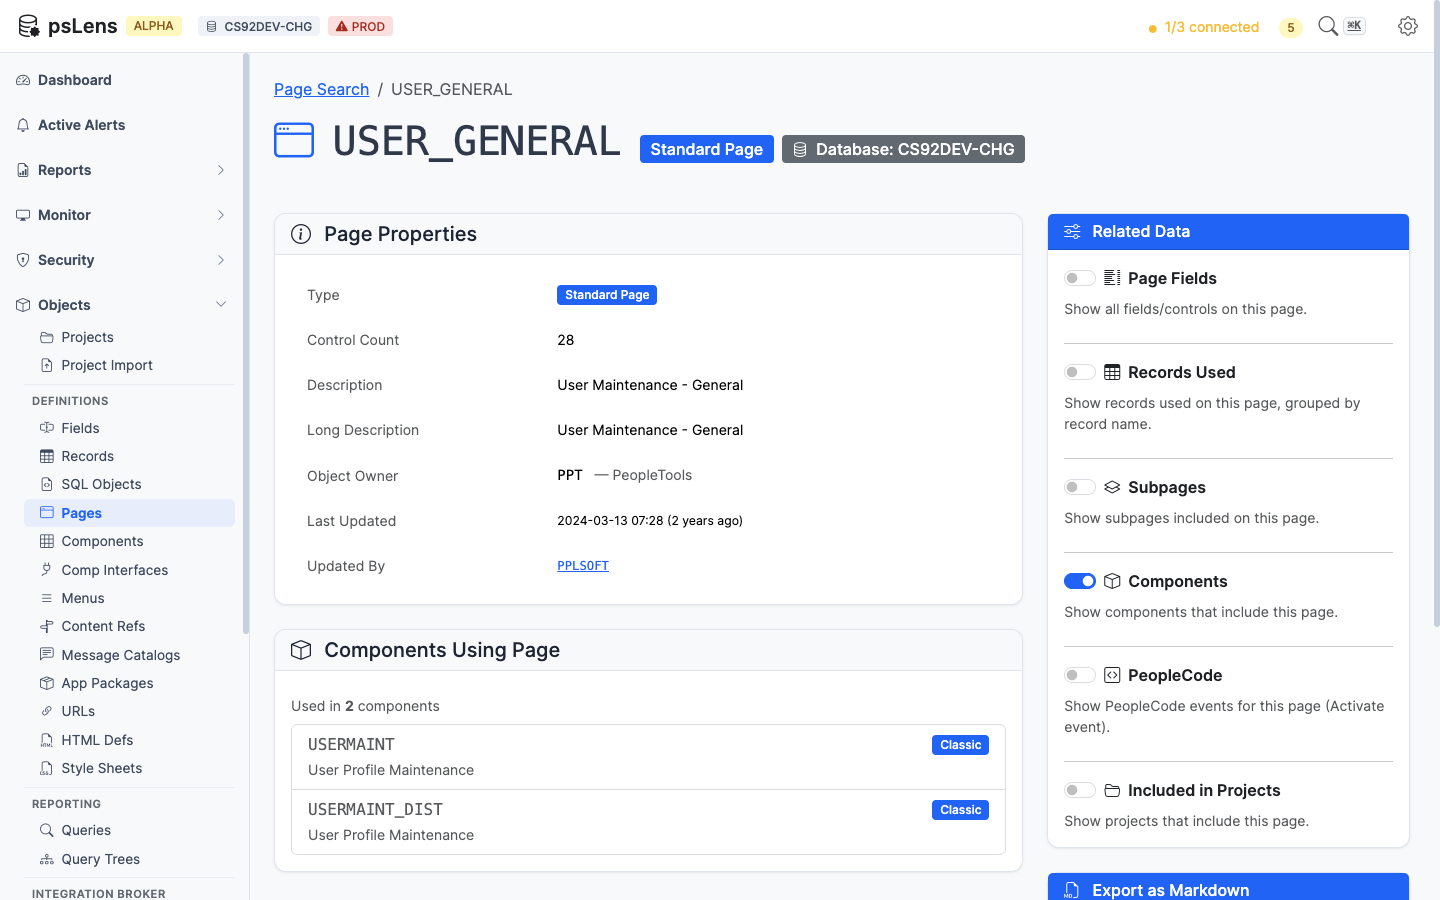
Pages
Controls and fields, records used, subpages, parent pages, components using the page, PeopleCode events
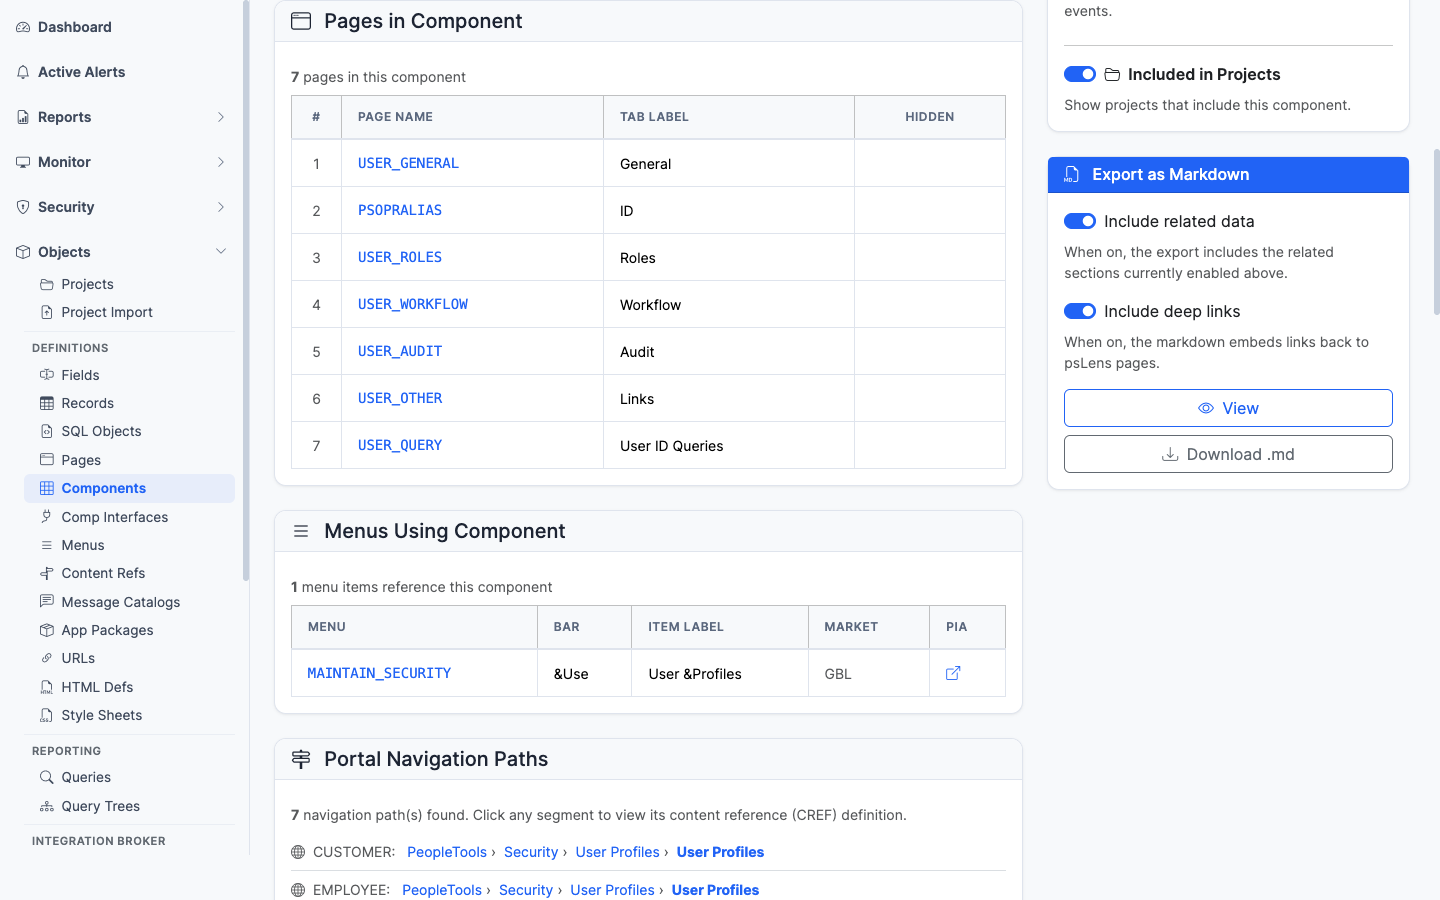
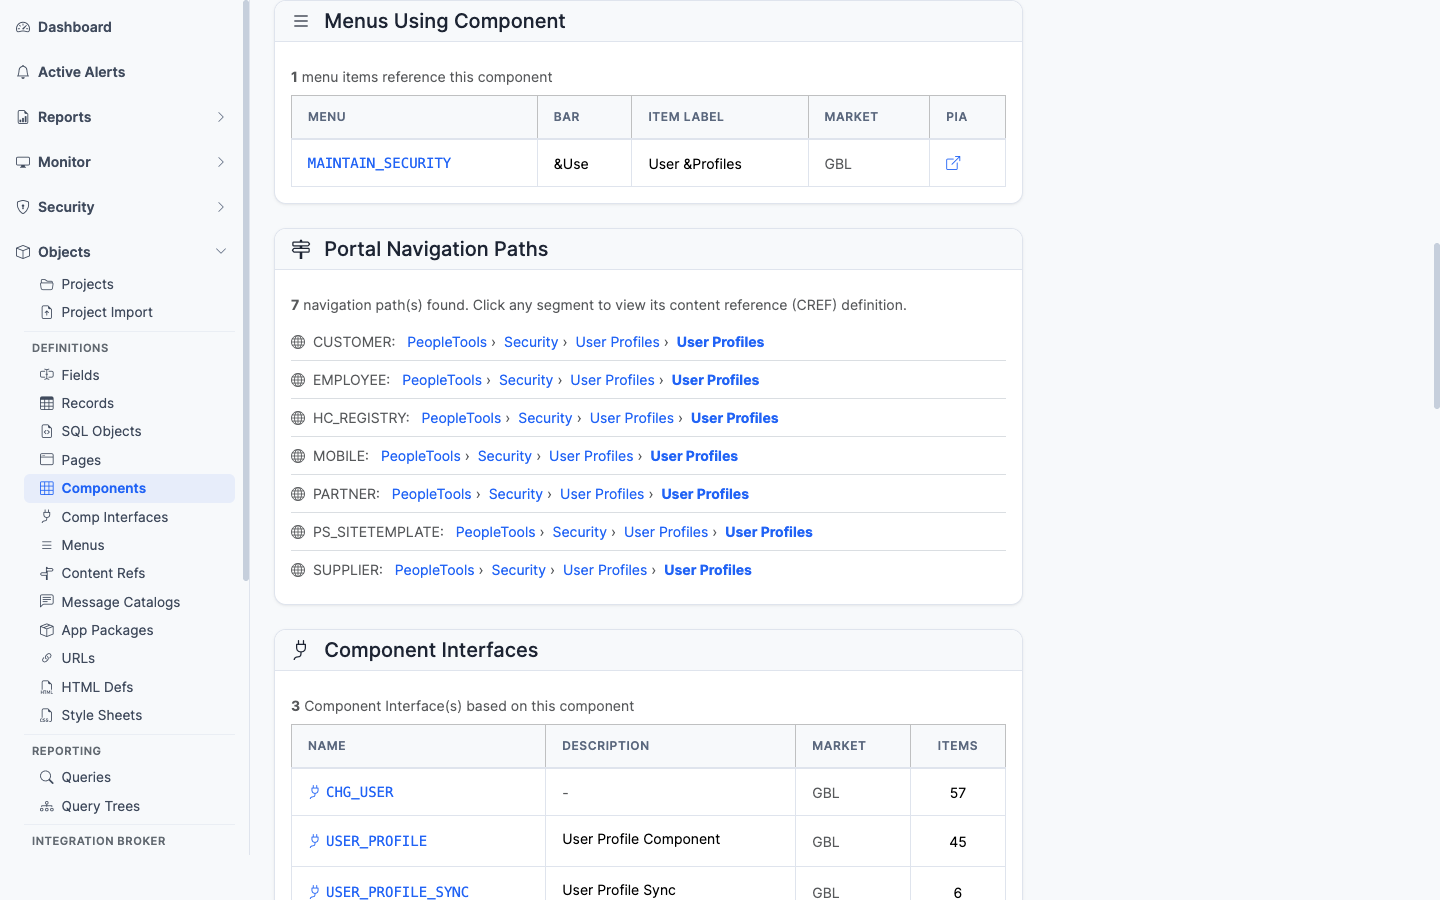
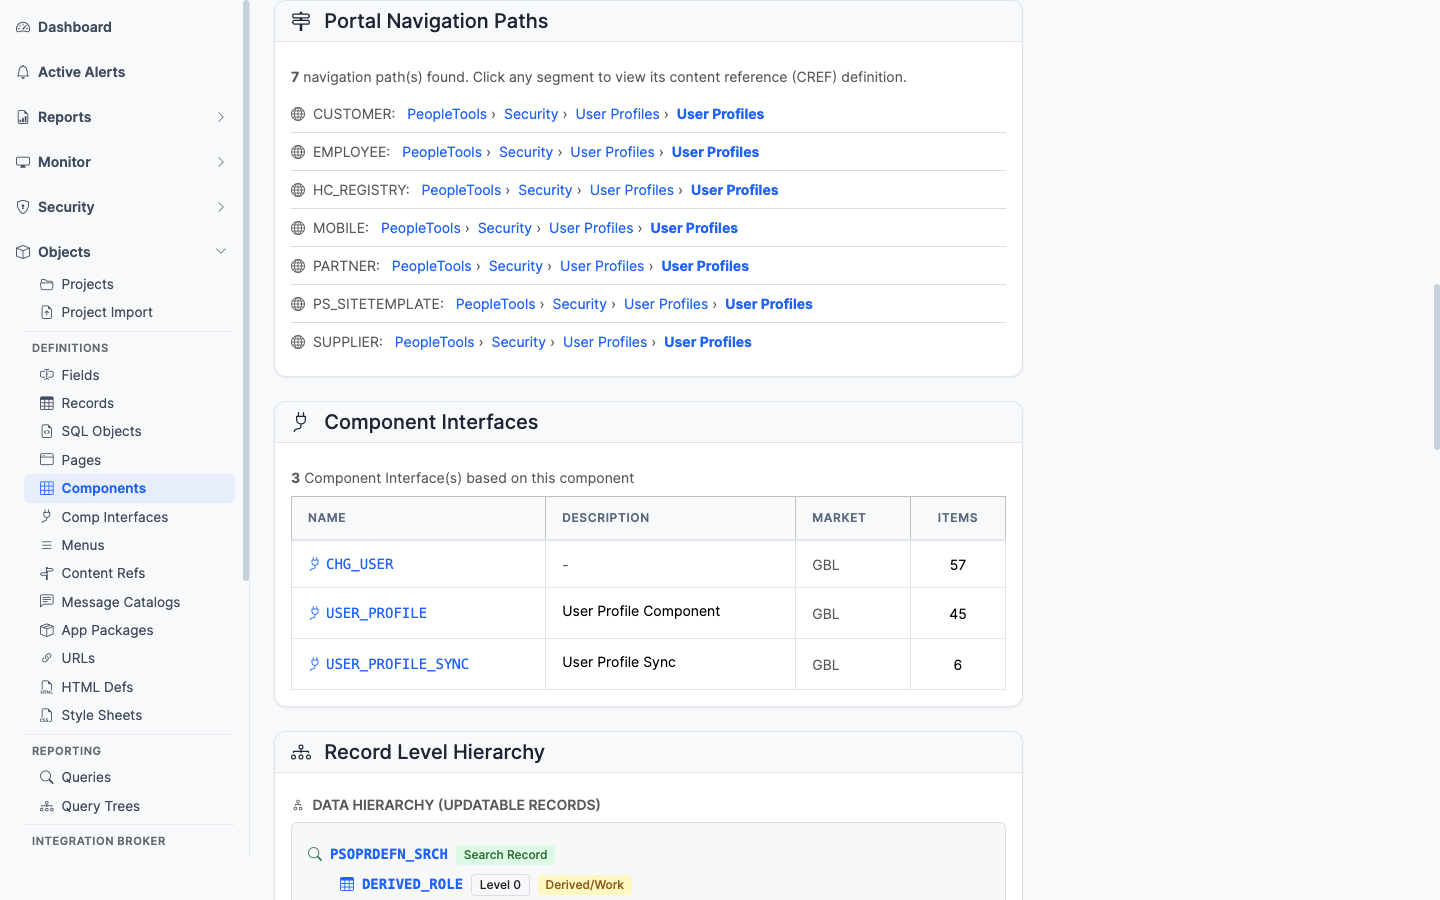
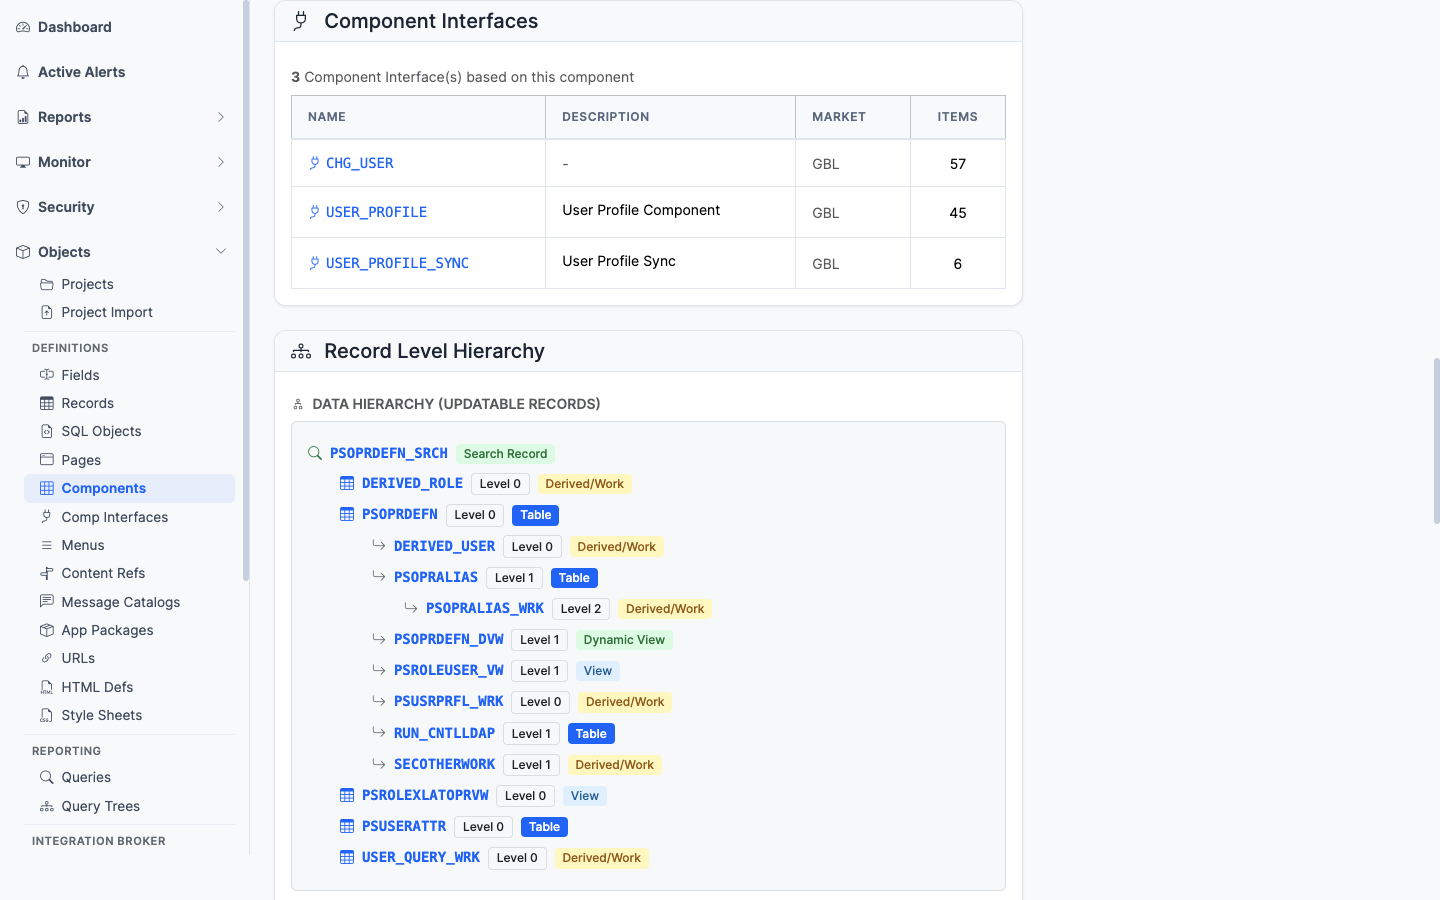
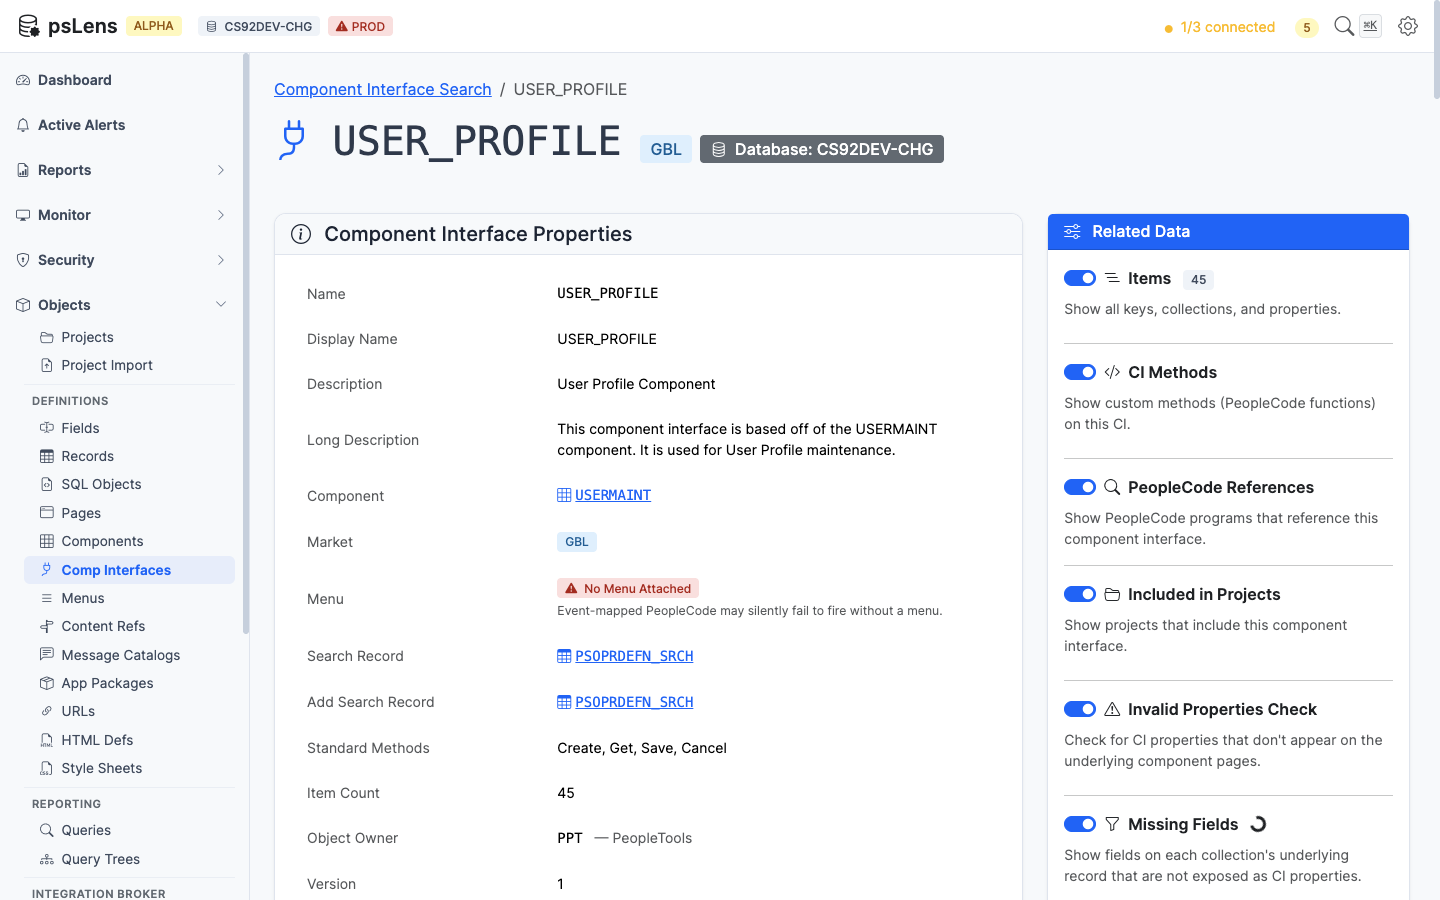
Components
Pages, menu paths, portal navigation, search records, component interfaces, PeopleCode events, related records
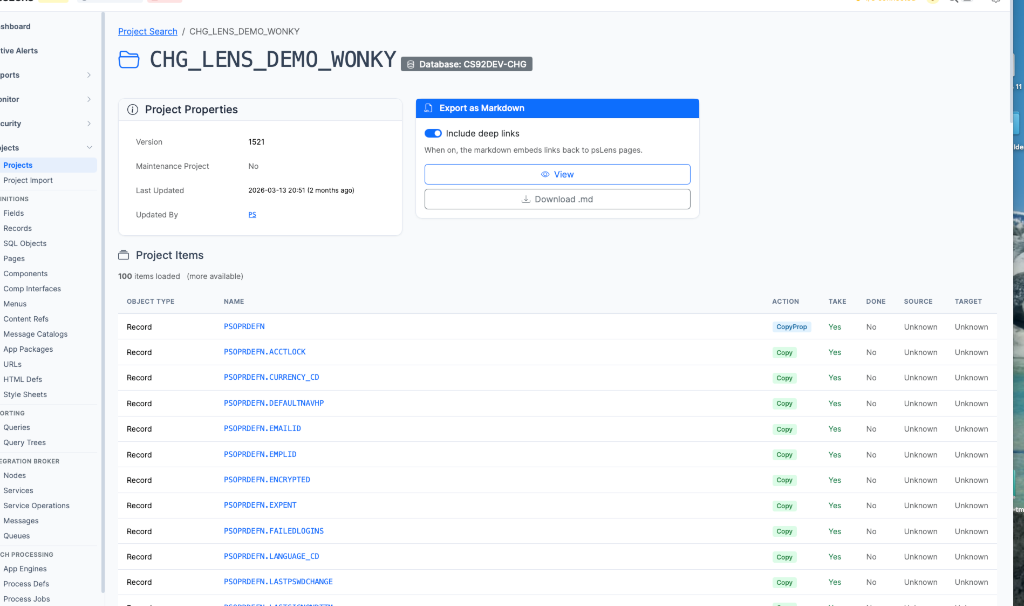
Projects
All project items with counts, PeopleCode source inline, SQL definitions, stylesheets, HTML objects — everything in one document
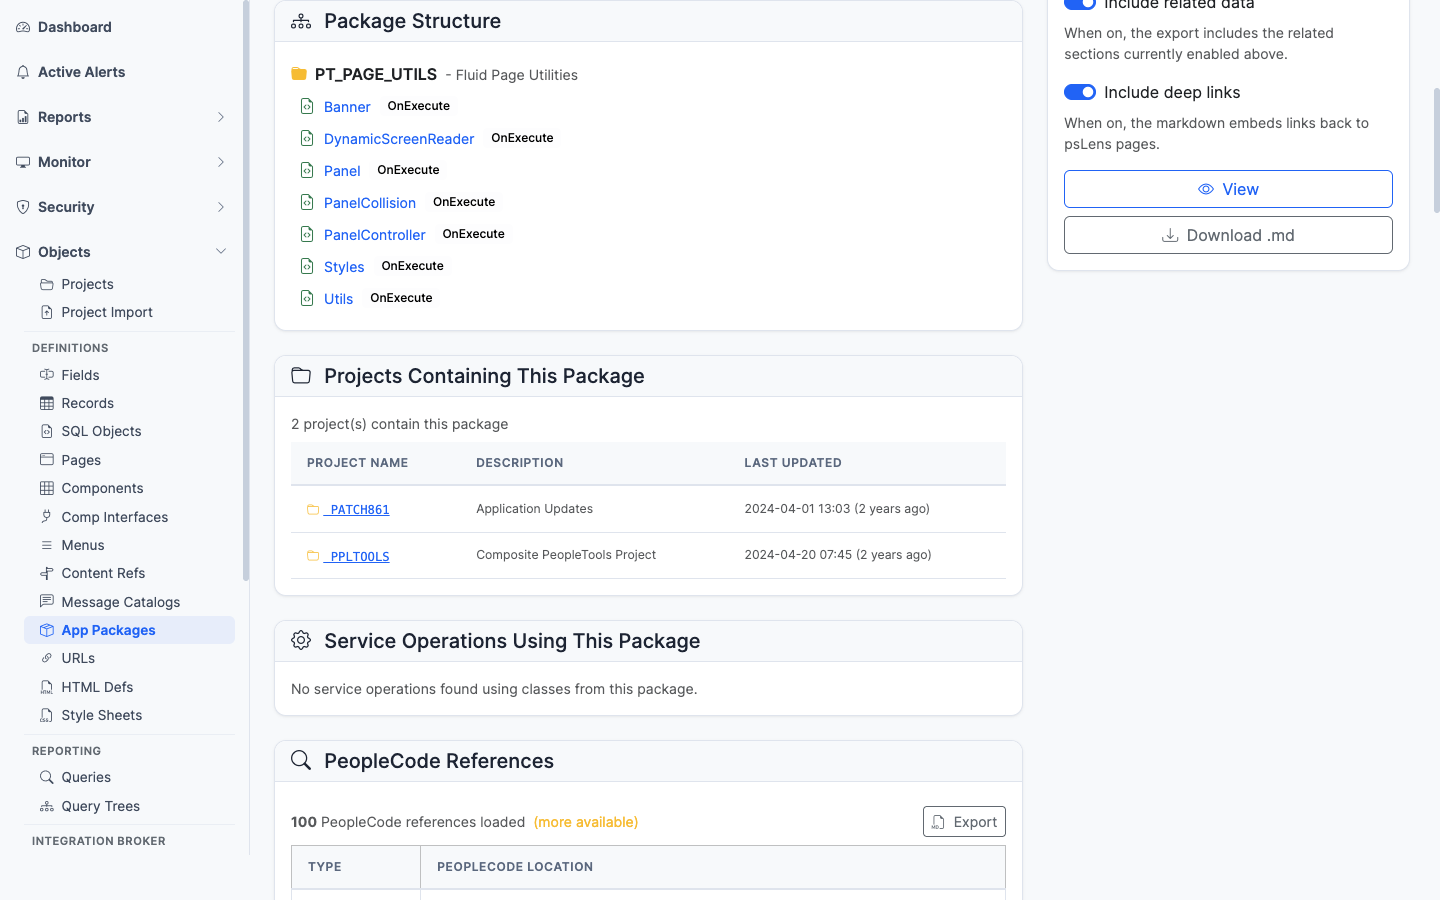
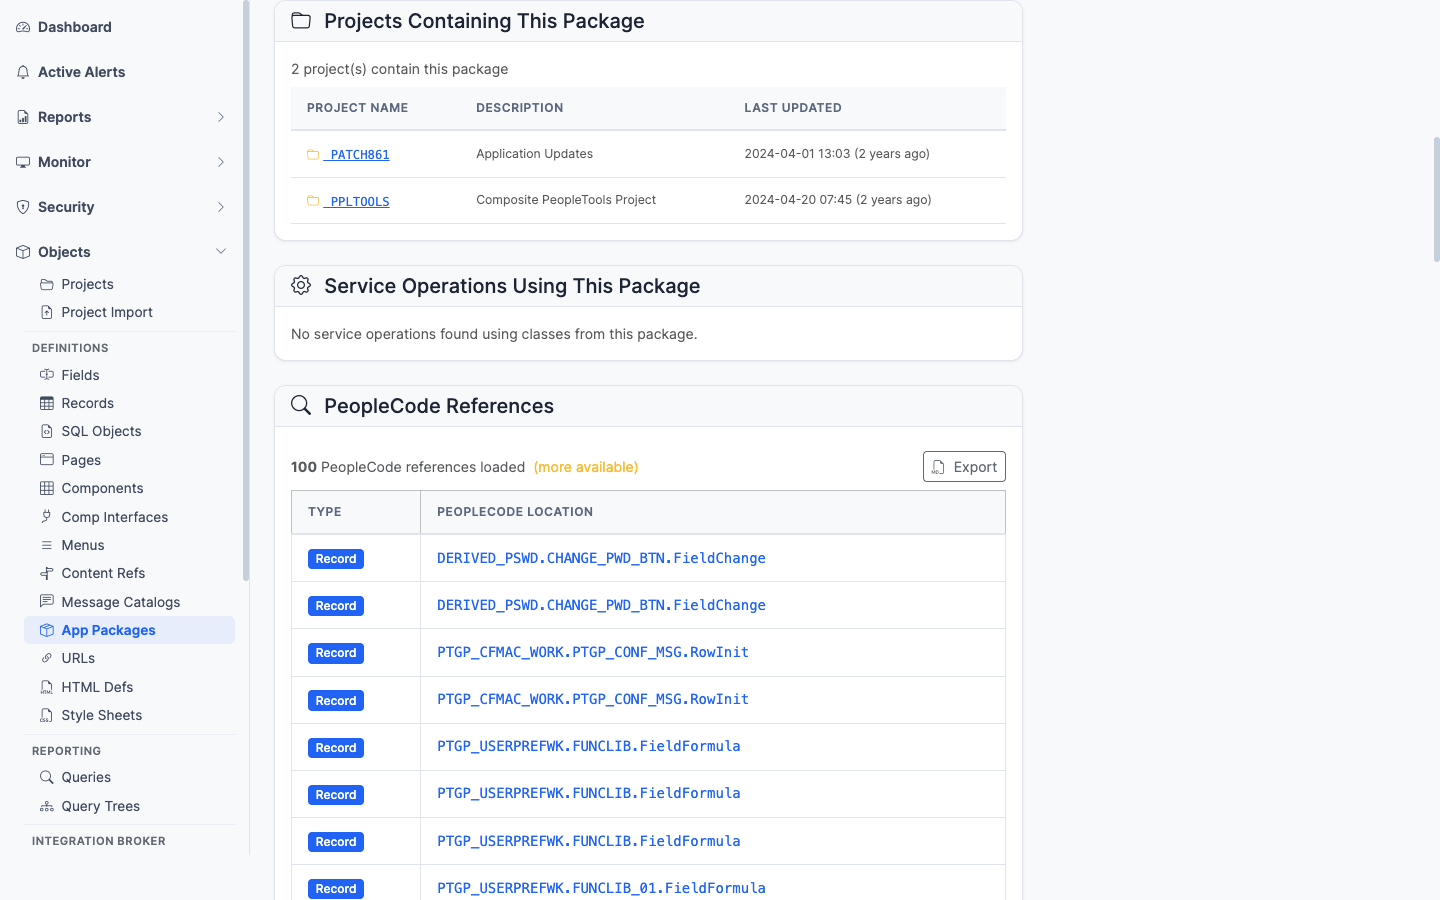
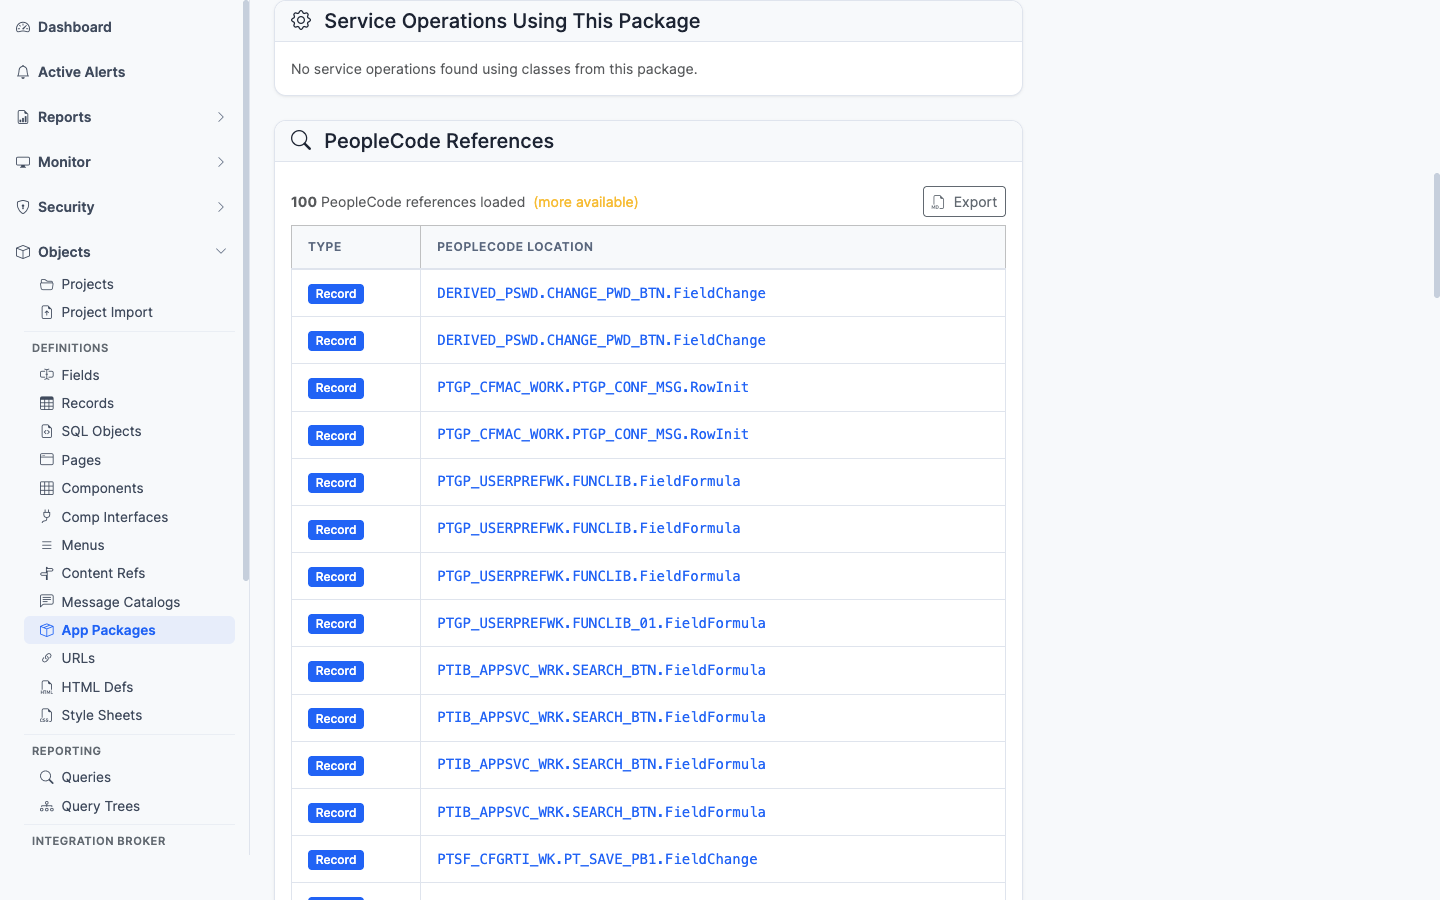
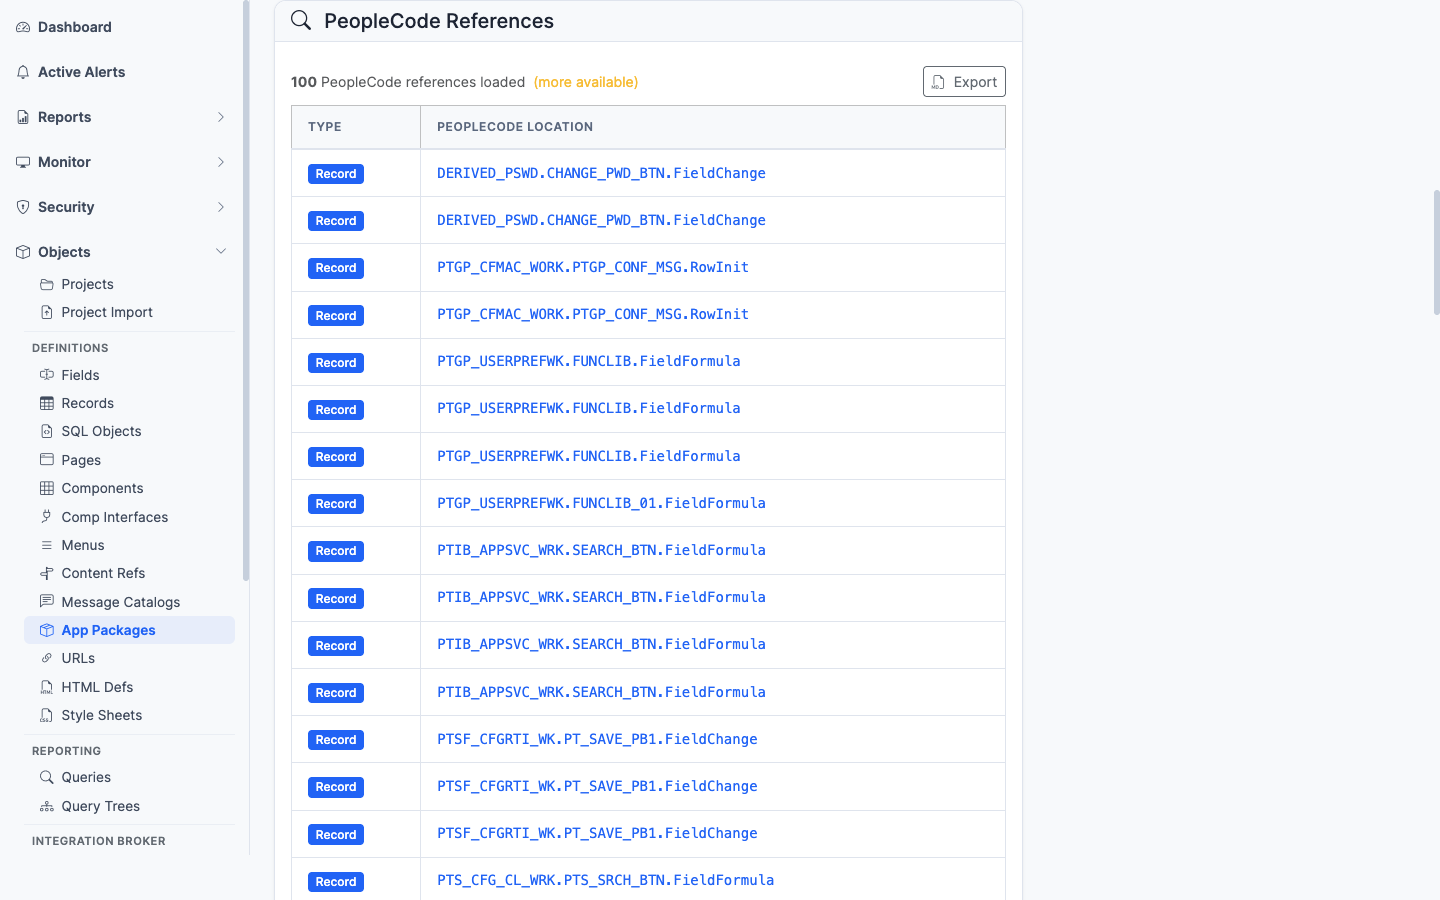
Application Packages
Package hierarchy, all PeopleCode by class, service operations, references
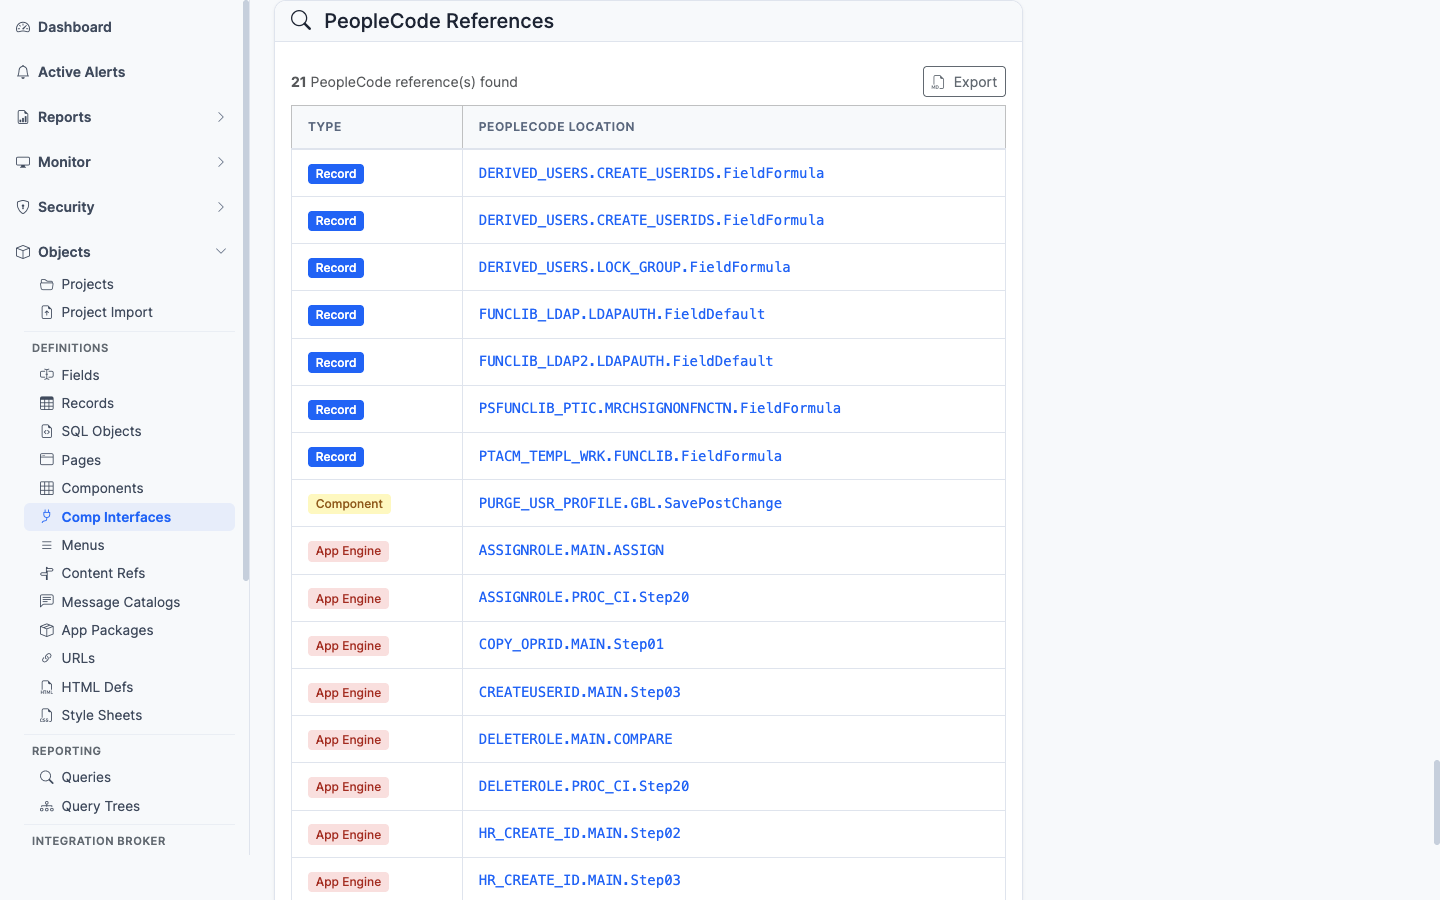
PeopleCode
Full source code for any PeopleCode program, organized by event or method
Exports include links between related objects so the AI can understand how things connect, not just what a single object looks like in isolation.
Recursive Reference Resolution
For objects containing PeopleCode (such as records, components, application packages, or app engines), enabling Recursively resolve imports in the export card instructs psLens to scan the source code for:
Application Class imports (e.g. import PACKAGE:SubPackage:Class;)
External function declarations (e.g. Declare Function Name PeopleCode RECORD.FIELD Event;)
The exporter fetches the source code for each referenced package class and declared function from the database. It appends the resolved code to a ## Resolved PeopleCode References section at the end of the document. This generates a self-contained snapshot containing both the primary object and all its dependencies, providing the complete context required by AI models without manual retrieval.
What You Can Do With It
Code Review and Analysis
Export a project or application package and ask an LLM to:
Review PeopleCode for bugs, performance issues, or security concerns
Explain what a complex Application Engine does step by step
Identify unused variables, dead code paths, or redundant logic
Compare coding patterns across different programs
Flag SQL injection risks or other vulnerabilities in PeopleCode
PeopleSoft developers have always done code review by reading PeopleCode in App Designer one program at a time. With psLens exports, you can hand an entire project’s worth of code to an AI and get a full review in minutes.
Technical Documentation
Export objects and ask an LLM to generate:
Technical specification documents for existing customizations
Data dictionary entries from record and field exports
Component documentation including page flow, security, and data relationships
Migration guides based on project contents
Onboarding documentation for new team members unfamiliar with a module
This is especially valuable for undocumented customizations — the ones everyone is afraid to touch because nobody remembers what they do or why they exist.
Impact Analysis
Before making a change, export the relevant objects and ask an LLM:
“What would break if I added a field to this record?”
“Which components and pages use this record?”
“What PeopleCode references this field?”
“If I change this Application Engine step, what downstream effects should I test?”
psLens exports include the relationship data that makes this possible: which pages use a record, which components include a page, which projects contain an object, and where PeopleCode references exist.
Knowledge Transfer
PeopleSoft environments accumulate decades of customizations. The people who built them leave. Documentation is incomplete or nonexistent. New team members struggle to understand what exists and why.
Export key objects and projects to Markdown and use an LLM to:
Generate summaries of what a customization does and why it might exist
Create Q&A-style knowledge base articles from raw object definitions
Translate technical PeopleSoft structures into plain language for non-technical stakeholders
Build training materials from actual system configuration
Upgrade and Migration Planning
When preparing for a PeopleTools upgrade or a move to PeopleSoft Cloud:
Export projects containing customizations and ask an LLM to assess upgrade risk
Identify PeopleCode patterns that may be deprecated in newer PeopleTools versions
Generate a catalog of all custom objects with descriptions and dependencies
Compare pre- and post-migration exports to verify nothing was lost
Security Analysis
Export permission lists, roles, and security configuration and ask an LLM to:
Identify permission lists with unusually broad access
Find roles that combine conflicting duties (separation of concerns)
Generate audit-ready documentation of who has access to what
Recommend security consolidation opportunities
Using Exports With Local AI Coding Agents
The same Markdown export that works in a chat box works as a context file for a local agent. The usage pattern is:
Open the object detail page in psLens and click Export as Markdown. The file lands in your downloads folder.
Move it into the workspace your agent has access to. For Claude Code or Cursor, that is typically the repo you have open. A context/peoplesoft/ folder is a useful convention.
Reference the file in your prompt. For example, in Claude Code: Review @context/peoplesoft/PROJECT_HCM_CUST.md and flag any PeopleCode that does unbounded SQL. The agent reads the file as part of the conversation context.
This pattern works for any agent that reads files: Claude Code, Cursor, Aider, Continue, the local-MCP-host model in your IDE. The agent gets the same structured definition a chat user would paste, with the same one-click export workflow on the psLens side.
For repeated work against the same set of objects (a customization you maintain, an Application Engine you keep reviewing), keep the exported file in version control alongside the agent’s other context.
Why Markdown Matters
LLMs work best with structured text. Markdown gives them:
Clear hierarchy: headings, sections, and subsections that establish context
Tabular data: field definitions, metadata, and relationships in a format LLMs parse well
Inline code: PeopleCode and SQL in fenced code blocks that LLMs recognize as code
Links and references: relationships between objects that provide the context an LLM needs to give useful answers
Other export formats (CSV, PDF, screenshots) lose structure, context, or both. Markdown preserves everything.
The PeopleSoft AI Gap
Most enterprise platforms have moved toward open formats, APIs, and file-based source code that AI tools can access natively. PeopleSoft has not. Its metadata is locked in database tables, its source code is embedded in the runtime, and its object definitions require App Designer or direct SQL to access.
psLens bridges that gap. It reads PeopleSoft metadata through web services and exports it in the format that AI tools consume best. Your team does not need database access, App Designer, or custom SQL to feed PeopleSoft data to an LLM. They just click export.
Roadmap: psLens as an MCP Server
The export-and-paste workflow above puts the developer in the loop. The next step removes that loop: psLens exposes its surfaces as a Model Context Protocol server so AI tools can query PeopleSoft live.
The design is spec’d: an MCP server embedded in your psLens instance, read-only against PeopleSoft, behind API-key authentication and the same table whitelist as the dashboard. Generic tools (search_object, get_object, get_related, get_peoplecode) cover every object type psLens browses; composed tools like user_access and who_has_access answer common security questions in one call; run_report drives the existing report engine. The full tool catalog and five concrete use cases (metadata research, ad-hoc security Q&A, ops triage, recurring report cadences, post-migration drift checks) are on the Roadmap page.
The health overview of all connected databases and active alerts.
System Overview
The home screen of psLens (System Overview) gives you a quick health overview of all your connected PeopleSoft databases, with a focus on anything that currently needs attention.
The psLens dashboard showing database connection status and active alerts
What You See on the Dashboard
Alert Summary
The top section of the dashboard shows active alerts grouped by database. Each alert card tells you:
What type of issue was found (for example, long-running processes or IB errors)
How many items were found in this check
When the check last ran
A link to the relevant monitor page for more detail
Alerts are color-coded by severity:
Color
Severity
Meaning
Red
Critical
Immediate attention recommended
Yellow
Warning
Should be investigated
Blue
Info
Low priority, worth noting
If there are no active alerts, the dashboard shows an “all clear” state.
Database Connection Status
The dashboard also shows whether psLens can connect to each configured database. A database that is unreachable will still show in the list but will be marked as disconnected. Alerts for a disconnected database won’t run until the connection is restored.
How Alerts Are Refreshed
The dashboard uses a live connection to the psLens server. Alert results are updated automatically on the page as new check results arrive — you do not need to manually refresh.
Alert checks run on a background schedule (default: every 5 minutes). The timestamp on each alert card shows when that specific check last completed.
Navigating from the Dashboard
Each alert item on the dashboard has a direct link to the relevant page in psLens. For example:
A long-running process alert links to the Process Monitor entry for that process instance
An IB operation error alert links to the IB Monitor entry for that operation
A process error alert links to the Process Monitor entry for that process
Dismissing Alerts
Alert results are automatically cleared when the underlying issue resolves. For example, if a long-running process finishes, its alert disappears from the dashboard on the next check cycle. There is no manual dismiss — the alerts always reflect the current state of the system.
Alert Configuration
Alerts are configured in config.yaml. You can enable or disable individual alert types, adjust thresholds, and exclude specific processes or operations. See Configuration and Alerts for details.
5 - Monitor
Real-time operations monitoring dashboards for the Process Scheduler and Integration Broker.
Monitor
psLens provides two operational monitoring dashboards to keep track of the background activity and integration health of your PeopleSoft environments in real time.
Process Monitor — Monitor running, queued, and recently completed Process Scheduler requests.
Process Heatmap — Analyze historical Process Scheduler density and peak utilization windows.
IB Monitor — Track real-time message traffic, publication contracts, and subscription contracts flowing through the PeopleSoft Integration Broker.
5.1 - Process Heatmap
The Process Heatmap plots historical Process Scheduler activity as a day-of-week by hour-of-day grid, so you can see when the scheduler is busy.
Process Heatmap
The Process Heatmap plots historical Process Scheduler activity as a day-of-week by hour-of-day grid, so you can see when the scheduler is busy. Use it to find peak hours, scheduler idle windows, and times when a specific job actually runs.
The Process Heatmap dashboard visualizes hourly processing density to highlight peak scheduling windows.
Key Features
Density Visualization:
Each cell represents a specific hour of a specific day (e.g., Monday at 2:00 PM). The cell color ranges from light (low volume) to dark/vibrant (high volume).
Interactive Filters:
Database: Switch between your configured databases to compare load across PROD, TEST, or DEV.
Lookback Window: Select the historical date range to include in the calculation (e.g., Last 7 Days, Last 30 Days, or Last 90 Days).
Process Type / Name: Filter the heatmap to specific process types (e.g., Application Engines, SQR Reports) or individual process definitions to see when a specific job runs most frequently.
Hourly Breakdown:
Hovering over any cell reveals the exact number of processes that started, ran, or completed within that specific hour.
Use Cases
Batch Window Planning:
When scheduling a new, resource-intensive batch process, use the heatmap to find the quietest hours (lightest cells) to avoid system slowdowns or resource conflicts.
Peak Utilization Audit:
Identify when the Process Scheduler experiences maximum concurrency. If the grid is consistently dark during specific hours, it may explain CPU spikes or queue delays.
Scheduler Drift and Efficiency:
Check whether the overnight job actually ran overnight, or slipped into the workday.
5.2 - Process Monitor
The Process Monitor shows process requests that have run or are currently running.
Process Monitor
URL:/processmonitor
The Process Monitor shows process requests that have run or are currently running. This is the main operational view for the Process Scheduler — open it to see what is running, queued, or recently failed.
Process Monitor with search filters, timeline visualization, statistics, and process request details
What You Can Do
View Active and Queued Jobs: See running process requests (Initiated and Processing status) and queued or recently completed requests.
Filter and Search: Filter by process name, user, status, date range, and start delay threshold.
Monitor Start Delays and Queue Lag: View start delays (the difference between scheduled and actual begin times) highlighted directly in the results table. Filter the view to only show delayed processes, view aggregate start delay statistics, and see queue wait times plotted visually as warning-colored bars preceding process execution on the timeline.
Drill Into Details: Click a process instance to see its full details: status, run dates, server, output, and log information.
Timeline visualization with color-coded execution bars, date range statistics, top processes, and top operators
Process request results with clickable links to process instances, definitions, operators, and recurrences
When It’s Useful
Checking whether a scheduled process ran successfully.
Investigating a process failure (the detail view shows status codes and timing).
Seeing what is currently running on a server.
Responding to a Long-Running Processes alert from the dashboard.
Process Status Reference
Status
Meaning
Queued
Waiting to be picked up by a Process Scheduler server
Initiated
Server has picked up the request and is starting the process
Processing
Process is actively running
Success
Process completed successfully
Error
Process ended with an error condition
Not Successful
Process ran but reported a non-success result
Unable to Post
Output could not be delivered
Cancelled
Process was cancelled before it completed
Alerts for Process Scheduler
Two alert types monitor the Process Scheduler automatically:
Long-Running Processes — Flags processes that have been running longer than the configured threshold.
Process Errors — Finds processes that have failed within the lookback window.
When these alerts fire, the dashboard shows them with direct links to the relevant Process Monitor entries.
5.3 - IB Monitor
The IB Monitor shows the real-time status of PeopleSoft Integration Broker message traffic.
IB Monitor
URL:/ibmonitor
The IB Monitor shows the real-time status of PeopleSoft Integration Broker message traffic. Open it when an integration is failing or messages aren’t moving.
Integration Broker Monitor with status filters, time range selection, and operation/contract tabs
Browse and audit PeopleSoft security configuration: permission lists, roles, and users.
Security
psLens browses PeopleSoft security read-only: permission lists, roles, and users. Use it to audit access without writing SQL against PSOPRDEFN, PSROLEUSER, and PSAUTHITEM. Changes still have to be made in PeopleSoft.
Permission Lists — The granular access settings that define menu, component, and page authorizations.
Roles — Collections of permission lists assigned to users.
Users — User/operator accounts and their associated roles.
How Security Objects Relate
PeopleSoft security flows in one direction:
User → Roles → Permission Lists → Menus/Components/Functions
When investigating access, work from the bottom up:
Start with the permission list that grants the specific access you’re concerned about.
Find which roles include that permission list.
Find which users have those roles.
Or work from the top down:
Find the user whose access you want to understand.
Look at their roles.
Drill into each role to see its permission lists.
User detail pages link out to each role. Role pages link to permission lists and back to assigned users. You can follow an access chain in three clicks without writing a join.
Permission List detail view with properties, menu authorizations, and related data options
6.1 - Permission Lists
Permission lists (PSCLASSDEFN, sometimes called classes) are the lowest-level grantable security object.
Permission Lists
URL:/permissionlists
Permission lists (PSCLASSDEFN, sometimes called classes) are the lowest-level grantable security object. Every menu, component, page, and function authorization attaches to one.
Walkthrough: Exploring Permission Lists in psLens
Permission list detail page with the core definition and the access relationships needed for audit work
What You Can Do
View Full Definitions: See description, last modified information, and general settings.
View Authorizations: See which menus and components the permission list authorizes.
View Assigned Roles: See which roles include this permission list.
Sign-on Settings: View allowed sign-on times and other access constraints.
When It’s Useful
Auditing what access a particular permission list grants before assigning it.
Incident response: what could a compromised permission list have touched.
Roles (PSROLEDEFN) are named bundles of permission lists. Users get roles, not permission lists directly.
Roles
URL:/roles
Roles (PSROLEDEFN) are named bundles of permission lists. Users get roles, not permission lists directly.
Walkthrough: Exploring Roles in psLens
Role detail page with the permission lists, users, and aggregate access needed to understand what the role actually grants
What You Can Do
View Included Permission Lists: See the list of permission lists assigned to the role.
View Assigned Users: See which users are assigned this role.
View Authorizations: See the aggregated Tools Access, Service Operations, Component Interfaces, Component & Page Access, Query Tree Tables, and Web Libraries granted by the permission lists assigned to the role.
Metadata Inspection: See the role’s description and last modified information.
When It’s Useful
Understanding what an unfamiliar role grants.
Checking whether a role contains permission lists that are unexpectedly broad.
Finding all users who have a particular role.
6.3 - Users
Users (PSOPRDEFN, historically called operators) are login accounts.
Users
URL:/users
Users (PSOPRDEFN, historically called operators) are login accounts. Each carries a set of roles, a primary permission list, a row-security permission list, and a process profile. Search supports both OPRID and name.
User detail page with the roles, permission lists, account metadata, and recurring jobs needed to review a user’s effective access
What You Can Do
View Assigned Roles: See the roles assigned to a user.
Core Security Attributes: See primary permission list, row security permission list, and process profile.
Account Metadata: View account status (active/inactive), last login, and email address.
Password Settings: See password-related settings (whether a password is set, when it expires).
Recurring Jobs: Check which unique batch processes the user has run on a recurrence schedule.
When It’s Useful
Checking what access a specific user has.
Reviewing user accounts during security audits.
Finding accounts that are inactive but still have broad role assignments.
Investigating who has access to a sensitive area of the system.
7 - Objects
Search and explore PeopleSoft metadata objects: fields, records, pages, components, queries, Integration Broker nodes, batch processes, and more.
Objects
psLens lets you search and explore the core PeopleSoft metadata objects that define how the application is built. Every object type has the same two-step flow: a search page where you find what you’re looking for, and a detail page that consolidates everything psLens knows about that object across the database.
Useful when you need to look up an object without firing up App Designer.
Searching for records by name with results displayed as cards
Search and Navigation
How Search Works
All metadata pages share the same search behavior:
Type at least a partial name in the search box.
Results appear automatically after a short pause (no need to press Enter).
Results are paginated — scroll down to load more.
Click any result card to open the detail view.
Search auto-matches as starts with — typing PS finds PSCLASSDEFN, PSMENUITEM, and so on. For more control, include % yourself: %SECURITY (ends with), %PERS% (contains), or just % to list every row. The per-object pages below note when a specific search box uses different behavior (for example, SQL Object search runs against the SQL text body, not just the name).
Cross-Object Navigation
The detail page for each object type follows a consistent layout: main properties on the left, and a right-side Related Data sidebar with toggles that fetch additional information on demand. Toggling a panel ON fires a request, and the result loads inline. Each toggle runs a single query against the underlying tables (PSPRSMDEFN ancestors, PSPCMPROG references, etc.) and renders the result in place. The pattern is the same across every object type.
Where it makes sense, every linked reference (a record name, a field name, a component, a project) is clickable and navigates to that object’s own detail page, so you can chase a question across the application metadata in a few clicks.
Exporting Object Definitions
Every PeopleSoft object detail page in psLens supports exporting its full definition as a Markdown file. Look for the Export as Markdown card on the detail page. This is useful for documentation, code reviews, or sharing object details outside of psLens — and the structured Markdown format is ideal as input to AI tools like ChatGPT or Claude.
The export preserves object structure, related data, and code in a format that works in docs, code review, and AI workflows
Each detail page consolidates the object definition, related data, and export path in one browser view
Deep Links to PIA
Every detail page surfaces a link out to the corresponding App Designer or PIA navigation in PeopleSoft, so you can jump from a psLens view straight into the live environment when you need to make a change.
See Metadata Browsing Live
The object docs show the surface area. A live walkthrough is where the value becomes obvious: how quickly a user can move from a name search to the exact record, page, component, service, or process definition they need.
Browse and inspect App Designer project definitions (PSPROJECTDEFN) and their constituent metadata items.
Tailored Operational Context
Target Database:—
Context Type:—
Alert Severity:—
Triggered Time:—
Firing Context:—
What It Is
Projects are PeopleSoft’s primary mechanism for grouping metadata objects together for migration between environments (e.g., from Development to Testing to Production). Every project definition is stored in PSPROJECTDEFN, and the items contained within a project are registered in PSPROJECTITEM.
psLens allows you to search and inspect project definitions directly, showing you the exact list of objects included in a project and letting you compare project items across different database environments.
Search Page
URL: /projects?db={database}
The Project Search page lets you locate projects by name (using a prefix match).
Basic Search: Type a partial name (e.g., HR or PT) to search. Search matches as starts with. You can use the % wildcard for more complex queries: %UPGRADE% finds any project containing “UPGRADE”, or % alone lists all projects.
Advanced Filters:
Operator ID: Filter projects last updated by a specific operator (user).
Customized Only: Filter to show only projects marked as customized.
Date Range: Filter projects based on their last updated date.
Detail Page
URL: /projects/{PROJECTNAME}?db={database}
Project detail for CHG_LENS_DEMO_WONKY: properties and item list
The Project Detail page shows:
Project Properties: Shows metadata about the project itself, such as the description, version, object owner, release, release label, update flags, and the user who last updated it.
Project Items: Displays a paginated list of all objects contained within the project, grouped and sorted by object type (e.g., Records, Fields, Pages, Components, PeopleCode).
Flagging non-standard project items
Migration & Health Flags: psLens automatically flags non-standard project items in red (as shown above). This highlights things that can cause issues with migrations, such as upgrade flags and actions (e.g., Delete actions or items with Take set to No). This gives you a quick check on the state of your project before migrating.
Compare to Database: If you have multiple databases configured in psLens, you can select another database from the card on the page to run a project comparison.
Export as Markdown: Export the entire project definition and its items list to a markdown file, which is ideal for change logs, migration documentation, or code reviews.
7.2 - Project Import
Import and compare PeopleSoft XML project files against the target database to review object states and perform PeopleCode/SQL diffs.
Tailored Operational Context
Target Database:—
Context Type:—
Alert Severity:—
Triggered Time:—
Firing Context:—
What It Is
Project Import lets you upload an XML export file of a PeopleSoft project (the .xml files exported from App Designer via Tools -> Copy Project -> To File).
This lets you inspect the contents of a project file (including embedded PeopleCode, SQL, and HTML definitions) and compare it against any of the configured databases before actually migrating or importing the project into the environment.
Uploading a Project XML
URL: /project-import
To import a project:
Go to the Project Import page.
Click the file upload box or drag-and-drop your PeopleSoft project XML file (up to 25MB).
The server will parse the XML and add the project to your local imports history list.
Project XML View
Once imported, you are presented with the Project XML View:
Metadata Summary: Shows the source database where the project was exported, export date, export Operator ID, and file stats.
Flat Items List: A single flat table listing every object in the project, categorized by type (Record, Field, Component, etc.).
Source Code View: Items that contain code (PeopleCode, SQL, or HTML) are marked with an icon. Clicking on these items will expand them inline to show the source code directly in your browser.
Database Comparison
You can compare the imported XML project against any of your active databases:
Select the target database from the dropdown in the comparison card.
Click Compare.
psLens runs a comparison check for each object:
PeopleCode: Performed via content hashing (ignoring line endings and trailing whitespace) to determine if the code is identical or different, since timestamps are often unreliable across migrations.
Other Objects: Performed via the LASTUPDDTTM timestamp on the target database table.
Compare Statuses
Same: The object in the XML file is identical to the one in the target database.
Different: The code contents differ between the XML and the database.
DB Newer: The object in the database has a newer timestamp than the one in the XML.
DB Older: The object in the database has an older timestamp than the one in the XML.
Not in DB: The object does not exist in the target database.
No DB Lookup: The object type is not supported for automatic database comparison.
7.3 - Fields
Browse PeopleSoft field definitions with cross-references to records, pages, PeopleCode, component interfaces, queries, and projects.
Tailored Operational Context
Target Database:—
Context Type:—
Alert Severity:—
Triggered Time:—
Firing Context:—
What It Is
Fields are the atomic units of a PeopleSoft application. Every column on every page and every row in every table is built on top of a field definition. psLens reads field definitions from PSDBFIELD (and field labels from PSDBFLDLABL) and stitches them together with the rest of the metadata so you can see, in one place, everywhere a given field is used.
Search Page
URL: /fields?db={database}
Field search results for OPR%
Type a partial field name to find matching definitions. Search auto-matches as starts with — EMPLID finds EMPLID, EMPLID_TBL, EMPLID_PNL, etc. Include % yourself for more control: %NAME (ends with), %DESCR% (contains), or just % to list every row. Each result card shows the field type and length, the long-name description, and the last-updated timestamp so you can spot recently modified objects at a glance. The Advanced Filters panel lets you narrow by field type, last-updated date, or owner. Recently viewed fields are surfaced just above the results.
Detail Page
URL: /fields/{FIELDNAME}?db={database}
Field detail page for OPRID — default view, no panels expanded
The main pane shows the Field Properties card (type, length, format, description, object owner, last-updated metadata) and a Field Labels card with every long/short name pair defined in PSDBFLDLABL, including which one is the default label. The Export button in the top right downloads the full definition as Markdown. The Related Data sidebar holds six toggles that fetch additional context on demand.
Related Data Panels
Toggle any panel on to load it inline beneath the main content. Each panel returns the count of objects found and a sortable list with deep-links into the corresponding psLens detail pages, so you can chase a field reference into the record, page, or PeopleCode program that uses it without losing your place.
Records
Every record that includes this field, with type (Table/View) and Edit Table indicator
Lists every record where the field appears, with record type, the position number within the record, key-field indicator, and whether the field is configured with an Edit Table prompt. Sourced from PSRECFIELD / PSRECFIELDDB.
Included in Projects
App Designer projects that include this field
Shows every App Designer project (PSPROJECTITEM) that contains this field as a project item. Useful for tracing which customization or release introduced or modified the field.
PeopleCode References
PeopleCode programs that reference this field
Lists PeopleCode programs that mention the field: record PeopleCode, component PeopleCode, application package methods, and more. Each result links to the parent object’s detail page so you can drill into the program.
Pages
Pages with field controls bound to this field
Lists pages (PSPNLFIELD) where a control on the page is bound to this field, with the record context. Useful for impact analysis when changing a field’s type or length.
Component Interfaces
Component Interfaces that expose this field as a property
Lists Component Interfaces that expose this field as a CI property. The integration surface area for the field. Sourced from PSBCITEM.
Queries
PeopleSoft Queries that reference this field
Lists PeopleSoft Queries (PSQRYFIELD) that reference this field in a SELECT, WHERE, or ORDER BY. Useful for security and audit work: “who has reports built on this column?”
What This Consolidates
In App Designer, assembling this same picture requires:
Open the field in App Designer for properties and labels
Right-click → Find Object References for record usage
Run a separate Find In search across all PeopleCode for code references
Manually run SQL against PSPNLFIELD and PSBCITEM to find page and CI usage
Open Query Manager and run cross-database searches for query references
Open each containing App Designer project one at a time to confirm migration history
psLens collapses all of that into a single page with one toggle per question.
7.4 - Records
Browse PeopleSoft record (table) definitions with fields, indexes, related pages, components, PeopleCode, and live data preview.
Tailored Operational Context
Target Database:—
Context Type:—
Alert Severity:—
Triggered Time:—
Firing Context:—
What It Is
Records are PeopleSoft’s table/view definitions — every database table, SQL view, derived/work record, and dynamic view is registered in PSRECDEFN. psLens reads the record definition plus its field list from PSRECFIELD and stitches it together with everywhere the record is referenced in pages, components, PeopleCode, queries, projects, and trees. The Records page has 11 related-data panels (more than any other object type) covering pages, components, PeopleCode, queries, trees, prompt-table back-references, AE statements, project membership, and a live row sample.
Search Page
URL: /records?db={database}
Record search results for PSREC% — note the record type pill (Table/View) and field count on each card
Search auto-matches as starts with — typing JOB finds JOB, JOB_DATA, JOBCODE, etc. For more control, include % yourself: %DATA (ends with), %PERS% (contains), or just % to list every row. Each card shows record type, field count, the descriptive long name, and last-updated metadata. The Advanced Filters panel lets you filter by record type (Table, View, Derived/Work, Subrecord, Dynamic View, Query View, Temp Table), object owner, and last-updated date.
Detail Page
URL: /records/{RECNAME}?db={database}
Record detail page for PSRECDEFN — default view with properties, field list, and the Related Data sidebar
The main pane shows Record Properties (type, owner, audit options, system table flag, description, audit timestamps) and a full Record Fields table with each field’s type, length, key indicators, default value, and Edit Table prompt — every detail you’d otherwise open App Designer to confirm. The Export button downloads the full record definition as Markdown. The Related Data sidebar holds 11 toggles — the broadest set of any object type — covering every place this record is referenced.
Related Data Panels
Pages Using This Record
Pages that bind a control to this record
Lists pages with controls bound to this record (PSPNLFIELD join on RECNAME). Useful for impact analysis when changing the record schema.
Components Using This Record
Components whose pages reference this record
Lists every component containing a page bound to this record — gives you the user-facing transactions affected by the record.
PeopleCode Events
Record PeopleCode events defined on this record
Lists record-level PeopleCode events (FieldChange, RowInit, SaveEdit, etc.) attached to fields of this record. Sourced from PSPCMPROG.
Included in Projects
App Designer projects that include this record
Lists App Designer projects (PSPROJECTITEM) that include this record — useful for migration history and change tracking.
Used in App Engines
Application Engine programs that reference this record
Lists Application Engine programs whose SQL or PeopleCode steps reference this record. Sourced from PSAESTMTDEFN text scans.
Component Interfaces Using This Record
CIs whose underlying component is built on a page that uses this record
Lists Component Interfaces whose underlying component contains a page bound to this record — the integration surface area.
Record Data
Live sample data from the record itself
Pulls a live sample of rows from the record using the psoftQL API — first ~10 rows with every column. Lets you see what the data actually looks like without opening App Designer’s Run-In-Query or a separate SQL client.
PeopleCode References
Any PeopleCode program that mentions this record by name
Broader than “Events” — finds any PeopleCode anywhere in the database that mentions this record by name (component, page, app package, app engine, message, signon, FieldFormula, etc.).
Queries Using This Record
PeopleSoft Queries that include this record
Lists PeopleSoft Queries (PSQRYRECORD) that include this record in a FROM clause. Critical for audit work — “who is reporting from this table?”
Query Trees Using This Record
Query Tree nodes that expose this record to query authors
Lists Query Tree nodes (PSTREENODE) where this record appears — determines which query authors can build queries against it.
Used as Prompt Table
Other records whose fields use this record as an Edit/Prompt table
Lists fields on other records that point to this record as their Edit Table / Prompt Table — shows the lookup relationships that hang off this record.
What This Consolidates
A complete impact assessment for a record change in App Designer requires:
Open the record in App Designer for properties, fields, and PeopleCode events
Right-click → Find Object References to find pages using it
Walk every found page to find its component
Run a separate Find In across PeopleCode for code references
Query PSAESTMTDEFN, PSQRYRECORD, PSTREENODE manually to find AE, query, and tree usage
Run SQL against PSDBFIELD joined to PSRECFIELD to find prompt-table usages
Open every owning project to see migration history
Open the database with SQL Developer / Toad to sample actual data
psLens shows all of that on one page, including a live row sample from the record.
7.5 - SQL Objects
Browse PeopleSoft SQL Object definitions — views, synonyms, and indexes — with source SQL and project membership.
Tailored Operational Context
Target Database:—
Context Type:—
Alert Severity:—
Triggered Time:—
Firing Context:—
What It Is
SQL Objects are the PeopleSoft application’s standalone SQL artifacts — view definitions and other named SQL fragments stored in PSSQLDEFN / PSSQLTEXTDEFN. Unlike a record’s automatically-generated DDL, these are SQL bodies the developer hand-wrote and PeopleSoft keeps versioned with the rest of the metadata. psLens pulls the source SQL plus the related record (when the SQL object is a view tied to a record definition) so you don’t switch into App Designer to read the SQL.
Search Page
URL: /sqlobjects?db={database}
SQL Object search results for PT%
Search auto-matches as starts with. Typing PT finds every SQL object whose ID begins with PT. Include % yourself for ends-with (%VW) or contains (%AUDIT%) patterns, or use % alone to list every row. Each result shows the object name, type, and last-updated info, useful when you’re tracing where a view body is defined or hunting for a delivered SQL fragment.
Detail Page
URL: /sqlobjects/{NAME}?db={database}
SQL Object detail page for PTACESRCHDVW
The main pane shows the object’s properties and the full Source SQL body, syntax-highlighted and copyable, so you can see what the view SELECTs without an App Designer round-trip. The sidebar has two related-data toggles.
All panels expanded: Source Record and Project membership
Related Data Panels
Source Record
Direct link into the matching record detail page
When the SQL object is the body of a view-type record, this panel links into the parent record’s detail page so you can see the field list and the rest of the record metadata in one click.
Included in Projects
App Designer projects that include this SQL object
Lists projects that contain this SQL object as a project item. Useful for tracing migration history of view DDL changes.
What This Consolidates
To see the same thing in App Designer:
Open Application Designer
Select File → Open → SQL and load the object
Read the SQL in the App Designer editor
Right-click to find which record it backs (if any)
Open every owning project separately to see migration history
psLens shows the source SQL inline in the browser, with one-click navigation into the related record. Same view DDL, viewable without App Designer.
7.6 - Pages
Browse PeopleSoft page definitions with field controls, source records, subpages, components, and PeopleCode.
Tailored Operational Context
Target Database:—
Context Type:—
Alert Severity:—
Triggered Time:—
Firing Context:—
What It Is
Pages are the visual screens users interact with in PeopleSoft: the panel definitions from PSPNLDEFN and the per-control bindings from PSPNLFIELD. psLens shows the full control list (every field, label, group box, and subpage on the page), the underlying records each control reads from, and the rest of the metadata graph hanging off the page: which components include it, which PeopleCode is attached, which projects contain it.
Search Page
URL: /pages?db={database}
Page search results for USER_%
Wildcard % search supported. Each result card shows the page type (Standard Page, Subpage, Secondary Page, or Search Record) so you can spot reusable subpages versus standalone screens at a glance. The Advanced Filters panel lets you exclude subpages or limit to standard pages only.
Detail Page
URL: /pages/{PAGENAME}?db={database}
Page detail for USERPROFILEPAGE — default view
The main pane shows Page Properties (type, size, style, audit metadata) and the full Page Fields/Controls table with each control’s record/field binding, label, occurs level, and field type. The sidebar has 6 related-data toggles.
All panels expanded on a Secondary Page
Related Data Panels
Page Fields/Controls
Every control on the page with its field, record, and label
The control inventory: every field control on the page with its PSPNLFIELD row attributes. Each record/field reference deep-links into the matching psLens detail page.
Records Used on Page
Distinct records referenced by any control on the page
The de-duplicated list of records this page reads from. Clicking a record opens its detail page so you can confirm the schema, sample data, or check what else uses it.
Subpages Included
Subpages embedded inside this page
Lists every subpage embedded inside this page. Useful when a control’s data seems to come from somewhere “magic” (it’s almost always a subpage doing the work).
Components Using Page
Components whose item list includes this page
Lists the components that include this page. Answers “which transactions show this screen to a user?”
PeopleCode
Page-level PeopleCode (Activate event) attached to this page
Page Activate PeopleCode. The only event type that lives directly on a page object.
Included in Projects
App Designer projects that include this page
App Designer projects containing this page as a project item.
What This Consolidates
Without psLens, building this view from App Designer requires:
Open the page in App Designer to see properties and controls
For each control, double-click to see its record/field binding
Run a separate query against PSPNLGROUP to find containing components
Open each component to confirm the page’s position in the navigation
Check Activate PeopleCode tab in the page editor for code
Walk every owning project for migration history
psLens collapses that into one view with everything one click away.
7.7 - Components
Browse PeopleSoft component definitions with pages, menus, portal paths, CIs, records, and PeopleCode in one view.
Tailored Operational Context
Target Database:—
Context Type:—
Alert Severity:—
Triggered Time:—
Firing Context:—
What It Is
Components (called panel groups in older PeopleTools versions) are the user-facing transactions of a PeopleSoft application: a search page plus an ordered set of detail pages that share a single save action. psLens reads PSPNLGROUP / PSPNLGRPDEFN and links the component up to its menus, portal navigation paths, exposing component interfaces, the underlying record hierarchy, and the full PeopleCode event tree.
Search Page
URL: /components?db={database}
Component search results for USER%
Wildcard % search supported. Each result card shows the component market and use type (Classic, Fluid, Both). The Advanced Filters panel filters by market or component type.
Detail Page
URL: /components/{COMPONENT}?db={database}
Component detail page for USERMAINT
The main pane shows Component Properties (market, search record, add search record, item description, add/update modes, search PeopleCode flags) and the Component Item List with every page in the component, its labeling, and the hide/display-only flags. The sidebar has 7 related-data toggles.
Related Data Panels
Pages in Component
The ordered list of pages that make up this component
The page list with each page deep-linked into its own detail page.
Menus Using Component
Classic menus that link to this component
Every classic menu (PSMENUITEM) that contains a navigation entry for this component. Important for security work since menu/component pairs drive Permission List authorizations.
Portal Navigation Paths
Every breadcrumb path that leads a user to this component in the portal registry
The full set of portal registry paths (PSPRSMDEFN ancestor walk) that lead a user to this component. Useful for “where is this transaction in the menu?” questions.
Component Interfaces
Component Interfaces that expose this component as an integration surface
The CIs (PSBCDEFN) that wrap this component as an integration surface. If you have CIs here, programmatic access exists.
Record Level Hierarchy
The component’s scroll/record hierarchy across its pages
The scroll/record hierarchy across the pages. Shows the parent-child relationships of records as the component sees them at runtime.
PeopleCode
Component-level PeopleCode events
Component-level PeopleCode events (SearchInit, SearchSave, PreBuild, PostBuild, SavePreChange, SavePostChange, Workflow, etc.) and Component Record/Component Record Field PeopleCode.
Included in Projects
App Designer projects that include this component
App Designer projects containing this component as a project item.
What This Consolidates
In App Designer / PIA, building this view requires:
Open the component in App Designer for properties and item list
Walk each page tab to confirm record bindings
Run Find In Menus to find classic menu links
Use the Portal Registry browser to find every CREF tied to the component
Search for CIs whose component property matches this name
Open PeopleCode for each event type one tab at a time
Open each owning project for migration history
psLens collapses all of that into one page.
7.8 - Component Interfaces
Browse PeopleSoft Component Interface definitions with items, methods, PeopleCode, and consistency checks.
Tailored Operational Context
Target Database:—
Context Type:—
Alert Severity:—
Triggered Time:—
Firing Context:—
What It Is
Component Interfaces (CIs) are PeopleSoft’s programmatic façade over a component. They expose component properties as get/set properties and component events as callable methods, so integration code can drive the same business logic the UI uses. psLens reads PSBCDEFN for the CI header, PSBCITEM for the property/key list, and PSBCMETHODS for the methods. It also runs two consistency checks against the underlying component to catch the most common breakage: properties that no longer map to a valid record field, and required fields the CI doesn’t expose.
Search Page
URL: /componentinterfaces?db={database}
Component Interface search results for USER%
Wildcard % search supported. Each result card shows the underlying component and CI description.
Detail Page
URL: /componentinterfaces/{CINAME}?db={database}
Component Interface detail page for USER_PROFILE
The main pane shows Component Interface Properties (underlying component, market, security access, owner) plus the items list. The sidebar has 6 related-data toggles, including two consistency-check panels unique to CIs.
Related Data Panels
Items
Every CI property with key flag, record/field binding, and standard/custom indicator
Every CI property (PSBCITEM): its record/field binding, key indicator, and whether it’s a standard or custom-named property.
CI Methods
Standard and user-defined methods on the CI
Standard methods (Get, Find, Create, Save, Cancel) plus any user-defined methods. Each method links into the matching PeopleCode.
Invalid Properties Check
Items that no longer match a valid record field on the underlying component
A consistency check. Flags CI items that no longer match a valid record field on the underlying component — the most common failure mode after a record schema change.
Missing Fields
Required fields on the underlying component that the CI does not expose
A consistency check. Flags fields on the underlying component that are required (key fields, search keys, required-input fields) but are not exposed as CI properties. Helps spot where a CI cannot drive a transaction to completion.
PeopleCode References
PeopleCode programs anywhere in the database that instantiate this CI
PeopleCode programs anywhere in the database that mention this CI by name. Useful for finding the App Engine, Service Operation handler, or other CI program that drives this interface.
Included in Projects
App Designer projects that include this CI
App Designer projects that include this CI.
What This Consolidates
To do the same work in App Designer:
Open the CI to see the property list and methods
Open the underlying component separately to confirm record/field bindings
Manually compare CI items against record fields to find drift
Run Find In PeopleCode to find code that calls this CI
Open each owning project for migration history
The Invalid Properties panel finds CI items whose record/field binding no longer exists on the underlying component. Missing Fields finds required component fields the CI doesn’t expose — a CI cannot drive a transaction to completion without them. Both are the diff between the CI snapshot and the live component, a check App Designer makes you do by hand.
7.9 - Menus
Browse PeopleSoft classic menu definitions with bars, items, and the components they navigate to.
Tailored Operational Context
Target Database:—
Context Type:—
Alert Severity:—
Triggered Time:—
Firing Context:—
What It Is
Menus are PeopleSoft’s classic navigation containers. Each menu (PSMENUDEFN) holds a set of bars, each bar a set of items (PSMENUITEM), and each item points to a component the user can launch. Even in a Fluid-dominant world, classic menus matter for security: Permission List authorizations are granted on menu/component pairs, so understanding which menu owns a component is fundamental to access analysis.
Search Page
URL: /menus?db={database}
Menu search results for PROCESS%
Wildcard % search supported. Each card shows the menu type (Standard or Pop-up) and the descriptive long name.
Detail Page
URL: /menus/{MENUNAME}?db={database}
Menu detail page for PROCESSMONITOR
The main pane shows Menu Properties (type, owner, audit metadata). The sidebar has 2 related-data toggles.
All panels expanded — short page since menus are simple structures
Related Data Panels
Menu Items
Every bar and item in the menu with the target component
Every bar and item in the menu, with the component (and market) each item launches. Each component is deep-linked into its own psLens detail page, letting you walk straight from a menu entry into the transaction it triggers.
Included in Projects
App Designer projects that include this menu
App Designer projects that include this menu.
What This Consolidates
In App Designer:
Open the menu to see bars and items
Double-click each item to confirm the target component
Right-click items individually to drill into the component
In psLens, the menu detail page shows the full item list with the component each item launches. Clicking the component name jumps you into a view that already has the menu reference loaded.
7.10 - Content References
Browse PeopleSoft Portal Registry Content References (CREFs) with navigation paths, attributes, and permission lists.
Tailored Operational Context
Target Database:—
Context Type:—
Alert Severity:—
Triggered Time:—
Firing Context:—
What It Is
Content References (CREFs) are entries in the PeopleSoft Portal Registry — the data structure that drives the menu tree, breadcrumbs, and navigation collections users see in PIA. Each CREF is identified by a portal/object name pair stored in PSPRSMDEFN and can be either a folder (a navigation container) or a content reference (a launchable target, usually a component, but also iScripts, external URLs, and homepage pagelets). psLens shows the CREF’s URI target, the full ancestor walk back to the portal root, every system and custom attribute, and the permission lists that have been granted access.
Search Page
URL: /crefs?db={database}
CREF search results for %USER%
Search by CREF name or label, with optional filters for portal (EMPLOYEE, CUSTOMER, MOBILE, etc.) and type (CREF vs Folder). Each result card shows the portal, the parent folder path, and the target object name.
Detail Page
URL: /crefs/{PORTAL}/{OBJECTNAME}?db={database}
CREF detail page for EOPP_USER_PREFS_GBL
The main pane shows Properties (portal, parent folder, type, security author, label, description) and the URI / Target card with the destination URL. For component CREFs this is the menu/component path; for iScripts, the iScript URL; for external CREFs, the literal URL. The sidebar has 4 related-data toggles.
All panels expanded — under 2100px tall
Related Data Panels
Navigation Path
The breadcrumb walk from the portal root down to this CREF
The full ancestor chain from the portal root down to this CREF. Every folder in the navigation path is clickable so you can hop up the tree to a parent folder.
Custom Attributes
Per-CREF custom attribute name/value pairs from PSPRSMATTRVAL
Per-CREF custom attribute name/value pairs from PSPRSMATTRVAL. Used by Fluid navigation collections, search categories, badges, and other portal features.
System Attributes
System attributes from PSPRSMSYSATTRVL with friendly labels
System attributes from PSPRSMSYSATTRVL with friendly labels (e.g., PORTAL_LABEL, PORTAL_OBJTYPE_DESC, PTPP_* personalization keys). These configure how the CREF behaves at runtime.
Permissions
Permission lists with grant access to this CREF
Permission lists (PSPRSMPERM) that have been granted access to this CREF — the security side of “who can see this in the menu?”.
What This Consolidates
In PIA, building the same picture means:
Open PeopleTools → Portal → Structure & Content and walk down the folder tree
Click into the CREF to see properties
Tab to Content Ref Administration for attribute values
Tab to Permission List for security grants
Click “Edit” on the parent folder repeatedly to climb the breadcrumb tree
psLens shows the entire portal entry (target, attributes, navigation path, security) on one page. Cuts the PIA tab-walk for the security question “who can see this menu item?” — psLens shows the ancestor permission chain in one view.
7.11 - Message Catalogs
Browse PeopleSoft Message Catalog entries — message set/number pairs with text, severity, and usage analysis.
Tailored Operational Context
Target Database:—
Context Type:—
Alert Severity:—
Triggered Time:—
Firing Context:—
What It Is
The Message Catalog is PeopleSoft’s centralized store of user-facing text. Every MsgGet() call, error dialog, warning, and translated label resolves to a message set + message number pair stored in PSMSGCATDEFN. psLens lets you browse messages by set number, jump directly to a specific set/number, or search by message text. Each message gets a dedicated detail page with its severity, text, explanation, and a usage analysis that finds where it is referenced in PeopleCode and SQL.
Search Page
URL: /messagecatalogs?db={database}
Browsing all messages in set 18
The search page has three entry points: enter a Set Number to see every message in the set, enter free text to Search Message Text, or punch in a specific Set/Number pair to jump straight to that message. The page also surfaces the highest set numbers in use (handy for picking the next free set when creating customizations) and the most recently modified messages.
The detail page has no sidebar toggles; everything loads inline. The main pane shows Message Properties (set, number, severity, last-updated), the full Message Text (with %1, %2 substitution markers preserved), and the Description / Explanation body text developers see when investigating a message.
Full message page including usage analysis
Usage Analysis
Where this message is referenced in PeopleCode and SQL
The Usage Analysis card automatically scans every PeopleCode program and SQL object in the database for textual references to this set/number pair: MsgGet(18, 1, ...), MsgGetText(18, 1, ...), SQLExec("...18, 1..."), and so on. Each hit links to the parent object’s detail page. Lets you find every MsgGet / MsgGetText / SQLExec call site for the set/number pair before editing the text.
What This Consolidates
In PIA:
Open PeopleTools → Utilities → Administration → Message Catalog and search by set
Walk pages of messages to find the one you want
Read the message text and explanation
For usage analysis: run a separate Find In across all PeopleCode
In psLens, the Set/Number jump-to-message is one form submit, and usage analysis runs automatically. The recently-modified list also lets you spot customizations made to delivered messages, a common audit question.
7.12 - Application Packages
Browse PeopleSoft Application Package class hierarchies with methods, properties, service operation usage, and PeopleCode references.
Tailored Operational Context
Target Database:—
Context Type:—
Alert Severity:—
Triggered Time:—
Firing Context:—
What It Is
Application Packages are PeopleSoft’s object-oriented PeopleCode container — packages hold sub-packages and classes, classes hold methods and properties. They are the standard way to write reusable PeopleCode in PeopleSoft applications. psLens walks the package tree (PSPACKAGEDEFN, PSPACKAGEITEM, PSPCMPROG) and shows the full class hierarchy plus a reverse index of where the package is used: by service operation handlers, by other PeopleCode, and in which projects.
Search Page
URL: /apppackages?db={database}
App Package search results for PT_PAGE%
Wildcard % search supported. Each result card shows the package name and the top-level class names inside it.
Detail Page
URL: /apppackages/{PACKAGENAME}?db={database}
App Package detail page for PT_PAGE_UTILS
The main pane shows Package Properties (owner, last-updated, source path) and the full Package Structure, a recursive tree of sub-packages and classes with methods, properties, and visibility markers. The sidebar has 3 related-data toggles.
Related Data Panels
Package Structure
The recursive package/class/method tree
The recursive package tree showing every sub-package, class, method, and property. The equivalent of expanding every node in App Designer’s package browser at once. Methods link into their PeopleCode source.
Projects Containing This Package
App Designer projects that include this package
App Designer projects that include this package as a project item.
Service Operations Using This Package
Integration Broker service operation handlers using this package
Integration Broker service operations whose handler is implemented in this package. Lists the IB endpoints that route through this code.
PeopleCode References
PeopleCode programs anywhere in the database that import or instantiate this package
PeopleCode programs anywhere in the database that import or instantiate classes from this package — the impact view before refactoring.
What This Consolidates
In App Designer:
Open the package and expand sub-packages by hand to see the class tree
Open each class to see methods and properties
Run Find In PeopleCode to find import statements referencing the package
Open Integration Broker service operations one at a time to find handler classes
Open each owning project for migration history
psLens shows the package tree fully expanded, every reference call site, and the IB handler usage on one page. Useful when picking up unfamiliar code: package structure, callers, and IB handler usage in one view.
7.13 - URL Definitions
Browse PeopleSoft URL definitions — named URL strings used in PeopleCode, file attachments, and integrations.
Tailored Operational Context
Target Database:—
Context Type:—
Alert Severity:—
Triggered Time:—
Firing Context:—
What It Is
URL definitions are PeopleSoft’s centralized store of named URL strings. Instead of hard-coding https://example.com/... inside PeopleCode, developers define a URL object (PSURLDEFN) and reference it by name with GetURL("MY_URL"). This keeps environment-specific endpoints (file servers, integration partners, image hosts) out of the code. psLens lets you browse the catalog so you can see every URL the application uses in one place.
Search Page
URL: /urls?db={database}
URL search results for PT_%
Wildcard % search supported. Each card shows the URL name plus the resolved URL value so you can scan the catalog at a glance.
Detail Page
URL: /urls/{URLNAME}?db={database}
URL detail page for PTFPCONFIG
The main pane shows URL Properties (the URL itself, description, comments, audit metadata). The sidebar has one related-data toggle.
Full URL detail page with Projects panel expanded
Related Data Panels
Included in Projects
App Designer projects that include this URL definition
App Designer projects that include this URL. Useful for understanding which feature or customization introduced the URL.
What This Consolidates
In App Designer the URL catalog is buried under File → Open → URL Definition. psLens makes it browsable from a normal search page with the resolved URL inline, so you can quickly find every URL that points at the file server when investigating an attachments issue.
7.14 - HTML Definitions
Browse PeopleSoft HTML definitions — HTML, JavaScript, and template fragments used in pages, emails, and reports.
Tailored Operational Context
Target Database:—
Context Type:—
Alert Severity:—
Triggered Time:—
Firing Context:—
What It Is
HTML definitions are PeopleSoft’s catalog of HTML fragments, JavaScript snippets, and template bodies stored in PSCONTDEFN. Anything a page or report needs to embed — a JavaScript helper, an email body template, a custom Fluid grid layout — is normally stored as a named HTML object and pulled into PeopleCode with GetHTMLText(). psLens shows the full content of the definition so you can read what the application is actually injecting at runtime.
Search Page
URL: /htmldefs?db={database}
HTML Definition search results for PT_%
Wildcard % search supported. Each card shows the HTML object’s name and last-updated metadata.
Detail Page
URL: /htmldefs/{NAME}?db={database}
HTML Definition detail page for PTADSDYNGRID_SCRIPT
The main pane shows HTML Definition Properties (description, audit metadata) and the full HTML Content body, syntax-highlighted. The sidebar has one related-data toggle.
Full detail page with the Projects panel expanded
Related Data Panels
Included in Projects
App Designer projects that include this HTML definition
App Designer projects that include this HTML object.
What This Consolidates
In App Designer the HTML catalog requires opening File → Open → HTML and loading each object one at a time. psLens makes the catalog searchable and shows the content inline. Useful when tracing a script tag in rendered page source back to its HTML object.
7.15 - Style Sheets
Browse PeopleSoft style sheet (CSS) definitions with full inline source and project membership.
Tailored Operational Context
Target Database:—
Context Type:—
Alert Severity:—
Triggered Time:—
Firing Context:—
What It Is
Style sheet definitions are PeopleSoft’s stored CSS objects (PSSTYLEDEFN) — the cascading style sheets that drive Classic and Fluid UI rendering. Tools, themes, branding overrides, and per-page substyle sheets all live here. psLens shows the full CSS body so you can read what rules a specific style sheet contributes without extracting it through App Designer or scraping rendered HTML.
Search Page
URL: /styledefs?db={database}
Style Sheet search results for PT_%
Wildcard % search supported. Each card shows the style sheet name and last-updated metadata.
Detail Page
URL: /styledefs/{NAME}?db={database}
Style Sheet detail page for PTAI_ACTIONS_CSS
The main pane shows Style Sheet Definition Properties (description, audit metadata) and the full CSS Content body, syntax-highlighted. The sidebar has one related-data toggle.
Related Data Panels
Included in Projects
App Designer projects that include this style sheet
App Designer projects that include this style sheet.
What This Consolidates
In App Designer the style sheet catalog requires File → Open → Style Sheet and loading each object individually. psLens lets you search the catalog and read CSS inline. Useful for tracing a custom class override on top of a delivered PT_* style sheet.
7.16 - Queries
Browse PeopleSoft Queries with record/field usage, query trees, security access, and ownership.
Tailored Operational Context
Target Database:—
Context Type:—
Alert Severity:—
Triggered Time:—
Firing Context:—
What It Is
Queries are PeopleSoft’s end-user reporting tool — saved SQL queries that users run from the PSQUERY interface, with optional prompts, output formats, and scheduled distribution. Each query is stored in PSQRYDEFN and broken out across PSQRYRECORD, PSQRYFIELD, and other tables for the records and fields it touches. psLens consolidates the query header, the records used, the field list, project membership, and (via the related-data toggles) the query tree placement and security access.
Search Page
URL: /queries?db={database}
Query search results for PT_%
Search auto-matches as starts with. Typing PT_ finds every query whose name begins with PT_. Include % yourself for ends-with (%_VW) or contains (%AUDIT%) patterns, or use % alone to list every row. Each card shows the query type (Public, Private, Archive, User), owner, and last-updated metadata. The Advanced Filters panel lets you filter by query type or owner.
Detail Page
URL: /queries/{QRYNAME}?db={database}
Query detail page for PTCPQFIELD_VW
The main pane shows Query Properties (type, owner, description, last-run metadata, version), Records Used (every record in the FROM list), and Fields (the SELECT and ORDER BY columns). The sidebar has 3 related-data toggles.
Full query detail page with all panels
Related Data Panels
Records Used
Every record in the query’s FROM clause
The list of records used by the query (PSQRYRECORD). Each record name deep-links into its own detail page so you can audit what the query reads.
Fields
The fields the query SELECTs, with record context and order
The SELECT field list (PSQRYFIELD) with record and field references, each link-resolved.
Included in Projects
App Designer projects that include this query
App Designer projects containing this query as a project item.
What This Consolidates
In Query Manager / Query Viewer:
Search by name and open the query in Query Manager
Walk the Records tab to see the joined records
Walk the Fields tab to see SELECT and ORDER BY columns
Tab to Properties for owner and last-run info
Use a separate database query to find query tree placement and permission list access
psLens consolidates the structural view (records, fields, properties) on one page and adds project membership, useful for both audit work (which queries access sensitive tables?) and impact analysis (will deleting this record break any reports?).
7.17 - Query Trees
Browse PeopleSoft Query Access Trees with record hierarchies and the permission lists that grant access.
Tailored Operational Context
Target Database:—
Context Type:—
Alert Severity:—
Triggered Time:—
Firing Context:—
What It Is
Query Access Trees are the security backbone of PeopleSoft Query — hierarchical groupings of records (PSTREEDEFN / PSTREENODE) that determine which records a Query author can build queries against. A permission list grants access to one or more access groups within a tree, and the Query Manager UI only lists records that fall under the granted nodes. psLens shows the tree’s full record hierarchy and the permission lists that authorize it, combining what you’d otherwise need to assemble from Tree Manager and Permission List security separately.
Search Page
URL: /querytrees?db={database}
Query Tree search results
Search auto-matches as starts with. Typing EOQF finds every tree whose name begins with EOQF. Include % yourself for ends-with or contains patterns, or use % alone to list every query tree in the database.
Detail Page
URL: /querytrees/{TREE_NAME}?db={database}
Query Tree detail page for EOQF_QUERY_TREE
The main pane shows Tree Properties (status, version, audit metadata) and the full Tree Hierarchy, a recursive view of every node in the tree with the record name it grants access to. The sidebar has one related-data toggle.
Full Query Tree page with the Permission Lists panel expanded
Related Data Panels
Tree Hierarchy
The full record hierarchy of the tree, with each record linked to its detail page
The recursive node-by-node breakdown of the tree. Each record link jumps into the record’s detail page so you can see what data the tree grants query access to.
Permission Lists
Permission lists with access to nodes in this tree
Permission lists that have been granted access to nodes in this tree.
Roles
Roles that grant access to nodes in the tree, derived from the permission lists associated with each role.
Users
Users who can access the query tree, detailing their status (Active or Locked), role, permission list, and access group grant level. Grants are annotated as Tree-level if they target the root node of the tree, and Node-level for sub-nodes.
What This Consolidates
In PIA / Tree Manager:
Open PeopleTools → Tree Manager and navigate to the tree
Click through the tree nodes one branch at a time to see records
Open the Query Profile for each permission list separately to see which trees and nodes it authorizes
Cross-reference manually to answer “who has Query access to record X”
psLens shows the record hierarchy and the permission lists granting access on one page — the source data for any PS/Query security audit. Pairs with the Queries page’s tree placement panel for the inverse question.
7.18 - Nodes
Browse PeopleSoft Integration Broker nodes — external systems, partner databases, and internal services that exchange IB messages.
Tailored Operational Context
Target Database:—
Context Type:—
Alert Severity:—
Triggered Time:—
Firing Context:—
What It Is
Nodes are the network endpoints of the PeopleSoft Integration Broker. Each external system, partner database, or other PeopleSoft environment that sends or receives messages is represented as a node (PSMSGNODEDEFN). The node carries connection settings (connector type, target URL, authentication mode) and is the unit referenced by every routing rule. psLens shows the node configuration, every routing that involves this node, the service operations granted to its default user, and an inventory of URI text configured against it.
Search Page
URL: /nodes?db={database}
Node search results for PSFT%
Wildcard % search supported. Each card shows the node type (Local, External, Hub), the node’s active flag, the default user ID, and the descriptive name. Enough at a glance to spot inactive nodes or nodes pointing at unexpected user accounts.
Detail Page
URL: /nodes/{NODENAME}?db={database}
Node detail page for PSFT_CS
The main pane shows Node Properties: node type, connector ID, default user, authentication option, password-set indicator, contact, and audit metadata. The password-set indicator is the security view: a node with authentication required but no password set is a flag worth investigating (see the Nodes with No Password report). The sidebar has 4 related-data toggles.
Related Data Panels
Routings
Every routing rule that involves this node (sender or receiver)
Every routing rule (PSIBRTNGDEFN) where this node appears as sender or receiver, with the service operation, direction, and status. Lists the message traffic that flows through this node.
User’s Service Operations
Service operations the node’s default user has permission to invoke
The service operations the node’s default user has been granted permission to invoke. Important for security audits, since a node’s default user can be granted service operations that the human OPRID would never get.
URI Text
URI text entries configured against the node
The URI text entries configured against the node (PSIBNODEURITEXT). The per-node URL fragments used in REST-style integrations.
Included in Projects
App Designer projects that include this node
App Designer projects that include the node definition.
What This Consolidates
In PIA:
Open PeopleTools → Integration Broker → Integration Setup → Nodes to see properties
Click each tab (Connectors, Portal, WS Security, Routings, Properties) one at a time
Search Service Operations → Permissions separately to find which operations the node user can call
Browse Routing Definitions separately to find traffic that involves the node
psLens lets you confirm a node’s security posture and traffic footprint on one page. Useful when reviewing integration configurations or investigating a failing endpoint.
7.19 - Services
Browse PeopleSoft Integration Broker services — logical groupings of related service operations.
Tailored Operational Context
Target Database:—
Context Type:—
Alert Severity:—
Triggered Time:—
Firing Context:—
What It Is
A Service is the high-level container in the Integration Broker hierarchy: a logical grouping of related Service Operations (PSSERVICEDEFN). For example, a STUDENT_ENROLLMENT service might contain GET_ENROLLMENT, ADD_ENROLLMENT, and DROP_ENROLLMENT operations. The service itself carries metadata (description, owner, WSDL namespace) and acts as the access point for browsing operations together.
Search Page
URL: /services?db={database}
Service search results for PT_%
Wildcard % search supported. Each card shows the service name, alias, and description.
Detail Page
URL: /services/{SERVICE}?db={database}
Service detail page for PTCS_SECURITY
The main pane shows Service Properties (name, alias, namespace, owner, description, audit metadata). The sidebar has one related-data toggle.
Full service page with Service Operations panel expanded
Related Data Panels
Service Operations
Every service operation belonging to the service
Every service operation belonging to the service, each link-resolved into its own detail page. The starting point for understanding what messages the service can exchange.
What This Consolidates
In PIA the service is found under PeopleTools → Integration Broker → Integration Setup → Services, and the operations list is one tab on that page. psLens replicates that single-screen view in the browser, with clickable navigation into each operation. Useful as a jumping-off point when investigating a service’s full message footprint.
7.20 - Service Operations
Browse PeopleSoft Integration Broker service operations with versions, handlers, routings, security grants, and IB transaction history.
Tailored Operational Context
Target Database:—
Context Type:—
Alert Severity:—
Triggered Time:—
Firing Context:—
What It Is
A Service Operation is the actual message-exchange contract — the unit that defines what message type is sent, in which direction (async or sync), through which routings, and handled by which PeopleCode. Each operation belongs to a service and is stored in PSOPERATION with related metadata in PSOPRDESC, PSOPRROUTING, PSOPRHANDLER, and the security tables. psLens consolidates the full operation — versions, routings, handlers, caller nodes, security access from three angles, and live IB transaction history — into one page.
Search Page
URL: /serviceoperations?db={database}
Service Operation search results for PT_%
Wildcard % search supported. Each card shows the operation type (Async, Sync, One Way), default version, and active flag.
Detail Page
URL: /serviceoperations/{OPERATION}?db={database}
Service Operation detail page for PTBR_BRANDING_DEFINITIONS
The main pane shows Operation Properties plus four always-visible cards: Versions (every operation version with default flag and message type), Routings (every routing definition with sender/receiver nodes and direction), Handlers (handler PeopleCode and class implementations), and HTTP Request Template (the template body for HTTP-style transactions). The sidebar has 5 related-data toggles, including three security access lenses and a live IB transaction history feed.
Related Data Panels
Permission Lists with Access
Permission lists that grant access to this operation
Permission lists with Full Access or Web Library Access to this operation. The security baseline for which permission lists let a user invoke this operation.
Roles with Access
Roles that contain a permission list granting access to this operation
The roles that contain any of the granting permission lists — saves you from having to walk Permission List → Role mapping manually.
Users with Access
Users whose roles ultimately grant access to this operation
The users whose role membership ultimately grants them access to call this operation, with an optional toggle to include or exclude locked accounts. The end-of-chain answer for who can call this endpoint.
Caller Nodes
Nodes whose default user has access to invoke this operation
Inverts the lens to the integration side: lists nodes whose default user has been granted access to invoke this operation — useful for confirming which external systems can call the endpoint.
IB Transaction History
Recent runtime invocations of the service operation
Recent runtime invocations from PSIBLOGHDR — timestamps, status, transaction ID. The link from “what is configured” to “what is actually happening.” Lets you confirm an operation is being called (or spot that it never is).
What This Consolidates
In PIA, the equivalent investigation requires:
Open PeopleTools → Integration Broker → Integration Setup → Service Operations for properties and version
Switch to the Handlers and Routings tabs separately
Open Security → Permissions & Roles → Permission Lists and search Web Services tab per permission list
Cross-reference Role membership in Roles
Walk User Profile Roles tab to find users
Open Service Operation Monitor → Asynchronous Services to find recent activity
psLens combines configuration, three layers of security access, and live transaction history on one page — the questions a security review asks about every IB endpoint.
7.21 - Messages
Browse PeopleSoft Integration Broker message definitions — the payload schemas referenced by service operations.
Tailored Operational Context
Target Database:—
Context Type:—
Alert Severity:—
Triggered Time:—
Firing Context:—
What It Is
A Message definition is the payload schema that a Service Operation carries. It defines the structure of the XML or JSON document exchanged between systems. Messages can be rowset-based (mapped to PeopleSoft records), nonrowset-based (free-form XML/JSON), container, or document. psLens reads PSMSGDEFN and the version-specific details from PSMSGSCHEMA, then surfaces the service operations that reference each message and the projects that own them.
Search Page
URL: /msgdefns?db={database}
Message search results for PT_%
Wildcard % search supported. Each card shows the message type and version.
Detail Page
URL: /msgdefns/{MESSAGE}?db={database}
Message detail page for PTCS_ACCESSIN
The main pane shows Message Properties (alias, owner, description, audit metadata) and a per-version card listing each message version with its type (Nonrowset-Based, Rowset-Based, Container, Document) and the schema details. The sidebar has 2 related-data toggles.
Full message detail page with both panels expanded
Related Data Panels
Service Operations Using This Message
Service operations that reference this message as request or response payload
Service operations that reference this message as a request or response payload.
Projects Containing This Message
App Designer projects that include this message
App Designer projects containing this message as a project item.
What This Consolidates
In PIA you’d open PeopleTools → Integration Broker → Integration Setup → Messages, switch to the appropriate version, and then separately walk the service operation registry to find references. psLens shows the message and the operations that use it side by side, so you can confirm callers before changing the schema.
7.22 - Queues
Browse PeopleSoft Integration Broker queues — async ordering containers that group related service operations.
Tailored Operational Context
Target Database:—
Context Type:—
Alert Severity:—
Triggered Time:—
Firing Context:—
What It Is
A Queue is an Integration Broker ordering construct. Async service operations attached to the same queue process serially in the order they arrived, while operations on different queues can run in parallel. Queues are also the unit where IB pauses (“Pause” status) when an administrator stops message processing for maintenance. Each queue is stored in PSQUEUEDEFN with a status (Run, Pause) and a partitioning configuration.
Search Page
URL: /queues?db={database}
Queue search results for PT_%
Wildcard % search supported. Each card shows the queue’s run/pause status, the fast way to spot a paused queue causing a stalled integration.
Detail Page
URL: /queues/{QUEUE}?db={database}
Queue detail page for PTAF_APPROVALS
The main pane shows Queue Properties (status, partitioning method, archive flag, owner, description) and a Service Operations Using This Queue card. Queues are simple objects — there are no sidebar toggles.
Full queue detail page
Service Operations Using This Queue
Service operations bound to this queue
The list of service operations bound to this queue. Together with the IB Monitor, this shows what stops processing when the queue is paused.
What This Consolidates
In PIA, queue configuration lives under PeopleTools → Integration Broker → Integration Setup → Queues, and the link to dependent service operations requires walking each operation separately. psLens shows the queue status and its dependent operations on one page.
7.23 - App Engines
Browse PeopleSoft Application Engine program structures, sections, steps, actions, and source code.
Tailored Operational Context
Target Database:—
Context Type:—
Alert Severity:—
Triggered Time:—
Firing Context:—
What It Is
Application Engines (AE) are PeopleSoft’s batch processing framework. Unlike traditional COBOL or SQR programs, Application Engine programs are defined in PeopleSoft metadata tables (such as PSAEAPPLDEFN, PSAESECTDEFN, PSAESTEPDEFN, and PSAESTMTDEFN) and executed by the psae batch executable. They are commonly used for data processing, background calculations, integrations, and ETL processes.
psLens allows you to search and browse the structure of Application Engine programs, inspect their sections, steps, and actions, and view the associated SQL and PeopleCode source code without opening App Designer.
Search Page
URL: /appengines?db={database}
Search: Search for Application Engines by program name (prefix match). Type PSAE to find all AEs starting with PSAE. Use % as a wildcard if needed (e.g., %PRCS% to find programs containing PRCS).
Metadata Card: Each search result card shows the program description, owner ID, and last modified operator/timestamp.
Detail Page
URL: /appengines/{APPLID}?db={database}
The Detail Page exposes the internal structure of the Application Engine program:
Program Properties: Shows description, owner ID, program type (Standard, Upgrade, Import, Daemon), active status, disable restart setting, and modification details.
Sections & Steps Tree: Lists all sections (e.g., MAIN) and steps defined in the program.
Actions View: For each step, psLens shows the actions it executes (SQL, PeopleCode, Call Section, Log Message, XSLT, Do Select, Do Until, Do While, Do When).
Source Code Viewer: Steps that run SQL or PeopleCode actions can be expanded to view the actual code inline.
Export as Markdown: Reconstructs the entire Application Engine structure, including all sections, steps, actions, and embedded code, into a single structured Markdown file.
7.24 - Application Services
Browse PeopleSoft Application Services Framework (ASF) definitions — REST APIs backed by application classes, with their operations, URI templates, parameters, result states, header properties, and security.
Tailored Operational Context
Target Database:—
Context Type:—
Alert Severity:—
Triggered Time:—
Firing Context:—
What It Is
An Application Service is an Application Services Framework (ASF) definition, stored in PSIBAPPLDEFN. It exposes a REST API backed by application classes, without the hand-built service operations that classic Integration Broker requires. psLens consolidates the service’s operations, URI templates and REST methods, method parameters, result-state-to-HTTP-status mappings, header properties, and security grants onto one page.
Search Page
URL: /appservices?db={database}
Wildcard % search supported. Search runs against the ASF definitions in PSIBAPPLDEFN. Each result card links to the application service detail page.
Detail Page
URL: /appservices/{APPLNAME}?db={database}
The main pane shows the service properties and an always-visible Operations & REST Surface card: each operation’s handler application class, plus a table of its URI templates with the REST methods (GET, POST, PUT, DELETE) mapped to each. The sidebar has four related-data toggles.
Related Data Panels
Parameters
Method parameters for the service’s operations, read from PSIBPARAM and the related base/template parameter tables.
Result States
The mapping from operation result states to HTTP status codes (PSIBAPPLSTATES) — what status a caller receives for each outcome.
Header Properties
Header properties configured for the service (PSIBAPPLHDRPROP).
Security
Permission lists that grant access to the application service, read from PSAUTHAS. The answer to which permission lists let a user call this REST API.
What This Consolidates
In PIA, the equivalent investigation requires opening PeopleTools → Integration Broker → Web Services → Application Services, switching between the operation, URI, parameter, and result-state tabs, and then checking the Web Services tab of each permission list under Security → Permissions & Roles → Permission Lists. psLens combines the REST surface and its security grants on one page.
Tables Used
PSIBAPPLDEFN — application service (ASF) definitions
PSIBAPPLSTATES — result-state to HTTP-status mappings
PSIBAPPLHDRPROP — header properties
PSAUTHAS — application service authorization per permission list
PSSERVICEOPR — service operations within the service
7.25 - Process Definitions
Browse PeopleSoft Process Scheduler process definitions with configuration, output options, and execution statistics.
Tailored Operational Context
Target Database:—
Context Type:—
Alert Severity:—
Triggered Time:—
Firing Context:—
What It Is
Process Definitions define the batch programs, reports, and scripts that can be executed via the PeopleSoft Process Scheduler. They map a logical process name to an underlying program type (SQR, Application Engine, COBOL, Crystal, XML Publisher, etc.) and define how it executes, its parameters, and where its outputs are delivered.
psLens allows you to browse these definitions, check execution statistics (run counts, average durations, success rates), and review their configuration.
Search Page
URL: /processdefinitions?db={database}
Search: Search by process name (prefix match) or select advanced filters.
Filters: Filter process definitions by process type (e.g., Application Engine, SQR Report), component, and last modified info.
Configuration & Properties: Displays execution details like the command-line parameters, target server name, API awareness, run control component, and priority.
Output Settings: Shows output type (Web, File, Printer) and output format (PDF, CSV, HTML, etc.).
Execution Statistics: psLens analyzes historical process request data to present statistics on:
Total runs and average duration.
Status breakdown (Success vs Error / Cancelled).
Top operators who run the process.
Top servers where the process executes.
Export as Markdown: Export the process definition details as a markdown document.
7.26 - Process Jobs
Browse PeopleSoft Process Scheduler job definitions and inspect their sequence of execution.
Tailored Operational Context
Target Database:—
Context Type:—
Alert Severity:—
Triggered Time:—
Firing Context:—
What It Is
Process Jobs (also called Job Definitions) are groups of one or more process definitions (or other jobs) bundled together to run as a single scheduled unit. A job executes its constituent processes in a defined sequence or in parallel, depending on the job definition.
psLens allows you to browse job definitions, inspect the list of items inside each job, and check their execution sequence.
Search Page
URL: /processjobs?db={database}
Search: Search for job definitions by job name (prefix match).
Metadata Card: Results display the job description, owner, and modification timestamps.
Detail Page
URL: /processjobs/{JOBNAME}?db={database}
The Detail Page displays:
Job Properties: Basic settings, such as description, run control validation, and server settings.
Job Items & Sequence: A table showing all processes and sub-jobs nested within this job, including:
Run order/sequence number.
Process Type and Process Name.
Description.
Run mode (e.g., Serial, Parallel).
Export as Markdown: Export the job definition and its sequence table to a markdown document.
7.27 - Recurrences
Browse PeopleSoft Process Scheduler recurrence schedules and check their next execution times.
Tailored Operational Context
Target Database:—
Context Type:—
Alert Severity:—
Triggered Time:—
Firing Context:—
What It Is
Recurrences define repeating schedule patterns used by the PeopleSoft Process Scheduler. Whenever a process or job is scheduled to run on a repeating schedule (e.g., daily, weekly, hourly), it is linked to a recurrence definition.
psLens allows you to search and view recurrence patterns to understand when a scheduled task is slated to run next and how frequently it triggers.
Search Page
URL: /recurrences?db={database}
Search: Search recurrence definitions by name (prefix match).
Metadata Card: Shows the description, owner, and modification timestamps.
Detail Page
URL: /recurrences/{RECURNAME}?db={database}
The Detail Page displays:
Recurrence Pattern Details: Shows recurrence settings such as:
Frequency (Daily, Weekly, Monthly, Hourly).
Run times (e.g., Daily at 12:00 AM, or every 5 minutes).
Selection of specific days of the week or month.
Start and end dates/times.
Next Run Prediction: Displays when the recurrence is next due to execute.
Export as Markdown: Export the recurrence schedule parameters as a markdown file.
7.28 - Server Definitions
Browse PeopleSoft Process Scheduler Server Definitions, monitor live running tasks, and inspect daemon settings.
Tailored Operational Context
Target Database:—
Context Type:—
Alert Severity:—
Triggered Time:—
Firing Context:—
What It Is
Server Definitions represent the Process Scheduler Servers that are defined inside PeopleSoft. These servers execute the batch processes (like Application Engines, SQRs, etc.) and manage scheduling recurrences and daemon processes.
psLens allows you to search and browse server definitions to see how a server is configured, check its live heartbeat status, see active running processes, review what process classes and categories it is authorized to run, check operational schedules, and view its notification routing.
Search Page
URL: /servers?db={database}
Search: Search for server definitions by name (prefix match, e.g., PRCS%).
Metadata Card: Shows the description, operating system, daemon status, and modification timestamps.
Detail Page
URL: /servers/{SERVERNAME}?db={database}
The Detail Page displays:
Server Status: Shows real-time heartbeat and diagnostics from PSSERVERSTAT including:
Current status (Running, Down, Suspended, Overloaded, etc.) with relative “time ago” timestamps.
CPU and Memory utilization.
Free disk space and thresholds.
AE/OE Server counts.
Active Running Processes: Live grid of active processes (Initiated, Processing, Running) currently executing on the server from PSPRCSRQST.
Server Definition Properties: Displays configuration metrics like version, sleep time, heartbeat frequency, max concurrent API aware/unaware tasks, distribution node details, CPU/Memory threshold configs, and load balancing/redistribution option choices.
Server Daemon Details: Shows daemon configuration:
Enabled state, daemon group, sleep time, recycle counts.
Active daemon process instance (with direct link to its Process Monitor view).
Process Categories: Authorized process categories with priority and max concurrent execution counts.
Process Types: Specific process types the server is configured to run, categorized by operating system, priority, and concurrent limits.
Server Operation Times: Scheduled operation windows when the server is active (24/7 or day/time ranges).
Status Notifications: List of users and roles notified upon server status changes (e.g., when the server goes down or encounters an error), displaying active status flags as checkboxes.
Export as Markdown: Export the entire server definition structure and live status/child tables as a markdown file.
8 - Tools
Additional developer and operational utilities in psLens.
Tools
Developer and operational utilities that span multiple features and object types in psLens:
Global Search — Quick, keyboard-driven navigation across all PeopleSoft metadata and security definitions.
Deep Linking — Permanent shareable URLs, cross-object navigation, and structured markdown exports.
DMS Viewer — Inspect, query, and generate SQL INSERT statements from PeopleSoft Data Mover .dat files.
8.1 - Global Search
Global Search Icon: Click the search magnifying glass icon in the top navigation bar from any page within the psLens interface.
Global Search
Global Search is a cross-object navigation tool in psLens. Rather than navigating to individual object search pages (like Fields, Components, or Users), Global Search allows you to search across all PeopleSoft metadata and security definitions simultaneously from a single search modal.
Walkthrough: Using Global Search to quickly locate and navigate to PeopleSoft objects
How to Access Global Search
Global Search Icon: Click the search magnifying glass icon in the top navigation bar from any page within the psLens interface.
Keyboard Shortcut: Press Ctrl + K (Windows/Linux) or Cmd + K (Mac OS) to trigger the search modal instantly.
Search Coverage
Global Search queries the selected database in real time to return matches across multiple object categories:
Object Type
Fields Searched
Fields
Field Name (FIELDNAME), Short/Long Descriptions
Records
Record Name (RECNAME), Record Description
Pages
Page Name (PNLNAME), Page Description
Components
Component Name (PNLGRPNAME), Description
Menus
Menu Name (MENUNAME)
Permission Lists
Class ID (CLASSID), Description
Roles
Role Name (ROLENAME), Description
Users
OPRID, User Description
Process Definitions
Process Name (PRCSNAME), Description
SQL Objects
SQL Object Name (SQLID)
Application Packages
Package Root (PACKAGEROOT)
Application Engines
App Engine Name (AE_APPLID)
Key Features
Categorized Results:
Results are grouped dynamically by object type, allowing you to quickly scan through Records, Fields, or Users matching your query.
Deep Linking:
Clicking any search result takes you directly to that object’s detail page in the active database.
Multi-Database Support:
The search queries the active database selected in your nav bar. You can quickly switch databases from the top navigation to search the same term in a different environment.
8.2 - Deep Linking
Every PeopleSoft object in psLens has a permanent, shareable URL.
Shareable URLs
Every PeopleSoft object in psLens has a permanent, shareable URL. Copy the address bar, paste it into a ticket or Slack, and anyone with psLens access lands on the same object in the same database.
PeopleSoft’s native URLs are session-bound and cannot be shared or bookmarked reliably. psLens URLs can.
URL Structure
All object URLs follow the same pattern:
/resource/{identifier}?db={database}
resource — the object type (e.g., records, fields, permissionlists)
identifier — the object name as it appears in PeopleSoft (e.g., JOB, EMPLID, HCDPALL0100)
db — the configured database name, so the link is unambiguous about which environment it points to
Linkable Object Types
psLens provides direct URLs for over 25 PeopleSoft object types:
Category
Objects
Security
Permission Lists, Roles, Users
Objects
Projects, Project Import, Fields, Records, SQL Objects, Pages, Components, Component Interfaces, Menus, Content References (CREFs), Message Catalogs, Application Packages, URLs, HTML Definitions, Style Sheets, Queries, Query Trees, Nodes, Services, Service Operations, Messages, Queues, Application Engines, Process Definitions, Process Jobs, Recurrences
Every object listed above can be linked to directly. For example:
/records/JOB?db=PROD — the JOB record definition in your PROD database
/crefs/EMPLOYEE/PT_PORTAL_ROOT?db=PROD — a content reference (CREF) in the EMPLOYEE portal in PROD
/permissionlists/HCDPALL0100?db=DEV — a permission list in DEV
/serviceoperations/USER_PROFILE.v1?db=PROD — a service operation in PROD
Cross-Object Navigation
Detail pages link to related objects. When you view a record, the fields listed on that page link to their own detail pages. When you view a component, the pages within it are clickable. When you view a permission list, the roles that include it are linked.
This means you can navigate through the PeopleSoft object graph by clicking — from a record to its fields, from a field to the records that use it, from a component to its pages, and so on. Breadcrumbs at the top of each detail page show where you are in the hierarchy.
On Component detail pages, the portal navigation path shows clickable breadcrumb segments — each segment links to the CREF (Content Reference) definition for that folder or component, allowing you to navigate the portal registry hierarchy directly. The portal name itself links to browse all CREFs in that portal.
Clickable PeopleCode References
When viewing PeopleCode source code in psLens, references to Application Classes and Declared Functions are clickable.
An Application Class reference (e.g. PT_BRANDING:BrandingElement) links directly to the corresponding Application Package page.
A declared external function (e.g., Declare Function Get_Schedule PeopleCode RECORD.FIELD Event) links directly to the record field event containing the function definition.
Deep Links with Pre-Expanded Sections
Some detail pages support query parameters that pre-expand specific sections. This is useful when you want to share a link that shows exactly the information someone needs to see.
This link opens the JOB record in PROD with the PeopleCode section expanded and the EMPLID.FieldChange event visible — one click to the exact code your colleague needs to review.
Practical Use Cases
Audit and Compliance
In an audit workpaper, paste the psLens URL instead of a screenshot. The reviewer clicks through to the live object with no ambiguity about which permission list, which role, which version.
Reference the exact permission list, role, or user profile in an audit finding
Cite the exact URL in the finding; six months later the reviewer can re-open it
Eliminate the “which screen was that?” problem when revisiting findings months later
Incident Response and Troubleshooting
Instead of typing “open App Designer, find project XXXX, look at record YYYY,” paste a link into Slack or your incident channel. Everyone on the call arrives at the same view instantly.
Share the exact service operation that is failing
Link to the process definition that is stuck
Point teammates to the specific record or component under investigation
Change Management
When documenting changes in ServiceNow, Jira, or any ticketing system, include psLens links to the objects affected by the change.
Link to the project definition to show exactly what objects are included in a release
Reference specific components or records in change request descriptions
Build runbooks with clickable links instead of navigation instructions
Security Reviews
Security administrators can share direct links to the objects under review, making it easy for reviewers to verify configurations without navigating there themselves.
Link to permission lists with show_components=true to show what access they grant
Share user profile links showing role assignments
Reference exact objects in security audit reports and remediation tickets
Team Collaboration
A business analyst on the change call doesn’t need App Designer open. Paste the link, they see the record.
Markdown Export
Every PeopleSoft object detail page in psLens can export its full definition as a Markdown file. This exported file can be attached to documentation, included in a wiki, or stored alongside change records. Combined with deep links, you get both a static snapshot and a live reference back to psLens.
Look for the Export as Markdown card in the right-hand sidebar of any object detail page — records, fields, pages, components, menus, application packages, app engines, component interfaces, SQL objects, URLs, HTML and stylesheet definitions, projects, queries, query trees, message catalogs, CREFs, nodes, services, service operations, messages, queues, permission lists, roles, users, process definitions, process jobs, and recurrences.
Recursive PeopleCode Resolution
For objects containing PeopleCode (such as records, components, application packages, and app engines), the export card includes a Recursively resolve imports toggle. When enabled, psLens parses the source code for Application Class imports and external function declarations. It recursively retrieves the source code of those referenced classes and functions from the database and appends them to a dedicated references section in the exported document.
8.3 - DMS Viewer
Upload, inspect, and extract data from PeopleSoft Data Mover (.dat) export files.
What It Is
PeopleSoft Data Mover is commonly used to export data from tables to proprietary .dat binary files for backup, migration, or archiving.
The DMS Viewer in psLens allows you to upload and inspect these binary Data Mover .dat files directly in your web browser. You can inspect table counts, view schema columns, browse exported rows, and generate SQL INSERT statements for individual rows without launching Data Mover or running an import.
Uploading a DMS File
URL: /dms-viewer
To parse a DMS file:
Go to the DMS Viewer page.
Select or drag-and-drop your .dat file (up to 50MB) into the upload area.
The server will parse the binary file structure and display its metadata.
File View
After parsing, the DMS file metadata is shown:
DMS File Metadata: Source database name, Data Mover export version, base language, export start timestamp, table count, and total row count.
Tables list: An index showing all tables exported in the .dat file along with the number of rows exported for each table. Clicking any table name opens its detail view.
Table detail and Row Browser
Inside a table’s view, you can browse its columns and rows:
Columns list: Shows the fields/columns defined for the table in the export.
Row Grid: Displays the exported rows in a paginated table (100 rows per page).
SQL INSERT Generator: Click the Generate SQL action on any row. psLens will reconstruct a standard SQL INSERT statement for that specific row’s data and display it in a copyable text area. Use this to grab a single config row out of a DAT file without running a full import.
9 - Reports
psLens security and audit reports for PeopleSoft: full access analysis, node password checks, web service access reviews, and more.
Security and Audit Reports
Alerts fire in real time. Reports run on demand against a selected database and produce a Markdown document with findings, evidence, and links back into psLens. Run them before an upgrade, after a migration, or whenever someone asks for proof.
Reports run in the background, render in the browser, and export as Markdown for audit trails and follow-up
How Reports Work
Go to the Reports page and choose a report to run
Select the database you want to analyze
The report runs in the background — you can navigate away and come back
When the report finishes, results are displayed as formatted output in the browser
You can also download the results as a Markdown (.md) file
Reports run asynchronously, so they don’t block the UI and you won’t lose your work if the report takes a few minutes. Progress is shown while the report runs.
Report results are stored for 90 days. You can go back and review previous runs from the Reports page.
Running a Report
Navigate to Reports in the left sidebar
Click Run New Report
Select the report type from the dropdown
Choose the database to run against
Adjust any parameters (such as threshold values) if needed
Click Run
The report appears in your report history as “Running.” Refresh or wait on the page — results appear automatically when the report completes.
Scheduling Reports
In addition to running reports on-demand, you can schedule reports to execute automatically at recurring intervals. Scheduled reports can target specific databases and send notifications when they complete.
How to Schedule a Report
Navigate to Reports and click Run New Report.
Locate the report you want to schedule and click the Schedule button.
In the configuration modal:
Target Databases: Select one or more active databases to target.
Schedule Interval: Choose from Daily, Weekly, or Monthly.
Time of Day: Specify the execution time in server local time (e.g., 02:00 or 14:30).
Notification Deliveries: Toggle Email or Webhook notifications on completion, then select an existing target from the dropdown or input a custom target.
Click Save Schedule. You will be automatically redirected to the Active Schedules page where your new schedule is listed.
Managing Active Schedules
Navigate to Active Schedules in the left sidebar. Here you can:
View: See all scheduled report parameters, target databases, and delivery endpoints.
Edit: Click Edit to modify the recurrence interval, time, targets, or databases.
Cancel: Click Cancel to disable and delete the schedule override.
Downloading Reports
On any completed report’s results page, click Download as Markdown to save the full report output as a .md file. Markdown files are plain text and can be opened in any text editor, rendered on GitHub, or converted to other formats.
If you want to inspect the artifact before installing anything, start with Sample Report Output.
Report Categories
Browse reports by category:
Security — Permission list analysis, password audits, user access reviews
We are open for product feedback. Each report here is a module in the psLens report framework, and the 14 reports were added one module at a time, so new reports are usually quick to incorporate. If your audit or operations work needs a report psLens does not ship, tell us. psLens is onboarding design partners, and partner requests set the build order.
See Reports in Action
The report catalog tells you what each report reads and what it returns. A live walkthrough shows the important part: how teams run them, how long they take, and how the output fits into audits, migrations, and operational reviews.
Real psLens report output, exported to Markdown from a development environment, so you can see the exact artifact a report run produces before installing anything.
Every psLens report produces a Markdown document: findings up top, supporting detail below, stored for 90 days and exportable with one click. The files linked on this page are real output, run against a Campus Solutions 9.2 development image and exported exactly as psLens produced them. Only hostnames and two service-account names were changed. The deep links inside each file point at a placeholder psLens URL; in your deployment they resolve to the live object pages.
Stale Passwords Report
Lists unlocked accounts whose password is older than the configured threshold (90 days in this run), with last sign-on and permission list context. Against this dev image it analyzed 212 user accounts and flagged 11 accounts that had not changed passwords in over a year, including the delivered PS superuser at 463 days.
Checks permission lists for capabilities that bypass security controls or escalate privileges: SOAP-to-CI web library access, WSDL generation, user profile management, role management, node configuration, and more. Each finding lists the permission lists involved, the roles that carry them, and the count of unlocked users affected. This run found 2 permission lists granting SOAP-to-CI access, one of them attached to broad self-service roles.
Flags message nodes with no authentication configured. Against this dev image: 62 active nodes, 58 of them with AUTHOPTN='N', meaning any system that can reach the gateway can send messages through them. Delivered dev images really do look like this, which is why the report exists.
Each report above is documented in the reports catalog with its parameters and the PeopleTools tables it reads. Reports run in the background with live progress, and results stay available for 90 days.
9.2 - Security
Security audit reports for PeopleSoft: permission list analysis, password audits, user access reviews, and more.
Eight reports against PSOPRDEFN, PSCLASSDEFN, PSROLECLASS, PSAUTHITEM, and PSMSGNODEDEFN. They answer: who has too much, who has stale credentials, and which IB nodes will let any caller in.
Lists users with special PeopleTools access (Application Designer, Data Mover, Object Security, Query, Import Manager), traced through permission lists and roles
Identifies permission lists granting access to dangerous capabilities such as SOAP-to-CI, WSDL generation, user profile management, and node configuration
Identifies users with native passwords in PSOPRDEFN when using Single Sign-On
9.2.1 - Full Access Permission Lists
This report identifies PeopleSoft permission lists that have an unusually high number of menu authorizations.
New to psLens? This page documents one specific report. To see how it runs in the product, what
the output looks like, and how teams use it in practice, start with a live walkthrough.
This report identifies PeopleSoft permission lists that have an unusually high number of menu authorizations. Permission lists with 50+ menu authorizations are usually “superuser” lists that grew organically. Find them so you can audit who has them.
What It Detects
Permission lists where the total count of menu authorizations meets or exceeds a configurable threshold (default: 50).
Menu authorizations are entries in PSAUTHITEM that match real menus in PSMENUITEM via a parent-child join. This excludes special permissions like APPLICATION_DESIGNER, DATA_MOVER, QUERY, and WEBLIB entries.
Tables Queried
PSCLASSDEFN — Permission List Definitions
The primary record for PeopleSoft permission lists (also called “classes”).
Field
Description
CLASSID
Permission list name (primary key)
CLASSDEFNDESC
Description of the permission list
LASTUPDOPRID
Last operator who modified this permission list
LASTUPDDTTM
Timestamp of last modification
PSAUTHITEM — Menu Authorization Entries
Each row represents a menu/bar/item combination that a permission list is authorized to access.
Field
Description
CLASSID
Permission list (foreign key to PSCLASSDEFN)
MENUNAME
Menu name
BARNAME
Menu bar name
BARITEMNAME
Menu bar item name
DISPLAYONLY
Whether access is display-only
AUTHORIZEDACTIONS
Bitmask of authorized actions
PSMENUITEM — Menu Item Details
Used via a parent-child join with PSAUTHITEM to validate that authorization entries correspond to real menu items. Only PSAUTHITEM entries matching a PSMENUITEM record are counted.
Field
Description
MENUNAME
Menu name (join key)
BARNAME
Menu bar name (join key)
ITEMNAME
Item name (joins to BARITEMNAME)
PNLGRPNAME
Component name
MARKET
Market code
ITEMLABEL
Display label
Data Flow
1. Fetch ALL permission lists from PSCLASSDEFN
   via SearchPermissionLists (batches of 300)
        |
        v
2. For EACH permission list:
   Query PSAUTHITEM joined with PSMENUITEM
   via GetMenuAuthorizations (pages of 100)
   Count total matching entries
        |
        v
3. Filter: keep only permission lists where
   menu auth count >= minMenuCount (default 50)
        |
        v
4. Sort results by menu auth count (descending)
        |
        v
5. Generate Markdown report with summary table
Report Output
The generated report contains:
Header with database name, generation timestamp, and threshold value
Summary showing total permission lists analyzed and count flagged
Flagged Permission Lists table with columns:
Permission List (CLASSID)
Description (truncated to 50 characters)
Menu Auth Count
Last Updated By (operator ID)
Last Updated (timestamp)
Recommendations section with remediation guidance
Parameters
Parameter
Default
Description
minMenuCount
50
Minimum number of menu authorizations to flag a permission list
Interpreting Results
High counts (200+): These permission lists likely grant access to a very large portion of the application. They are often “admin” or “superuser” lists and should be reviewed to ensure they are only assigned to appropriate roles.
Moderate counts (50-200): May indicate permission lists that have grown over time. Consider whether they can be split into more focused lists.
Last Updated By: If the operator is not a known security administrator, investigate whether the change was authorized.
Recommendations
Review flagged permission lists for excessive access
Consider splitting broad permission lists into more focused, role-specific lists
Verify that the “Last Updated By” operator is authorized to make security changes
9.2.2 - Nodes with No Password
This report identifies active PeopleSoft message nodes that have no authentication configured or have authentication enabled but no passwords set.
New to psLens? This page documents one specific report. To see how it runs in the product, what
the output looks like, and how teams use it in practice, start with a live walkthrough.
This report identifies active PeopleSoft message nodes that have no authentication configured or have authentication enabled but no passwords set. Anything on the network can post messages to these nodes.
What It Detects
The report categorizes problem nodes into three severity levels:
CRITICAL — Active Nodes with No Authentication
Active nodes where AUTHOPTN = 'N' (None). Any external system can communicate with these nodes without providing any credentials.
WARNING — Active Nodes with Auth but No Passwords
Active nodes that have an authentication option configured (AUTHOPTN is P, C, or T) but neither the internal password (IBPASSWORD) nor external password (IBEXTERNALPWD) fields contain a value.
INFO — Inactive Nodes with No Authentication
Nodes that are currently inactive (ACTIVE_NODE = '0') but have no authentication. While not an immediate risk, these would become vulnerable if reactivated.
Table Queried
PSMSGNODEDEFN — Message Node Definitions
The primary record for PeopleSoft Integration Broker message nodes.
Field
Description
Values
MSGNODENAME
Node name (primary key)
ACTIVE_NODE
Whether the node is active
1 = Active, 0 = Inactive
AUTHOPTN
Authentication option
N = None, P = Password, C = Certificate, T = Token
IBPASSWORD
Internal password
Non-empty means password is set
IBEXTERNALPWD
External password
Non-empty means password is set
USERID
PeopleSoft user ID associated with the node
CONNID
Connector ID
e.g., HTTPTARGET, JMSTARGET
NODE_TYPE
Node type
DESCR
Description
LASTUPDOPRID
Last updated by operator
LASTUPDDTTM
Last updated timestamp
Data Flow
1. Fetch ALL message nodes from PSMSGNODEDEFN
   via SearchNodes (batches of 300)
        |
        v
2. Categorize each node:
   - Is it active? (ACTIVE_NODE == "1")
   - What is its auth option? (AUTHOPTN)
   - Does it have any password? (IBPASSWORD or IBEXTERNALPWD)
        |
        v
3. Sort into three buckets:
   CRITICAL: Active + AuthOptn == "N"
   WARNING:  Active + AuthOptn != "N" + no passwords
   INFO:     Inactive + AuthOptn == "N"
        |
        v
4. Generate Markdown report grouped by severity
Categorization Logic
The report uses these helper methods on each node record:
Method
Logic
IsActive()
Returns true if ACTIVE_NODE == "1"
HasInternalPassword()
Returns true if IBPASSWORD is non-empty
HasExternalPassword()
Returns true if IBEXTERNALPWD is non-empty
HasAnyPassword()
Returns true if either internal or external password is set
Report Output
The generated report contains:
Header with database name and generation timestamp
Summary with total node counts, active count, and counts per severity category
CRITICAL section (if any): Table with node name, description, node type, connector, user ID, last updated by/when
WARNING section (if any): Table with node name, description, auth option label, internal/external password status (Set/Not Set), user ID, last updated
INFO section (if any): Table with inactive node name, description, node type, last updated by/when
Recommendations based on which severity categories have findings
Parameters
This report has no configurable parameters.
Interpreting Results
CRITICAL findings require immediate action. Active nodes with no authentication mean any system on the network can send messages without credentials.
WARNING findings should be investigated. Authentication is configured but credentials may not be properly set, rendering the authentication ineffective.
INFO findings are lower priority but represent latent risk. If these nodes are ever reactivated, they would immediately become vulnerable.
Authentication Option Reference
Value
Label
Description
N
None
No authentication required
P
Password
Password-based authentication
C
Certificate
Certificate-based authentication
T
Token
Token-based authentication
Recommendations
Immediately configure authentication on active nodes with AUTHOPTN='N'
Set AUTHOPTN to P (Password) or C (Certificate) and configure credentials
Set internal or external passwords on nodes that have auth enabled but no credentials
9.2.3 - Stale Password Audit
This report identifies unlocked PeopleSoft user accounts whose passwords have not been changed within a configurable number of days.
New to psLens? This page documents one specific report. To see how it runs in the product, what
the output looks like, and how teams use it in practice, start with a live walkthrough.
This report identifies unlocked PeopleSoft user accounts whose passwords have not been changed within a configurable number of days. External auditors will ask. SSO accounts are automatically excluded, so the list is users who still have a real PeopleSoft password.
What It Detects
The report categorizes stale password accounts into three severity levels based on how long the password has been unchanged:
CRITICAL — Password Not Changed in Over 1 Year
Unlocked accounts where the password has not been changed in over 365 days. These represent the highest risk and should be addressed immediately.
WARNING — Password Not Changed in Over 180 Days
Unlocked accounts where the password is between 180 and 365 days old.
INFO — Password Exceeds Configured Threshold
Unlocked accounts where the password exceeds the configured threshold (default 90 days) but is less than 180 days old.
The report also separately identifies:
No Password Change Date Recorded. Unlocked accounts with no recorded LASTPSWDCHANGE value (may be migrated or misconfigured)
SSO users (accounts with no PeopleSoft password set) are automatically excluded from this report.
Table Queried
PSOPRDEFN — Operator Definitions (User Accounts)
The primary record for PeopleSoft user accounts.
Field
Description
Values
OPRID
User ID (primary key)
OPRDEFNDESC
User description/name
LASTPSWDCHANGE
Date of last password change
Date format
LASTSIGNONDTTM
Date/time of last sign-on
Datetime format
ACCTLOCK
Account lock status
0 = Active, 1 = Locked
PTOPERPSWDV2
Password hash
Non-empty means password is set (SSO users have no password)
OPRCLASS
Primary permission list
Data Flow
1. Fetch ALL users from PSOPRDEFN
   via SearchUsers (batches of 300)
        |
        v
2. Filter:
   - Skip locked accounts (ACCTLOCK = 1)
   - Skip SSO users (no password set)
        |
        v
3. Parse LASTPSWDCHANGE date and compute days since change
        |
        v
4. Categorize into severity buckets:
   CRITICAL: > 365 days since password change
   WARNING:  > 180 days
   INFO:     > staleDays threshold (default 90)
   Plus: No change date recorded
        |
        v
5. Sort each category by days since change (oldest first)
        |
        v
6. Generate Markdown report grouped by severity
Parameters
Parameter
Default
Description
staleDays
90
Number of days after which a password is considered stale
Report Output
The generated report contains:
Header with database name, generation timestamp, and threshold parameter
Summary with total user counts, unlocked count, and counts per severity category
CRITICAL section (if any): Table with user ID (linked), description, last password change date, days since change, last sign-on, permission list
WARNING section (if any): Same table format
INFO section (if any): Same table format
No Password Change Date section (if any): Table with user ID, description, last sign-on, permission list
Recommendations based on which categories have findings
Interpreting Results
CRITICAL findings require immediate action. Passwords unchanged for over a year are a significant security risk, especially if the accounts are actively used (check the Last Sign-on column).
WARNING findings should be scheduled for remediation. These accounts are approaching a year without a password change.
INFO findings indicate policy non-compliance. The accounts exceed your configured threshold but are not yet at the warning level.
No Password Change Date accounts are often migrated accounts. Verify they are legitimate and consider requiring a password reset.
SSO users (no PeopleSoft password set) are automatically excluded from this report.
Investigate accounts with no password change date — these may need manual password resets.
9.2.4 - User Full Access Report
This report generates a consolidated view of everything a single PeopleSoft user can access.
New to psLens? This page documents one specific report. To see how it runs in the product, what
the output looks like, and how teams use it in practice, start with a live walkthrough.
Report ID:security-user-accessCategory: Security
Parameters:oprid (required) — the PeopleSoft User ID to audit
Purpose
This report generates a consolidated view of everything a single PeopleSoft user can access. It expands all roles and permission lists to show the full scope of a user’s security profile in one document. This is useful for security audits, access reviews, onboarding/offboarding verification, and compliance reporting.
What It Covers
The report walks the full PeopleSoft security hierarchy for the specified user:
User Details. Account status, authentication method, direct permission list assignments
Roles. All roles assigned to the user (including dynamic roles)
Permission Lists. Unique permission lists derived from assigned roles, with a reverse map showing which roles grant each
PeopleTools Access. Client tool access (Application Designer, Data Mover, etc.)
Menu/Component Access. All menu authorizations grouped by menu, showing components and display-only status
Service Operations. All authorized Integration Broker service operations
Component Interfaces. All authorized component interfaces
Process Groups. Authorized process scheduler groups
Query Tree / Row-Level Security. Accessible records via query tree security
Tables Queried
Table
Purpose
PSOPRDEFN
User definition and account details
PSROLEUSER
User-to-role assignments
PSROLECLASS
Role-to-permission-list mapping
PSCLASSDEFN
Permission list definitions
PSAUTHITEM + PSMENUITEM
Menu/component authorizations
PSAUTHWS
Service operation authorizations
PSAUTHBUSCOMP
Component interface authorizations
PSAUTHPRCS
Process group authorizations
SCRTY_ACC_GRP
Query tree security access groups
PSTREENODE
Query tree node hierarchy
Data Flow
1. Fetch user details from PSOPRDEFN
        |
        v
2. Fetch all roles from PSROLEUSER
        |
        v
3. Batch-fetch permission lists for all roles
   from PSROLECLASS
        |
        v
4. Collect unique permission list ClassIDs
        |
        v
5. For ALL unique ClassIDs, fetch:
   - PeopleTools access (PSAUTHITEM special entries)
   - Menu authorizations (PSAUTHITEM + PSMENUITEM)
   - Service operation auths (PSAUTHWS)
   - Component interface auths (PSAUTHBUSCOMP)
   - Process group auths (PSAUTHPRCS)
   - Query tree access groups (SCRTY_ACC_GRP)
        |
        v
6. For query trees: walk tree hierarchy to
   resolve accessible leaf records
        |
        v
7. Generate consolidated Markdown report
How to Run
This report can be launched in two ways:
From the User Detail Page: Navigate to any user’s detail page and click the Run Full Access Report button in the right sidebar. The report automatically uses the current user and database.
From the Reports Page: Go to Reports > Run New Report > User Full Access Report. Click Go to Users to search for a user, then run it from the user’s detail page.
Report Output
The generated report contains:
Summary table with counts for each access category
User Details with account status, authentication, and direct permission lists
Roles table with dynamic assignment indicators
Permission Lists table showing which roles grant each permission list
PeopleTools Access table showing Yes/No for each client tool
Menu/Component Access grouped by menu name, with component links, labels, and display-only flags
Service Operations table with operation and permission list links
Component Interfaces table with interface and permission list links
Process Groups table listing authorized process groups
Query Tree tables showing accessible records with tree and access group context
All object names in the report are linked back to their detail pages in psLens for easy navigation.
Interpreting Results
Large number of roles: Users with many roles may have accumulated access over time. Review whether all roles are still needed.
Overlapping permission lists: Multiple roles may grant the same permission list. While not harmful, it can make access reviews harder.
PeopleTools access: Application Designer, Data Mover, and Object Security access should be limited to developers and security administrators.
Display-only flags: Components marked as display-only mean the user can view but not modify data through those pages.
Process groups: Verify that users only have access to process groups relevant to their job function.
9.2.5 - Dangerous Permissions Audit
This report identifies permission lists that grant access to dangerous capabilities in PeopleSoft.
New to psLens? This page documents one specific report. To see how it runs in the product, what
the output looks like, and how teams use it in practice, start with a live walkthrough.
This report identifies permission lists that grant access to dangerous capabilities in PeopleSoft. Each of the eight checks is a known attack path: SOAP-to-CI lets a permission-list holder call any Component Interface without a dedicated service operation, USERPROFILES lets them mint new accounts, IB_NODE lets them point a node at attacker-controlled infrastructure. Each category is assigned a severity level (CRITICAL or HIGH) to help prioritize remediation.
What It Checks
The report audits 8 categories of dangerous access:
CRITICAL Severity
Category
Menu/Bar Item
Risk
SOAP to CI (WEBLIB_SOAPTOCI)
MENUNAME = 'WEBLIB_SOAPTOCI'
Allows programmatic access to Component Interfaces via SOAP without dedicated service operations
User Profile Management
MENUNAME = 'MAINTAIN_SECURITY', bar items: USERPROFILES, USER_SAVEAS, USERMAINT_DIST (non-display-only)
Ability to create, modify, or delete user profiles — the highest-level security object
Node Configuration
MENUNAME = 'IB_CONFIGURE', bar item: IB_NODE (non-display-only)
Ability to define or modify Integration Broker nodes, including authentication credentials
HIGH Severity
Category
Menu/Bar Item
Risk
WSDL Generation (WEBLIB_MSGWSDL)
MENUNAME = 'WEBLIB_MSGWSDL'
Can expose the structure and endpoints of web services
Role Management
MENUNAME = 'MAINTAIN_SECURITY', bar items: ROLEMAINT, ROLESAVEAS (non-display-only)
Ability to create, modify, or delete roles, controlling permission assignments
Permission List Purge
MENUNAME = 'MAINTAIN_SECURITY', bar items: PURGE_PERMLIST, PURGE_ROLEDEFN, PURGE_USR_PROFILE (non-display-only)
Ability to purge permission lists, roles, or user profiles
URL Definitions Management
MENUNAME = 'MAINTAIN_SECURITY', bar item: URL_MAINTENANCE (non-display-only)
Ability to create or modify URL definitions for redirects or external integrations
Process Type Definitions
MENUNAME = 'PROCESSMONITOR', bar item: PRCSTYPE (non-display-only)
Ability to modify process type definitions controlling batch process execution
Table Queried
PSAUTHITEM — Authorization Items
Queried once per category with the specific WHERE clause for that check.
Field
Description
CLASSID
Permission list that has this access
MENUNAME
Menu name being authorized
BARITEMNAME
Menu bar item name
DISPLAYONLY
Display-only flag (0 = full access, 1 = display only)
PSROLECLASS — Role/Permission List Assignments
Queried per permission list found, via GetPermissionListRoles.
Field
Description
CLASSID
Permission list
ROLENAME
Role that includes this permission list
PSOPRALIASTYPE / PSOPRDEFN — User Counts
Queried in batch via GetUnlockedUserCountForRoles to count unlocked users per role.
Data Flow
1. For each of 8 dangerous capability categories:
        |
        v
2. Query PSAUTHITEM with category-specific WHERE clause
   -> Extract unique permission lists (CLASSID)
        |
        v
3. For each permission list found:
   -> Fetch assigned roles via PSROLECLASS
        |
        v
4. Batch query unlocked user counts for all roles
        |
        v
5. Sort findings by total unlocked user count (descending)
        |
        v
6. Generate per-category section with severity badge,
   description, and permission list table
        |
        v
7. Generate summary and recommendations
Parameters
This report has no configurable parameters.
Report Output
The generated report contains:
Header with database name and generation timestamp
Per-category sections (8 total), each with:
Severity badge (CRITICAL or HIGH)
Description of the dangerous capability
Count of permission lists with this access
Table with: Permission List (linked), Roles, Unlocked User count
Or “No findings” if no permission lists have this access
Summary with total categories checked and total permission lists found
Recommendations for each category
Interpreting Results
CRITICAL findings should be reviewed immediately. SOAP-to-CI access, user profile management, and node configuration can all be used for privilege escalation or unauthorized data access.
HIGH findings should be scheduled for remediation. These capabilities are security-sensitive but may have legitimate use cases in limited quantities.
Permission lists with no roles assigned may be orphaned but should still be reviewed — they could be assigned in the future.
High unlocked user counts indicate broad exposure to the dangerous capability and should be prioritized for remediation.
Display-only access is excluded. The report only flags non-display-only (DISPLAYONLY = 0) access for menu-based checks, so findings represent actual write/execute capability.
Recommendations
Remove WEBLIB_SOAPTOCI access in production environments unless absolutely required for integration — use dedicated service operations instead
Restrict WSDL generation to development environments only; in production, serve static WSDL files
Limit user profile management to a small number of designated security administrators
Implement change management processes for role and permission list modifications
Restrict purge operations to emergency use only and require approval workflows
Audit node configuration access regularly, as nodes contain authentication credentials
9.2.6 - SOAP to CI Access Audit
‘SOAP to CI’ is a powerful tool that allows using excel or any web client to interact with PeopleSoft Component Interfaces via SOAP web services.
New to psLens? This page documents one specific report. To see how it runs in the product, what
the output looks like, and how teams use it in practice, start with a live walkthrough.
“SOAP to CI” is a powerful tool that allows using excel or any web client to interact with PeopleSoft Component Interfaces via SOAP web services. However, this capability also introduces significant security risks if not properly controlled, as it can allow users to programmatically read or write data in the application database. The number of users with access to this WebLib should be tightly controlled and regularly audited.
The SOAP to Component Interface Access Audit report identifies all PeopleSoft users (OPRIDs) who have access to the SOAP-to-CI WebLib (WEBLIB_SOAPTOCI). This WebLib allows programmatic data loading into PeopleSoft using standard Component Interface Web Services (acting as the endpoint for Excel-to-CI and custom integrations like psDataLoader).
For each identified user, the report details:
The security paths (Roles and Permission Lists) granting WebLib access.
The specific Component Interfaces they are authorized to access and execute, and which Roles and Permission Lists grant that CI access.
This report is critical for security audits to ensure that only authorized integration accounts or administrators possess programmatic write access to the application database.
Tables Queried
PSAUTHITEM — WebLib Authorizations
Used to find permission lists that grant access to WEBLIB_SOAPTOCI.
Field
Description
Filter
CLASSID
Permission list name
MENUNAME
WebLib name
MENUNAME = 'WEBLIB_SOAPTOCI'
PSROLECLASS — Role to Permission List Mapping
Used to trace permission lists back to roles.
Field
Description
CLASSID
Permission list
ROLENAME
Role assigning the permission list
PSROLEUSER — User to Role Mapping
Used to identify users assigned to the roles that grant Weblib access, and to map all roles assigned to those users.
Field
Description
ROLEUSER
User ID (OPRID)
ROLENAME
Assigned role
PSOPRDEFN — Operator Definitions
Used to identify users who get direct access via their Primary Permission List (OPRCLASS), and to retrieve user account lock status and descriptions.
Used to trace all Component Interface authorizations for the permission lists assigned to the identified users.
Field
Description
CLASSID
Permission list
BCNAME
Component Interface name
BCMETHOD
Component Interface method
Data Flow
1. Query PSAUTHITEM to find all permission lists (CLASSID) authorizing WEBLIB_SOAPTOCI
        |
        v
2. Query PSROLECLASS to trace those permission lists back to Roles
        |
        v
3. Query PSROLEUSER and PSOPRDEFN to identify all users (OPRID) with:
   - Assignment to those Roles
   - Direct Primary Permission List (OPRCLASS) granting access
        |
        v
4. Fetch user details (description, lock status) for all identified users
        |
        v
5. Fetch all Roles and Permission Lists assigned to those users
        |
        v
6. Fetch all Component Interface (CI) authorizations (PSAUTHBUSCOMP) for those permission lists
        |
        v
7. For each user, map their SOAP-to-CI access paths and all authorized Component Interfaces
        |
        v
8. Sort users (active first, then by ID) and generate the Markdown report
Parameters
This report has no configurable parameters.
Report Output
The generated report contains:
Header with database name and generation timestamp.
Summary statistics (total users, active vs. locked, unique roles, unique permission lists).
WebLib Access Path Summary Table listing each Role-Permission List pair granting SOAP-to-CI access and the number of active users with that assignment.
User Access Details Section detailing each user:
User ID (linked to detail page) and Description.
Account lock status (Active/Unlocked vs. Locked 🔒).
A table of Accessible Component Interfaces detailing which Role and Permission List grants access to each specific Component Interface.
Remediation Recommendations to secure your environments.
Interpreting Results
Unlocked users with SOAP-to-CI access must be verified. Programmatic SOAP-to-CI access should be reserved for integration service accounts or system administrators. Standard business users should not have access to this WebLib.
Active users with no Component Interface access have WebLib access but cannot interact with any business objects. While they present less immediate risk, their WebLib access should still be revoked to adhere to the principle of least privilege.
Locked users are flagged with Locked 🔒. While they cannot authenticate, their security definitions should still be cleaned up if their access is no longer required.
Primary Permission List grants (indicated by Primary Permission List instead of a Role) should be avoided. Best practice is to assign Weblib access through Roles.
Recommendations
Restrict WEBLIB_SOAPTOCI: Remove this WebLib access from any roles assigned to standard business users. Ensure it is only assigned to dedicated integration/service accounts.
Implement Least Privilege for CIs: Verify that service accounts only have access to the specific Component Interfaces (CIs) required for their integration. Remove broad or administrative permission lists that grant access to unnecessary CIs.
Lock Stale Accounts: Ensure that any old, inactive, or deprecated integration accounts are explicitly locked in PSOPRDEFN.
9.2.7 - SSO Bypass Password Audit
This page documents the SSO Bypass Password Audit report, which identifies native PeopleSoft user passwords stored in the PSOPRDEFN table.
New to psLens? This page documents one specific report. To see how it runs in the product, what
the output looks like, and how teams use it in practice, start with a live walkthrough.
This page documents the SSO Bypass Password Audit report, which identifies native PeopleSoft user passwords stored in the PSOPRDEFN table.
Purpose
Environments using Single Sign-On (SSO) should not store native passwords in the PeopleSoft database. If PSOPRDEFN passwords exist, users can bypass SSO controls—including Multi-Factor Authentication (MFA)—by accessing PeopleSoft backdoor login paths (such as ?cmd=login query parameters or web service endpoints).
To prevent backdoor access, the fields OPERPSWD, PTOPERPSWDV2, and OPERPSWDSALT must be cleared to a single space, since PeopleSoft does not support database nulls.
Important: There are types of users that need to maintain their PeopleSoft password for various reasons that this report will flag.
Anyone who needs 2-tier PeopleTools Access
Developers
Administrators
Special Accounts
App Server Accounts
API User Accounts for External Integrations
SOAP-to-CI Users (maybe)
For any accounts that you know should have a password, you can enter rolename for accounts to avoid. One idea here is to create a new role like X_CAN_HAVE_PS_PASSWORD (replace X_ With your desired prefix) so you can clearly mark these special users and everyone else should have their passwords cleared.
What It Detects
The report checks the PSOPRDEFN table for any row where OPERPSWD, PTOPERPSWDV2, or OPERPSWDSALT is not a single space. Results are grouped into two sections based on account status:
Active Users with Local Passwords: High risk. These accounts can be logged into directly.
Locked Users with Local Passwords: Low risk. These accounts are locked, but their passwords should still be cleared.
Table Queried
PSOPRDEFN
The primary table containing PeopleSoft operator definitions.
Field
Description
Values
OPRID
User ID (primary key)
OPRDEFNDESC
User description
ACCTLOCK
Account lock status
1 = Locked, 0 = Active
LASTSIGNONDTTM
Last sign-on date and time
OPERPSWD
Legacy password hash
PTOPERPSWDV2
Password hash (V2)
OPERPSWDSALT
Password salt
PSROLEDEFN
Used to validate that the entered excluded roles are real roles.
PSROLEUSER
Used via a subquery to exclude users assigned to the specified excluded roles.
Data Flow
1. If excludeRoles is provided, validate each role against PSROLEDEFN
    |
    v
2. Query PSOPRDEFN for rows where OPERPSWD, PTOPERPSWDV2, or OPERPSWDSALT is not ' ' (filtering out users assigned to excluded roles via a PSROLEUSER subquery)
    |
    v
3. Segment users based on ACCTLOCK (0 = Active, 1 = Locked)
    |
    v
4. Compile a bulk SQL update script containing individual UPDATE statements for all affected users
Report Output
The report outputs:
A summary of active and locked users containing passwords.
Tables listing the user ID, description, last sign-on date, and active password fields.
A bulk remediation SQL script with individual update queries.
Parameters
excludeRoles: Comma-separated list of role names to exclude from the audit (optional). If specified, any user assigned to any of these roles is excluded from the report. The report validates that all entered role names exist in PSROLEDEFN.
9.2.8 - PeopleTools Access Audit
Special PeopleTools access (Application Designer, Data Mover, Object Security, Query, Import Manager, 2-Tier Client) is granted on the PeopleTools …
New to psLens? This page documents one specific report. To see how it runs in the product, what
the output looks like, and how teams use it in practice, start with a live walkthrough.
Special PeopleTools access (Application Designer, Data Mover, Object Security, Query, Import Manager, 2-Tier Client) is granted on the PeopleTools tab of a permission list and recorded in PSAUTHITEM. This report lists every user who holds any of that access and the path that grants it: permission list to role to user.
What It Detects
For each PeopleTools application, the permission lists that grant it, the roles that carry those permission lists, and the users in those roles. Each grant is marked Full (edit) or Read-only based on PSAUTHITEM.DISPLAYONLY. Each user is marked Active or Locked from PSOPRDEFN.ACCTLOCK.
The tools tracked are the MENUNAME values PeopleSoft uses for standalone tools access:
PSROLECLASS — which roles include each permission list.
PSROLEUSER — which users hold each role.
PSOPRDEFN — account lock status (ACCTLOCK) and primary permission list (OPRCLASS).
PSOPROBJ — Definition Security grants: permission list to object group, with DISPLAYONLY (edit vs read-only).
PSOBJGROUP — object group membership (which definitions belong to a custom group).
Report Output
Four sections:
Summary — count of permission lists and distinct users per tool, plus the total number of users with any special access.
Access by Tool — each tool with its permission lists (Full or Read-only), descriptions, and the roles that carry them.
Access by User — every in-scope user with their account status, the tools they hold and at what level, a Def. Security column (can they edit definitions), and the permission lists and roles that grant them.
Definition Security (Object Security) — object group grants (PSOPROBJ): which permission lists can edit or read the definitions in each object group, and which users that reaches via primary permission list and roles.
Permission lists, roles, and users link back to their psLens detail pages.
Parameters
Parameter
Default
Description
activeOnly
false
When true, restrict the user sections to unlocked accounts only.
Interpreting Results
Full vs Read-only. Read-only Application Designer access can open and inspect definitions but not save changes. Full access can modify them. Treat Full access in a production database as the higher risk.
Locked users. Locked accounts still hold the grant. They appear so you can audit dormant access that would return if the account is unlocked. Set activeOnly = true to hide them.
Object Security. Access to the Object Security tool lets a user change Definition Security itself, which governs which definitions developers can edit.
Definition Security details
Holding Application Designer access lets a developer open the tool. What definitions they can edit is controlled by Definition Security object groups (PSOBJGROUP) linked to permission lists through PSOPROBJ. The DISPLAYONLY flag on that link is the difference between read-only and edit access.
The delivered PEOPLETOOLS object group holds the system definitions and is read-only by default. An Edit grant on it (DISPLAYONLY = 0) means the permission list can modify delivered PeopleTools objects in Application Designer — a high-privilege grant worth auditing.
The report applies these grants to users through both their primary permission list (PSOPRDEFN.OPRCLASS) and their roles, and labels which path reaches each user. Permission-list-level grants are reported exactly from PSOPROBJ; the user roster is the set reached through those permission lists.
9.3 - Integration Broker
Integration Broker reports for PeopleSoft: service operation audits, node security, routing analysis, and volume reporting.
Eight reports against the PSOPERATION, PSMSGNODEDEFN, PSIBRTNGDEFN, and IB log tables. Use them to find unauthenticated nodes, routings open to ~~ANY~~, sync ops running without logging, and dead operations no one bothered to deactivate.
Shows IB message volume for a date range broken down by async operations, pub/sub contracts, and logged sync operations
9.3.1 - Web Service Operation Access Audit
This report provides a consolidated view of which PeopleSoft service operations (web services) are accessible, through which permission lists and r…
New to psLens? This page documents one specific report. To see how it runs in the product, what
the output looks like, and how teams use it in practice, start with a live walkthrough.
This report provides a consolidated view of which PeopleSoft service operations (web services) are accessible, through which permission lists and roles, and how many active (unlocked) users have access through each role. It answers the question: “Who can call our web services and through what security chain?”
What It Captures
The report traces the full security chain for every service operation authorization:
Service Operation — The web service endpoint (from PSAUTHWS)
Permission List — The permission list granting access to that operation
Role — Each role that includes that permission list
Unlocked User Count — The number of users with that role whose accounts are not locked
Tables Queried
PSAUTHWS — Web Service Authorizations
Maps service operations to the permission lists that grant access.
Field
Description
IB_OPERATIONNAME
Service operation name (key)
CLASSID
Permission list granting access
PSROLECLASS — Role to Permission List Mapping
Maps roles to their assigned permission lists.
Field
Description
ROLENAME
Role name (key)
CLASSID
Permission list (key)
PSROLEUSER — Role to User Mapping
Maps roles to users, filtered to unlocked accounts only.
Field
Description
ROLENAME
Role name (key)
ROLEUSER
User OPRID (key)
PSOPRDEFN — User Definitions
Used as a subquery filter to count only unlocked users.
Field
Description
OPRID
User operator ID (key)
ACCTLOCK
Account lock status (0=unlocked, 1=locked)
Data Flow
1. Bulk fetch ALL PSAUTHWS records (paginated, batches of 300)
   -> Build map: Service Operation -> Permission Lists
        |
        v
2. For each unique Permission List, query PSROLECLASS
   -> Build map: Permission List -> Roles
        |
        v
3. For each unique Role, query PSROLEUSER
   with subquery filter: ACCTLOCK = 0 on PSOPRDEFN
   -> Build map: Role -> Unlocked User IDs
        |
        v
4. Group by service operation and sort by unique user count (descending)
   -> Generate Markdown report
Report Output
The generated report contains:
Summary with counts of service operations, unique permission lists, and unique roles.
Access Details List grouped by service operation. Each section lists the service operation, its distinct unlocked user count, and a nested bulleted list of its granting permission lists, roles, and the actual active user IDs (truncated at 15).
Sorted by unique user count (descending) to highlight the most widely accessible operations.
Permission lists with no roles show “(No roles assigned)”.
Recommendations for security review.
Interpreting Results
High unlocked user counts on sensitive service operations indicate broad access that may violate least-privilege principles.
Permission lists with “(No roles assigned)” are assigned to service operations but not included in any role. They may be orphaned or misconfigured.
Roles with 0 unlocked users grant web service access but have no active users. They are candidates for cleanup.
Operations with multiple permission lists and roles have complex access chains that are difficult to audit manually.
Use Cases
Security audit — Identify which web services have the broadest user access
Least-privilege review — Find operations accessible to more users than expected
Cleanup — Identify permission lists or roles granting web service access with no active users
9.3.2 - IB Node Security Audit
This report audits Integration Broker node user accounts for security issues that go beyond authentication configuration (which is covered by the N…
New to psLens? This page documents one specific report. To see how it runs in the product, what
the output looks like, and how teams use it in practice, start with a live walkthrough.
This report audits Integration Broker node user accounts for security issues that go beyond authentication configuration (which is covered by the Nodes with No Password report). It checks for elevated user privileges on nodes, shared user accounts across multiple nodes, and nodes with no active routings.
What It Detects
CRITICAL — Anonymous Node User Analysis
Checks the ANONYMOUS node’s associated PeopleSoft user account. Flags as HIGH RISK if:
The user account is unlocked (can log into PIA directly)
The user has PeopleTools access (Application Designer, Data Mover, etc.)
The ANONYMOUS node handles unauthenticated IB traffic. Its user should have minimal privileges and a locked account.
WARNING — Shared Node Users
Identifies cases where the same PeopleSoft User ID (OPRID) is configured on multiple active nodes. Each node should have its own distinct service account for:
Audit trail — Knowing which node performed an action
Security isolation — Revoking one node’s access without affecting others
Least privilege — Tailoring permissions per node’s specific needs
WARNING — Active Nodes with No Active Routings
Finds active non-local nodes that have no active routings in PSIBRTNGDEFN. These nodes may be:
Leftover from decommissioned integrations
Candidates for deactivation to reduce attack surface
Covered only by wildcard (~~ANY~~) routings (reported separately)
WARNING — Node Users with PeopleTools Access
Identifies node service accounts whose permission lists grant access to PeopleTools clients (Application Designer, Data Mover, Query, etc.). Node accounts should never need development tool access.
Tables Queried
PSMSGNODEDEFN — Message Node Definitions
Field
Description
Values
MSGNODENAME
Node name (primary key)
ACTIVE_NODE
Whether the node is active
1 = Active, 0 = Inactive
LOCALNODE
Whether this is a local node
1 = Local, 0 = External
USERID
PeopleSoft user ID associated with the node
NODE_TYPE
Node type
PSIBRTNGDEFN — Routing Definitions
Field
Description
Values
SENDERNODENAME
Sending node name
Node name or ~~ANY~~
RECEIVERNODENAME
Receiving node name
EFF_STATUS
Effective status
A = Active, I = Inactive
PSOPRDEFN — User Definitions
Field
Description
Values
OPRID
User ID (primary key)
OPRCLASS
Primary permission list
ACCTLOCK
Account lock status
0 = Unlocked, 1 = Locked
PSAUTHITEM — Menu/Tools Authorizations
Used to check if a permission list grants PeopleTools client access (APPLICATION_DESIGNER, DATA_MOVER, etc.).
Data Flow
1. Fetch ALL message nodes from PSMSGNODEDEFN
   (batches of 300)
        |
        v
2. Fetch ALL active routings from PSIBRTNGDEFN
   Build set of node names with active routings
        |
        v
3. For each unique UserID on active nodes:
   Look up user in PSOPRDEFN
        |
        v
4. For each unique permission list found:
   Check PSAUTHITEM for PeopleTools access
        |
        v
5. Analyze and categorize findings:
   - Anonymous node user privileges
   - Shared node users (same OPRID on 2+ nodes)
   - Active nodes not in routing coverage set
   - Node users with PeopleTools access
        |
        v
6. Generate Markdown report grouped by severity
Interpreting Results
CRITICAL findings on the ANONYMOUS node indicate that unauthenticated IB traffic is processed under a user with elevated privileges. This is a significant security risk.
Shared node users increase blast radius if one account is compromised and make it harder to trace which node performed specific actions.
Nodes with no routings represent unnecessary attack surface. If a node isn’t routing any messages, it should be deactivated.
PeopleTools access on node accounts means a compromised integration could potentially be used to modify PeopleSoft objects.
Recommendations
Lock the ANONYMOUS node user account to prevent direct PIA login
Remove PeopleTools access from node service account permission lists
Create distinct service accounts for each Integration Broker node
Deactivate nodes with no active routings if they are no longer needed
9.3.3 - Active ANY to Local Node Routings
This report identifies Integration Broker routings where the sender node is ANY and the receiver is the default local node.
New to psLens? This page documents one specific report. To see how it runs in the product, what
the output looks like, and how teams use it in practice, start with a live walkthrough.
This report identifies Integration Broker routings where the sender node is ~~ANY~~ and the receiver is the default local node. The ~~ANY~~ sender is a wildcard that allows any external node to send messages to the local system for that routing’s operation, bypassing node-specific routing controls.
~~ANY~~ routings are sometimes intentional (e.g., for broadly available services), but if left active without review they let any external node send messages inbound. This report lists which operations are open to inbound messages from any node.
What It Detects
WARNING — Active ~~ANY~~ to Local Node Routings
Active routings in PSIBRTNGDEFN where:
SENDERNODENAME = '~~ANY~~'
RECEIVERNODENAME is the default local node
EFF_STATUS = 'A' (Active)
These routings are currently allowing any external node to send messages inbound.
Used to find inbound routings to the default local node.
Field
Description
Filter
ROUTINGDEFNNAME
Routing definition name
SENDERNODENAME
Sender node
Checked for ~~ANY~~
RECEIVERNODENAME
Receiver node
= {default local node}
EFF_STATUS
Effective status
A = Active, I = Inactive
EFFDT
Effective date
IB_OPERATIONNAME
Service operation name
DESCR
Description
Data Flow
1. Fetch ALL message nodes from PSMSGNODEDEFN
   (batches of 300)
        |
        v
2. Filter for default local nodes:
   LOCALNODE = 1 AND LOCALDEFAULTFLG = 'Y'
        |
        v
3. For each default local node, fetch inbound routings
   from PSIBRTNGDEFN where RECEIVERNODENAME = node
        |
        v
4. Filter for active routings where SENDERNODENAME = '~~ANY~~'
        |
        v
5. Generate Markdown report with findings
Report Output
The generated report contains:
Header with database name and generation timestamp
Summary with total nodes scanned, default local node name(s), and count of active ~~ANY~~ routings
WARNING section (if any): Table of active ~~ANY~~ routings with routing name, receiver node, linked service operation, and description
Recommendations if active ~~ANY~~ routings are found
Interpreting Results
WARNING findings should be reviewed. Each active ~~ANY~~ routing means any external node can send messages for that operation to the local system. Determine whether this is intentional.
No findings means all inbound routings use explicit sender nodes, which is the most secure configuration.
Recommendations
Review each active ~~ANY~~ routing to determine if a wildcard sender is truly needed
Replace with explicit sender node routings where possible to restrict which nodes can send messages inbound
Deactivate unneeded ~~ANY~~ routings to reduce the attack surface
9.3.4 - Active Service Operations Report
This report lists all fully active service operations — those with at least one active version, at least one active routing, and at least one activ…
New to psLens? This page documents one specific report. To see how it runs in the product, what
the output looks like, and how teams use it in practice, start with a live walkthrough.
This report lists all fully active service operations — those with at least one active version, at least one active routing, and at least one active handler — along with their permission lists that grant access.
The report pulls all service operations with their child records (versions, handlers, routings) in a single paginated hierarchical query, then bulk-fetches PSAUTHWS to map each operation to its permission lists. Operations are filtered to those with at least one active version, routing, and handler before being written to the report. For a system with N service operations and A PSAUTHWS rows, expect roughly N/50 + A/300 API calls. A site with 500 operations and 2000 auth rows runs in about 17 calls.
Report Output
The generated report contains:
Header with database name and generation timestamp
Summary with total operations and count of active operations
Active handlers table (handler name, type, app class path)
Active routings table (routing name, sender, receiver, generated flag)
Permission lists table (linked to permission list detail pages)
Interpreting Results
Operations with no permission lists may be inaccessible or may rely on other authentication mechanisms
Operations with ~~ANY~~ sender routings accept messages from any external node. Review whether this is intentional
Operations with no active handlers may indicate stale configuration
Operations with many permission lists have broad access. Verify this is appropriate
Use Cases
IB inventory — Get a complete list of all active service operations and their configuration
Security review — Identify which operations are accessible and by whom
Cleanup — Find operations with no active handlers or routings that may be candidates for deactivation
9.3.5 - Active Service Operations with No Routings
This report identifies active service operations that have no active routing definitions.
New to psLens? This page documents one specific report. To see how it runs in the product, what
the output looks like, and how teams use it in practice, start with a live walkthrough.
This report identifies active service operations that have no active routing definitions. These operations have at least one active version but cannot process any messages because no routing is configured to direct traffic to or from them. Usually this means a half-finished setup or an operation that should have been deactivated when its routings were.
What It Detects
An operation is flagged when:
It has at least one active version (ACTIVE_FLAG = 'A' in PSOPRVERDFN)
It has zero active routings (EFF_STATUS = 'A' in PSIBRTNGDEFN)
The report also shows the count of inactive routings, which helps distinguish between operations that never had routings and those whose routings were intentionally deactivated.
1. Paginate through all PSOPERATION records
   (batches of 300)
        |
        v
2. For each operation, fetch full details
   (versions, routings)
        |
        v
3. Filter to operations with at least one
   active version (ACTIVE_FLAG = 'A')
        |
        v
4. Exclude operations that have any active
   routing (EFF_STATUS = 'A')
        |
        v
5. Generate summary table of flagged operations
Report Output
The generated report contains:
Summary with total operations, active operations, and count flagged with no routings
Flagged operations table with operation name (linked to detail page), service, type, active version count, inactive routing count, and description
Recommendations for remediation actions
Interpreting Results
Operations with zero total routings likely never had routings configured. These may be newly created or inherited operations that were never fully set up
Operations with inactive routings only suggest the routings were intentionally deactivated. Verify whether the operation itself should also be deactivated
Async operations without routings are especially notable since they rely on routings for subscription/publication contracts
Sync operations without routings cannot receive inbound requests
Recommendations
If the operation is needed: Create and activate routing definitions to enable message processing
If the operation is not needed: Inactivate all versions to keep the IB configuration clean
If routings exist but are inactive: Review whether deactivation was intentional or an oversight
9.3.6 - Unauthenticated Node Service Operations
This report identifies active nodes with no authentication configured (AUTHOPTN=‘N’) and then determines which fully-active service operations are …
New to psLens? This page documents one specific report. To see how it runs in the product, what
the output looks like, and how teams use it in practice, start with a live walkthrough.
This report identifies active nodes with no authentication configured (AUTHOPTN='N') and then determines which fully-active service operations are reachable through those nodes. A service operation is considered fully active only when it meets all three criteria: an active version, an active routing, and an active handler.
Any operation reachable through one of these nodes can be invoked without credentials.
What It Captures
For each active node with no authentication:
Node metadata (name, description, user ID)
All fully-active service operations routed through that node
The routing that links the operation to the node
Operation type (REST/HTTP Post, Sync/Async)
Tables Queried
PSMSGNODEDEFN — Message Node Definitions
Paginated to discover all nodes. Filtered to active nodes with AUTHOPTN = 'N'.
1. Paginate through all PSMSGNODEDEFN records
   -> Filter to active nodes with AUTHOPTN = 'N'
   -> Build set of no-auth node names
        |
        v
2. Paginate through all PSOPERATION records
   (batches of 300)
        |
        v
3. For each operation, fetch full details
   (versions, handlers, routings)
        |
        v
4. Filter to "fully active" operations:
   - At least one active version
   - At least one active handler
   - At least one active routing
        |
        v
5. Check if any active routing references
   a no-auth node (as sender OR receiver)
        |
        v
6. Generate report grouped by node
Report Output
The generated report contains:
Header with database name and generation timestamp
Summary with counts of no-auth nodes, total operations checked, and matching operations
No-Auth Nodes table listing each unauthenticated node with its user ID and count of reachable operations
Per-node sections with a table of all service operations accessible through that node, including operation type and routing name
Recommendations for remediation
Interpreting Results
Nodes with many accessible operations are higher risk and should be prioritized for remediation
The User ID on each node indicates what PeopleSoft user context is used for operations through that node. Review its privileges
REST operations are typically more easily exploitable from external systems than HTTP Post (SOAP) operations
If no nodes are found with AUTHOPTN='N', the report exits early with a clean result
Recommendations
Configure authentication (AUTHOPTN = 'P' or 'C') on all active nodes
Set internal and/or external passwords on nodes that require password authentication
Review the PeopleSoft user ID associated with each no-auth node for excessive privileges
Consider deactivating routings that should not be accessible without authentication
This report identifies active synchronous service operations that have active routings where message detail logging is disabled.
New to psLens? This page documents one specific report. To see how it runs in the product, what
the output looks like, and how teams use it in practice, start with a live walkthrough.
This report identifies active synchronous service operations that have active routings where message detail logging is disabled. When logging is off on a sync routing, transaction data is not recorded in the IB logs, making it impossible to troubleshoot failures or audit message traffic.
What It Detects
A routing is flagged when all three conditions are met:
The service operation is synchronous (RTNGTYPE = 'S' in PSOPERATION)
It has at least one active version (ACTIVE_FLAG = 'A' in PSOPRVERDFN)
An active routing (EFF_STATUS = 'A' in PSIBRTNGDEFN) has logging disabled (LOGMSGDTLFLG = '2')
Tables Queried
PSOPERATION — Service Operation Definitions
Paginated to discover all operations, filtered to synchronous only.
Message detail logging flag (0=Header, 1=Header+Detail, 2=No Logging)
Flagged when '2' (No Logging)
Data Flow
1. Paginate through all PSOPERATION records
   (batches of 300)
        |
        v
2. For each operation, fetch full details
   (versions, routings)
        |
        v
3. Filter to synchronous operations with at
   least one active version
        |
        v
4. Check each active routing for LOGMSGDTLFLG
   Flag routings where value is '2' (No Logging)
        |
        v
5. Generate table of flagged routings
Report Output
The generated report contains:
Summary with total operations, active sync operations, sync with active routings, and count of routings without logging
Flagged routings table with operation name (linked to detail page), service, routing name, sender node, receiver node, and description
Recommendations for enabling logging
Interpreting Results
High count of flagged routings may indicate a blanket policy of disabling logging. Consider enabling it at least for critical operations
Generated routings (auto-created by PeopleSoft) often have logging disabled by default. Review whether these carry important traffic
Custom routings without logging suggest an intentional decision that should be validated with the integration team
Recommendations
Enable logging: In PeopleTools > Integration Broker > Integration Setup > Routings, set the “Log Detail” flag to “Header Only” (0) or “Header & Detail” (1) for each flagged routing
Performance consideration: Header-only logging has trivial overhead. Header+Detail can balloon the IB log tables on high-volume routings — turn it on for the ones you actually want to troubleshoot
Review periodically: Logging may be intentionally disabled during high-volume batch processing. Re-enable after batch windows complete
9.3.8 - Daily IB Volume/Usage Report
This report shows Integration Broker message volume for a configurable date range. It breaks down traffic into four categories:
New to psLens? This page documents one specific report. To see how it runs in the product, what
the output looks like, and how teams use it in practice, start with a live walkthrough.
This report shows Integration Broker message volume for a configurable date range. It breaks down traffic into four categories:
Async Operations — publication headers (PSAPMSGPUBHDR), the top-level async message record
Publication Contracts — per-subscriber delivery records (PSAPMSGPUBCON)
Subscription Contracts — subscription handler execution records (PSAPMSGSUBCON)
Synchronous Operations — logged sync transactions (PSIBLOGHDR). Only operations with logging enabled appear here
Each category shows counts grouped by operation name and status (Done, Error, New, etc.), sorted by total volume descending.
Parameters
Parameter
Default
Description
from_date
Today (YYYY-MM-DD)
Start of the date range (inclusive)
to_date
Today (YYYY-MM-DD)
End of the date range (inclusive)
Leave both parameters blank to report on today’s traffic. Set a range such as from_date=2026-01-01 and to_date=2026-01-31 for a monthly view.
Tables Queried
PSAPMSGPUBHDR — Async Operation Headers
The master record for each async IB message (one row per publication).
Field
Description
Filter
IB_OPERATIONNAME
Service operation name
Grouped by
STATUSSTRING
Message status (DONE, ERROR, NEW, etc.)
Grouped by
CREATEDTTM
When the record was created
Date range filter
PSAPMSGPUBCON — Publication Contracts
One row per subscriber for each async publication.
Field
Description
Filter
IB_OPERATIONNAME
Service operation name
Grouped by
STATUSSTRING
Contract status
Grouped by
CREATEDTTM
When the record was created
Date range filter
PSAPMSGSUBCON — Subscription Contracts
One row per subscription handler execution.
Field
Description
Filter
IB_OPERATIONNAME
Service operation name
Grouped by
STATUSSTRING
Contract status
Grouped by
CREATEDTTM
When the record was created
Date range filter
PSIBLOGHDR — Sync Operation Log Headers
Logged synchronous transaction records. Only populated when message detail logging is enabled on the routing.
Field
Description
Filter
IB_OPERATIONNAME
Service operation name
Grouped by
STATUSSTRING
Transaction status
Grouped by
PUBLISHTIMESTAMP
When the transaction was processed
Date range filter
Data Flow
1. Fetch async operation summary (PSAPMSGPUBHDR)
   GROUP BY IB_OPERATIONNAME, STATUSSTRING
        |
        v
2. Fetch publication contract summary (PSAPMSGPUBCON)
   GROUP BY IB_OPERATIONNAME, STATUSSTRING
        |
        v
3. Fetch subscription contract summary (PSAPMSGSUBCON)
   GROUP BY IB_OPERATIONNAME, STATUSSTRING
        |
        v
4. Fetch sync operation summary (PSIBLOGHDR)
   GROUP BY IB_OPERATIONNAME, STATUSSTRING
        |
        v
5. Pivot each dataset into a per-operation table
   with status columns, sorted by total descending
Report Output
The generated report contains:
Summary table with total message counts for each of the four categories
Async Operations table — one row per operation, columns for each status (Done, Error, New, etc.) plus Total
Publication Contracts table — same format
Subscription Contracts table — same format
Synchronous Operations table — same format, with a note that only logging-enabled operations appear
Interpreting Results
Async Operations
Done — successfully processed and delivered
Error — failed; check the IB Monitor for details
New — queued but not yet processed (may indicate a stuck dispatcher)
A high Error count relative to Done signals a systemic integration problem. A high New count with no decrease over time indicates the IB dispatcher may be stopped.
Publication vs Subscription Contracts
Each async publication spawns one publication contract (PSAPMSGPUBCON) per subscribing node
Compare day-over-day volumes — sudden drops may indicate a sending system stopped, not just low traffic
9.4 - Process Scheduler
Process Scheduler reports for PeopleSoft: recurring process exports, critical process monitoring, and batch schedule analysis.
Three reports against PSPRCSRQST and PRCSRECUR: monitor/alert on recurring schedules, diff a current schedule against a saved baseline, and verify named processes have actually run in the last N hours.
Compares the current batch schedule against a previously exported baseline to detect added, removed, or changed processes
9.4.1 - Recurring Processes Schedule Comparison
This report compares the current batch schedule against a previously exported baseline from the ‘Recurring Schedule & Drift Monitoring’ report.
New to psLens? This page documents one specific report. To see how it runs in the product, what
the output looks like, and how teams use it in practice, start with a live walkthrough.
Report ID:recurring-processes-compareCategory: Process Scheduler
Purpose
This report compares the current batch schedule against a previously exported baseline from the “Recurring Schedule & Drift Monitoring” report. It identifies processes that have been added, removed, or changed since the baseline was captured, helping you detect unintended schedule modifications after migrations, upgrades, or configuration changes.
How It Works
The report requires a baseline — a previously run “Recurring Schedule & Drift Monitoring” report. It parses the baseline report’s markdown table to extract the saved schedule, then fetches the current recurring processes from the database and compares the two sets.
Comparison Logic
Processes are matched by a composite key of:
Process Name (PRCSNAME)
Process Type (PRCSTYPE)
Operator ID (OPRID)
Recurrence Name (RECURNAME)
The report detects three types of differences:
Status
Meaning
+ Added
Process exists in current schedule but not in baseline
- Removed
Process was in baseline but is no longer queued
~ Changed
Process exists in both but the server assignment has changed
Table Queried
PSPRCSRQST — Process Request Table
Fetched via GetQueuedRecurringProcesses (batches of 300).
Field
Description
PRCSNAME
Process name
PRCSTYPE
Process type (e.g., SQR, Application Engine)
OPRID
Operator ID that owns the schedule
RUNCNTLID
Run control ID
RECURNAME
Recurrence name/schedule
SERVERNAMERUN
Assigned process scheduler server
RUNDTTM
Scheduled run date/time
The baseline data is parsed from the markdown table in the previous “Recurring Schedule & Drift Monitoring” report output — no additional database query is needed for the baseline.
Data Flow
1. Load baseline report output by Run ID
   -> Parse markdown table to extract baseline processes
        |
        v
2. Fetch current recurring processes from PSPRCSRQST
   via GetQueuedRecurringProcesses (batches of 300)
        |
        v
3. Build lookup maps for both baseline and current sets
   using composite key: PrcsName|PrcsType|OpRid|RecurName
        |
        v
4. Compare sets to find:
   - Removed: in baseline but not in current
   - Added: in current but not in baseline
   - Changed: in both but server assignment differs
        |
        v
5. Generate comparison report with summary and diff table
Parameters
Parameter
Required
Description
baseline_run_id
Yes
Select a previously completed “Recurring Schedule & Drift Monitoring” report to use as the baseline
Select the baseline from the dropdown list. If no baseline runs are found, you must first run the “Recurring Schedule & Drift Monitoring” report.
Report Output
The generated report contains:
Header with database name, generation timestamp, and baseline Run ID
Summary with baseline process count, current process count, and total differences found
Difference breakdown with counts of added, removed, and changed processes
Recommendations for handling each type of difference
If no differences are found, the report confirms that the current schedule matches the baseline.
Interpreting Results
Removed processes may indicate an intentional change or an accidental deletion during a migration. Verify with the batch schedule owner before dismissing.
Added processes should be documented and reviewed to ensure they follow naming and scheduling standards.
Changed processes (server assignment changes) are common after environment migrations and should be verified to ensure processes are running on the correct scheduler server.
A clean comparison (no differences) confirms that the batch schedule survived a migration or change window intact.
Recommendations
Export a baseline (“Recurring Schedule & Drift Monitoring”) before any major environment change (migration, refresh, upgrade)
Run this comparison report immediately after the change to verify the schedule
Investigate all removed processes — they may need to be re-created manually
For added processes, verify they were intentionally scheduled and follow your naming conventions
For server assignment changes, confirm the target scheduler server is appropriate for the process workload
9.4.2 - Recurring Schedule & Drift Monitoring
This report lists all currently queued recurring batch processes from the PeopleSoft Process Scheduler and acts as the source for schedule drift mo…
New to psLens? This page documents one specific report. To see how it runs in the product, what
the output looks like, and how teams use it in practice, start with a live walkthrough.
Report ID:recurring-processesCategory: Process Scheduler
Purpose
This report lists all currently queued recurring batch processes from the PeopleSoft Process Scheduler and acts as the source for schedule drift monitoring. When scheduled with the On Change (on_change) notification mode, it automatically alerts on changes (added, removed, or server assignment changes) compared to a baseline run.
It captures the batch schedule configuration so it can be preserved for disaster recovery, environment migrations, or operational documentation.
The report answers: “What recurring processes are currently scheduled, who set them up, with what run control, on what recurrence, and on which server?”
What It Captures
For each queued process with a recurrence assigned:
OPRID. The operator who scheduled the process
RUNCNTLID. The run control ID used
RECURNAME. The recurrence definition controlling the schedule
SERVERNAMERUN. The Process Scheduler server assigned to run it
Process Name and Type. The process definition being executed
Additionally, the report fetches and displays the schedule details for each unique recurrence found (type, days, time window, repeat interval).
Tables Queried
PSPRCSRQST — Process Request Instances
The primary table for process scheduler requests.
Field
Description
Filter
PRCSINSTANCE
Unique process instance number
PRCSNAME
Process definition name
PRCSTYPE
Process type (SQR, AE, COBOL, etc)
OPRID
Operator who scheduled the process
RUNCNTLID
Run control ID
RUNSTATUS
Current run status
Filtered to 5 (Queued)
SERVERNAMERUN
Assigned server
RECURNAME
Recurrence name
Filtered to non-blank
RUNDTTM
Scheduled run date/time
PRCSRECUR — Recurrence Definitions
Looked up for each unique recurrence found to display schedule details.
Field
Description
RECURNAME
Recurrence name (primary key)
RECURDESCR
Description
RECURTYPE
Type: 2=Daily, 4=Weekly, 6=Monthly, 8=Custom
RUN{DAY} flags
Which days of the week to run
BEGINDTTM
Schedule start date/time
ENDDTTM
Schedule end date/time
REPEATRECURRENCE
Repeat interval value
REPEATUNIT
Repeat unit: 0=Minutes, 1=Hours
Data Flow
1. Query PSPRCSRQST where RECURNAME <> ' ' AND RUNSTATUS = 5
   Paginate through all results (batches of 300)
        |
        v
2. Collect unique RECURNAME values
   For each, fetch PRCSRECUR via GetRecurrenceByName
        |
        v
3. Generate Markdown report:
   - Summary counts
   - Main table of all queued recurring processes
   - Recurrence schedule details section
Report Output
The generated report contains:
Header with database name and generation timestamp
Summary with total process count, unique recurrences, unique operators, unique servers
Process Table with Process Name, Type, OPRID, Run Control ID, Recurrence, Server, Run Date/Time
Recurrence Details for each unique recurrence: type, scheduled days, start/end dates, repeat interval, duration
Parameters
This report has no configurable parameters.
Interpreting Results
Each row represents a process request that is currently queued with a recurring schedule
The same process may appear multiple times if scheduled by different operators or with different run controls
If a server column shows “(any)”, the process can run on any available Process Scheduler server
The Recurrence Details section shows how often each schedule runs
Use Cases
Disaster Recovery. Document the batch schedule before a system outage so it can be recreated
Environment Migration. Capture batch schedules before refreshing or migrating an environment
Audit. Review who has scheduled recurring processes and on which servers
Operational Documentation. Maintain a record of the production batch schedule
9.4.3 - Process Run Check
This report verifies that a set of critical batch processes have run successfully within a configurable time window.
New to psLens? This page documents one specific report. To see how it runs in the product, what
the output looks like, and how teams use it in practice, start with a live walkthrough.
Report ID:process-run-checkCategory: Process Scheduler
Purpose
This report verifies that a set of critical batch processes have run successfully within a configurable time window. It checks each process for a recent successful completion and flags any that are missing or have not completed successfully.
The report answers: “Have my critical processes run successfully in the last N hours?”
Parameters
Parameter
Default
Description
processes
(none)
Comma-separated list of process names to check (e.g., PSXPIDX,PRCSJOBPURGE,PSRUNSTATS). Required. Maximum 50 processes.
hours
24
Time window in hours. The report checks for successful runs within this many hours from now.
PRCSNAME = '{name}', ordered by PRCSINSTANCE DESC, limit 1
Success check
PRCSNAME, PRCSINSTANCE, RUNSTATUS, BEGINDTTM
PRCSNAME = '{name}' AND RUNSTATUS = 9 AND BEGINDTTM >= cutoff, limit 1
Data Flow
1. Parse process names from comma-separated parameter
   Calculate cutoff time (now - hours)
        |
        v
2. For each process name:
   a. Query PSPRCSRQST for most recent run (any status)
   b. Query PSPRCSRQST for most recent successful run (status=9) since cutoff
        |
        v
3. Sort results: failures first, then passes
        |
        v
4. Generate Markdown report:
   - Summary with pass/fail counts
   - Results table
   - Recommendations for failures
Report Output
The generated report contains:
Header with database name, generation timestamp, and time window
Summary showing how many processes passed vs. failed
Results Table with columns: Status (PASS/FAIL), Process Name, Last Run Time, Last Run Status, Successful Run in Window
Recommendations section for any failing processes with details about their last run
Interpreting Results
PASS. The process had at least one successful run (RUNSTATUS=9) within the time window
FAIL. No successful run was found within the time window. This could mean:
The process ran but ended in error or another non-success status
The process has not run at all within the window
The process has never run (no history in PSPRCSRQST)
The “Last Run Time” and “Last Run Status” columns show the most recent run regardless of status, so you can see if it ran but failed
Use Cases
Morning Operations Check. Verify that overnight batch processes completed successfully before the business day starts
Critical Process Monitoring. Confirm that essential processes (search index builds, security syncs, integration processes) are running on schedule
Post-Maintenance Verification. After system maintenance, verify that all scheduled processes have resumed and are completing successfully
SLA Compliance. Document that required processes are running within expected timeframes
9.4.4 - Stalled Recurrences
This report identifies scheduled recurring processes that have completed a run recently but do not have a subsequent scheduled instance.
New to psLens? This page documents one specific report. To see how it runs in the product, what
the output looks like, and how teams use it in practice, start with a live walkthrough.
Report ID:stalled-recurrencesCategory: Process Scheduler
Purpose
This report identifies scheduled recurring processes that have completed a run recently but do not have a subsequent scheduled instance.
In PeopleSoft, recurring batch schedules are kept active by the Process Scheduler, which automatically schedules the next run when the current run starts or completes. However, issues like database refreshes, scheduler outages, cancellations, or errors can cause a schedule to stall without generating a future instance. This report lists all such stalled recurring processes to ensure they can be resumed.
The report answers: “Which of my recurring batch processes have stopped scheduling?”
Parameters
Parameter
Default
Description
lookback_days
14
The window in days. The report checks for recurring processes that completed their last run within this window but have no future runs.
Tables Queried
PSPRCSRQST — Process Request Instances
The report queries PSPRCSRQST to fetch historical and future instances that have a recurrence name assigned:
1. Calculate the lookback cutoff date based on 'lookback_days'
        |
        v
2. Query PSPRCSRQST for all requests with a recurrence name since the cutoff date
        |
        v
3. Group requests by (PRCSNAME, RUNCNTLID, OPRID, RECURNAME)
        |
        v
4. For each group:
   - Identify active/pending instances (Queued, Blocked, Hold, Pending, Initiated, Processing, Posting, Restart)
   - Identify completed instances (Success, Error, Cancelled, etc.)
   - If there is at least one completed run, but ZERO active/pending runs:
     - Mark the recurrence as stalled
     - Find the latest completed instance
        |
        v
5. Generate the Markdown report:
   - Summary count of stalled recurrences
   - Table of stalled recurrences with last run status and links
   - Troubleshooting recommendations
Report Output
The generated report contains:
Header displaying the database name, run ID, and lookback window.
Summary showing the count of stalled recurrences detected.
Results Table with columns: Process Name, Recurrence, User, Run Control, Last Instance, Last Status, and Last Run Date/Time.
Recommendations detailing the resolution steps.
Interpreting Results
If a recurrence is listed in the report, it has stopped running. Check the Last Status column:
Error / Not Successful / Unable to Post: The schedule stopped due to a process failure. The scheduler may not have been able to queue the next run, or the recurrence was stopped.
Success / Success with Warning / Cancelled: The process ran or was cancelled but did not reschedule. This could happen if the recurrence ended naturally (reached its end date), or if it was manually cancelled and not rescheduled.
Five reports against PSPROJECTDEFN, PSPROJECTITEM, PSPCMTXT, and the per-object definition tables. Use them to inventory customizations, compare a project across two databases, diff PeopleCode in an uploaded project file against a live database, find every reference to a Message Catalog entry, and identify target projects that are missing or newer before a database refresh.
For an uploaded project XML, emits per-object file source, database source, and a line-level diff for every PeopleCode program. LLM-friendly.
9.5.1 - Customized Objects Inventory
This report provides a complete inventory of all customized PeopleSoft objects across ten major object types.
New to psLens? This page documents one specific report. To see how it runs in the product, what
the output looks like, and how teams use it in practice, start with a live walkthrough.
This report provides a complete inventory of all customized PeopleSoft objects across ten major object types. It answers the question: “What did we customize in this environment?”
Anything not stamped PPLSOFT is something you’ll have to defend during an upgrade.
Definition of “Customized”
An object is considered customized if its LASTUPDOPRID (last updated by operator) is notPPLSOFT. Objects delivered by Oracle PeopleSoft are stamped with PPLSOFT when installed. Any object modified by a customer operator will have a different value.
Object Types Covered
Object Type
PeopleSoft Table
psLens Detail Page
Records
PSRECDEFN
/records/{name}
Fields
PSDBFIELD
/fields/{name}
Pages
PSPNLDEFN
/pages/{name}
Components
PSPNLGRPDEFN
/components/{name}
Menus
PSMENUDEFN
/menus/{name}
Application Packages
PSPACKAGEDEFN
/apppackages/{name}
Application Engines
PSAEAPPLDEFN
/appengines/{name}
SQL Objects
PSSQLDEFN
/sqlobjects/{name}
Service Operations
PSOPERATION
/serviceoperations/{name}
Roles
PSROLEDEFN
/roles/{name}
Data Flow
1. For each object type:
   Query the primary table with LASTUPDOPRID <> 'PPLSOFT'
   (using paginated batches of 500 rows)
        |
        v
2. Collect all results across all pages
        |
        v
3. Generate summary table with counts per object type
        |
        v
4. Generate per-type detail sections with links to psLens detail pages
Report Output
The report contains:
Header with database name, generation timestamp, and definition of “customized”
Summary table showing the count of customized objects per type and a grand total
Detail section per object type, each with a markdown table listing:
Object name (linked to the psLens detail page)
Description (where available)
Object Owner ID (where available)
Last Updated By operator
Last Updated timestamp
Parameters
This report has no configurable parameters.
Interpreting Results
High counts in a specific object type indicate heavy customization in that area. This increases upgrade risk for those object types.
Object Owner ID (OBJECTOWNERID) shows the functional owner of the object (e.g., a product line or module). A customer-specific owner ID confirms the object is a true customization vs. a third-party product extension.
Last Updated By shows which operator last touched the object. Objects last updated by a system batch operator may have been auto-modified vs. intentionally customized.
Objects with no entry in a section means that type has no customizations, which is worth noting for upgrade planning.
Use Cases
Pre-upgrade assessment. Run this report before a PeopleTools or application upgrade to understand the full scope of customizations that will need to be reviewed and re-applied.
Customization audit. Share with Oracle support or an implementation partner to get an accurate picture of what has been changed in the environment.
Developer handoff. Use as a starting inventory when onboarding new team members or transferring system ownership.
9.5.2 - Project Cross-Database Comparison
This report compares a PeopleSoft project’s definition and items across two databases. It identifies:
New to psLens? This page documents one specific report. To see how it runs in the product, what
the output looks like, and how teams use it in practice, start with a live walkthrough.
This report compares a PeopleSoft project’s definition and items across two databases. It identifies:
Objects that exist only in the source database (not yet migrated to target)
Objects that exist only in the target database (previously migrated, now deleted in source)
Objects in both databases where the item metadata (source status, target status, upgrade action, take action, copy done) differs
This is primarily a migration and change management tool. Use it to verify that a project migration completed correctly, to audit what is in DEV vs. TEST vs. PROD, or to identify drift between environments.
The report surfaces added, removed, and changed project items so migration drift is visible in one artifact
What It Detects
Items Only in Source
Objects that are in the project in the source database but not in the target. These are typically items that have not been migrated yet or were added to the project after the last migration.
Items Only in Target
Objects that are in the project in the target database but not in the source. These may indicate objects that were removed from the project definition in the source after migration, or items migrated separately.
Items with Differences
Objects present in both databases but with different metadata values:
Field
Description
Source Status
Whether the object was copied from the source (Copied, Not Copied, etc.)
Target Status
Whether the object was copied to the target
Upgrade Action
The configured upgrade action for this item
Take Action
Whether psLens will take action on this item during copy
Copy Done
Whether the copy operation completed for this item
Project Definition Comparison
In addition to items, the report compares the project header fields:
Description and long description
Version number
Last updated timestamp and operator
Owner ID and release label
Tables Queried
PSPROJECTDEFN — Project Definitions
Field
Description
PROJECTNAME
Project name (primary key)
DESCR
Short description
DESCRLONG
Long description
VERSION
Version number
LASTUPDOPRID
Last updated by
LASTUPDTTM
Last updated timestamp
OBJECTOWNERID
Object owner ID
RELEASELABEL
Release label
RELEASEDTTM
Release date/time
PSPROJECTITEM — Project Items
Field
Description
PROJECTNAME
Project name
OBJECTTYPE
Numeric object type code
OBJECTVALUE1-4
Object identifier fields (vary by type)
SOURCESTATUS
Copy-from status
TARGETSTATUS
Copy-to status
UPGRADEACTION
Configured upgrade action
TAKEACTION
Whether action will be taken
COPYDONE
Copy completion flag
Data Flow
1. Fetch project definition from Source DB
        |
        v
2. Fetch project definition from Target DB
        |
        v
3. Compare project header fields
   → Report differences
        |
        v
4. Fetch all project items from Source DB
        |
        v
5. Fetch all project items from Target DB
        |
        v
6. Build composite key maps for each item
   (ObjectType + ObjectValue1-4)
        |
        v
7. Find items only in source (not in target)
8. Find items only in target (not in source)
9. Find items in both with field differences
        |
        v
10. Generate Markdown report with summary + detail sections
Parameters
Parameter
Required
Description
projectName
Yes
The exact PeopleSoft project name to compare
targetDB
Yes
The name of the target database (as configured in psLens)
The source database is the database selected when running the report.
Report Output
The generated report contains:
Header with source and target database names, project name, and generation timestamp
Project Definition Comparison table showing any fields that differ between the two databases
Summary with counts: total items in source, total in target, only-in-source, only-in-target, with-differences, identical
Items Only in Source section, grouped by object type
Items Only in Target section, grouped by object type
Items with Differences table showing object type, name, field, source value, and target value
If the project does not exist in one of the databases, the report notes this and shows the available definition from the other database.
Interpreting Results
Items only in source are likely candidates for migration — they exist in your development or staging environment but have not been moved to the target yet.
Items only in target may indicate stale objects in the target environment that were removed from the project in source, or objects migrated separately outside this project.
Items with differences in Source/Target Status or Copy Done fields can indicate a migration that did not complete cleanly.
Project definition differences in Version or Last Updated can help confirm which database has the more recent project definition.
Use Cases
Pre-migration verification: Confirm which objects in a project have not yet been migrated to the next environment
Post-migration audit: Verify that all project items made it to the target cleanly
Environment drift detection: Identify objects that exist in PROD but not in DEV (or vice versa)
Change management documentation: Generate a Markdown report of exactly what changed between environments for a release
9.5.3 - Missing Projects Refresh Risk Report
This page documents the report used to audit project risk in a target database before a database refresh.
New to psLens? This page documents one specific report. To see how it runs in the product, what
the output looks like, and how teams use it in practice, start with a live walkthrough.
This page documents the report used to audit project risk in a target database before a database refresh.
Purpose
When refreshing a non-production PeopleSoft database (like TEST or DEV) with a copy of production (like PRD), code or metadata changes in TEST/DEV that have not yet been migrated to production are permanently deleted. This report identifies target database projects updated since a specific date that are missing or have older versions in the production database.
What It Detects
The report groups target projects into three risk categories based on their presence and versions in the source database:
High Risk: Missing in Source
Projects that exist in the target database but are completely missing in the source database. Overwriting the target database will delete these projects and their constituent objects.
Medium Risk: Newer in Target
Projects that exist in both databases, but the target database contains a newer version number or last updated timestamp. Overwriting the target database will revert these changes to the older version.
Low Risk: Identical or Older in Target
Projects that exist in both databases where the source database has an identical or newer version. These are safe to overwrite.
Tables Queried
PSPROJECTDEFN — Project Definitions
Field
Description
PROJECTNAME
Project name (primary key)
PROJECTDESCR
Short description
VERSION
Version number
LASTUPDOPRID
Last updated by
LASTUPDDTTM
Last updated timestamp
Parameters
Parameter
Required
Description
source_db
Yes
The name of the source/production database (e.g. PRD)
as_of_date
Yes
The date to filter target projects (updated on or after this date)
The target database is selected from the primary database dropdown in the report runner.
Use Cases
Pre-refresh audit: Run this report before restoring a production database backup to a non-production database to identify developer work that needs to be backed up or migrated.
Unmigrated work tracking: Audit what projects have been created or modified in a test database but not yet migrated to production.
9.5.4 - Project Import — PeopleCode Diff vs Database
You uploaded a PeopleSoft project XML on the Project Import page, and you want to know — line-by-line — how every PeopleCode program inside that fi…
New to psLens? This page documents one specific report. To see how it runs in the product, what
the output looks like, and how teams use it in practice, start with a live walkthrough.
You uploaded a PeopleSoft project XML on the Project Import page, and you want to know — line-by-line — how every PeopleCode program inside that file compares to the same program in a live database.
The Project Import results page itself shows a quick Same / Different / Not in DB badge per object (powered by a content-hash compare against PSPCMTXT). That’s enough for triage. When you need to see what actually changed, run this report; it emits a full markdown document with file source, database source, and a unified diff for every PeopleCode object that differs.
The output is designed to be reviewed by hand or fed directly to an LLM — the per-object structure (file block, DB block, diff block) is what most assistants need to reason about the change.
What It Compares
This report only looks at PeopleCode-bearing object types:
Record PeopleCode (type 8)
Menu PeopleCode (type 9)
Message PeopleCode (type 39)
App Engine PeopleCode (type 43)
Page PeopleCode (type 44)
Component PeopleCode (type 46)
Component Record PeopleCode (type 47)
Component Record Field PeopleCode (type 48)
Application Package PeopleCode (type 58)
For each PeopleCode item in the project, the report:
Reads the source from the uploaded XML (peoplecode_text node parsed at upload time).
Fetches the current source from the target database’s PSPCMTXT table, concatenating multi-row PCTEXT payloads in PROGSEQ order.
Normalizes both sides (line-ending normalization, trailing-whitespace strip, blank-line collapse) so cosmetic differences don’t show up as content changes.
Classifies the item as Same, Different, Not in DB, No XML Source, or Error.
For Different items, renders both sources and a line-level diff inline.
Non-PeopleCode object types in the same project are not included in this report — use the Project Import results page for those (it uses LASTUPDDTTM comparison, which is reliable for non-PeopleCode types).
Parameters
Parameter
Required
Default
Description
project_id
Yes
—
The file-store ID of the uploaded project. The Project Import results page provides a “PeopleCode Diff Report” button that pre-fills this.
max_objects
No
100
Cap on how many Different objects are rendered with full source + diff. Excess Different objects are mentioned in a footer line; raise the cap if you need them all inline. Prevents the report from blowing up on projects with hundreds of changed PeopleCode programs.
include_same
No
false
Set to true to append a table listing every PeopleCode object that matched. Off by default since this is usually the noise, not the signal.
The target database is the standard psLens database selector on the Reports page — the report runs against whichever database you have selected.
Output Structure
The report is a single markdown document with these sections in order:
Header — project name, source DB (from the XML export), target DB, export date, exporter ID, uploaded filename, upload time.
Summary — counts of Same / Different / Not in DB / No XML Source / Errors.
Different — one section per Different object containing:
File source — code fence with peoplecode language hint.
Database source — code fence with peoplecode language hint.
Line diff (file → DB) — code fence with diff language hint; lines unchanged on both sides appear with two-space prefix, removed-from-file lines with -, added-in-DB lines with +.
Not in Database — one section per item, with the file source rendered. These are typically programs the project would create on import.
No XML Source — table of programs the DB has but the XML didn’t inline. Usually means the project listed the PJM entry without the PCM payload.
Errors — table of programs whose DB query failed, with the underlying error.
Same (optional, include_same=true) — table of matching programs.
Tips
Feed it to an LLM. The structure (file block + DB block + diff block per object) is what assistants need to reason about a change. Download the markdown and paste into your assistant of choice, or use the Download .md button on the report run page.
Pair with the Cross-Database Comparison report.project-compare covers two databases; this one covers file vs database. Different problems.
Run before a project import. Knowing exactly what will change in PeopleCode terms is the question this report answers — not “what does the timestamp say” but “what code lines will end up different.”
9.5.5 - Message Catalog Usages
This report searches the entire PeopleSoft database and codebase to locate every usage of a specific Message Catalog entry.
New to psLens? This page documents one specific report. To see how it runs in the product, what
the output looks like, and how teams use it in practice, start with a live walkthrough.
Report ID:msgcat-usagesCategory: Objects / Development
Purpose
This report searches the entire PeopleSoft database and codebase to locate every usage of a specific Message Catalog entry. It answers the question: “If I modify or delete this message set or number, what fields, pages, or PeopleCode programs will be affected?”
Use this when someone hands you a (10, 12) error code, or when you want to know if anything still references a message before you delete it.
What Gets Searched
The report dynamically discovers and queries all tables that store message reference columns (MESSAGE_SET_NBR and MESSAGE_NBR), as well as the PeopleCode codebase.
Whitelisted Tables:
The report automatically queries all whitelisted database tables containing both message columns. The most common UI placement searched is:
PSPNLFIELD (Page Fields): Finds where message catalogs are assigned as static labels or tooltips on page controls.
PeopleCode Source (PSPCMTXT):
Searches the actual text of all compiled PeopleCode programs for function calls that fetch catalog messages. This includes:
MsgGet(...)
MsgGetText(...)
MsgGetExplainText(...)
Non-Whitelisted Tables:
Discovers any other database tables in the system that match the column criteria but are not currently in the SWS whitelisting table. The report generates a custom SQL snippet for each of these so developers can query them manually.
Report Output
The generated markdown report contains:
Summary Table: A overview of the tables searched, indicating which ones are whitelisted/accessible and the count of matches found in each.
Detailed Findings: Individual tables showing the key identifiers of matching objects, accompanied by deep links back to their respective psLens detail pages.
PeopleCode References: A detailed table listing the PeopleCode program type, record/package name, event, and field where the MsgGet call was found.
Manual Query Snippets: Ready-to-copy SQL queries for non-whitelisted tables.
Parameters
Parameter
Required
Type
Description
message_set_nbr
Yes
Integer
The Message Set number to search for (e.g., 10 or 20000).
message_nbr
No
Integer
The specific Message number. If omitted, the report returns all usages across every message in the specified Message Set.
Use Cases
Impact Analysis: Before updating a delivered or custom message text, run this report to ensure the change is appropriate for all context areas where it is displayed.
Error Debugging: If an application log or user screenshot displays an error message ID (e.g., (10, 12)), run the report with message_set_nbr = 10 and message_nbr = 12 to instantly locate the exact line of PeopleCode emitting the error.
Audit and Cleanup: Scan custom message sets (e.g., set numbers > 20000) to find orphan messages that are no longer referenced anywhere in code or page labels.
10 - Alerts
psLens real-time alerts for PeopleSoft: monitor long-running processes, process errors, stalled Integration Broker messages, failed logins, and more.
Alerts
Alert checks run on a 5-minute timer against every connected database. Findings appear on the dashboard with severity, and clear automatically when the underlying condition resolves. There is no acknowledge or dismiss.
Alerts surface on the dashboard with severity and context, then hand the operator into the exact follow-up view
How the Alert System Works
psLens runs a set of alert checks on a timer (default: every 5 minutes)
Each check queries one or more connected databases
If a check finds something worth noting, it creates alert items with a severity level
Alert results appear on the dashboard immediately
When the underlying issue resolves, the alert clears automatically on the next check cycle
Alerts always reflect the current state of the system.
Alert Severity Levels
Severity
Color
Meaning
Critical
Red
Something is actively wrong and needs immediate attention
Warning
Yellow
Something should be investigated. It may become a problem.
Info
Blue
Low-priority finding; worth noting but not urgent
Alert Data Retention
Alert results are stored for 15 minutes. This means the dashboard shows findings from the most recent check cycle. Once an issue is resolved and the next check runs cleanly, the alert data expires.
Configuring Alerts
Alerts are configured in config.yaml. You can:
Enable or disable the entire alert system (alerts.enabled)
Set how often checks run (alerts.intervalMinutes)
Enable or disable individual checks
Set thresholds for stalled/long-running checks
Set lookback windows for error checks
Exclude specific process names or IB operation names from checks
See Configuration for the full configuration reference.
Alert Categories
Browse alerts by category:
Process Scheduler: Long-running processes, errors, backlogged jobs, locked operators, critical process monitoring
Web Server / WebLib: Alerts when the PeopleSoft Web Server or WebLib endpoints fail to respond
Security: Failed login detection and authentication monitoring
Generic SWS Alerts: Define custom, queryable alert rules using PsoftQL against any whitelisted tables
See Alerts in Action
The catalog tells you what psLens checks. A live walkthrough shows what matters operationally: how alerts appear, how they clear, and how quickly your team can move from a card on the dashboard to the underlying problem.
Process Scheduler alerts: long-running processes, process errors, backlogged processes, queue latency, locked operators, and critical process monitoring.
Process Scheduler alerts monitor your PeopleSoft batch processing environment for errors, stalls, and missing critical runs.
Schedulers that have not updated their heartbeat status in PSSERVERSTAT recently
10.1.1 - Long-Running Processes
This alert finds Process Scheduler requests that are currently in Initiated or Processing status and have been running longer than their expected d…
New to psLens? This page documents one specific alert. To see how it appears on the dashboard,
what operators investigate, and how teams tune it, start with a live walkthrough.
Alert ID:long_running_processesCategory: Process Scheduler
Default threshold: Dynamic (4x rolling median, min 10 min baseline) or static fallback (20 minutes)
What This Alert Detects
This alert finds Process Scheduler requests that are currently in Initiated or Processing status and have been running longer than their expected duration.
Instead of relying solely on a static global threshold, psLens dynamically calculates an expected duration for each process using its own history:
It fetches the last 10 successful run durations for the specific process name (PRCSNAME).
It calculates the rolling median runtime of those successful runs.
It raises an alert if the current execution duration exceeds a multiple of the median (default: $4\times$ the median, with a minimum baseline of 10 minutes).
If no successful runs are found (e.g. a brand new process or a process that has never completed successfully), it falls back to the static global thresholdMinutes (default: 20 minutes).
A process that has been running for a long time may be stuck, consuming excessive server resources, or waiting on a lock or resource that will never become available.
Severity Logic
Condition
Severity
Running longer than dynamic threshold (or static fallback)
Warning
For example:
If a process usually runs in 3 minutes: median is 3m. $4\times 3 = 12$ minutes. The alert triggers if it runs for 12 minutes or more.
If a process usually runs in 1 minute: median is 1m. $4\times 1 = 4$ minutes. Since this is below the 10-minute minimum baseline, the baseline is used: the alert triggers if it runs for 10 minutes or more.
If a process has no history: fallback is used. The alert triggers if it runs for 20 minutes or more.
What Gets Checked
The alert queries the Process Scheduler request table for processes in run status 6 (Initiated) or 7 (Processing). For each result, it calculates how long the process has been running based on its BeginDttm (begin datetime) and the current server time.
Processes with no BeginDttm value are skipped (the process hasn’t truly started yet).
Alert Details
Each alert item includes:
Process name (PRCSNAME)
Process instance number
How long the process has been running (in minutes)
The rolling median runtime (if available, in minutes)
The operator who submitted the request
A link to the Process Monitor detail page for that instance
Configuration
alerts:checks:long_running_processes:enabled:truethresholdMinutes:20# Fallback static minutes when history is emptyanomalyMultiplier:4.0# Multiplier applied to rolling mediananomalyMinBaselineMinutes:10# Minimum baseline runtime before alertingexcludeProcesses:# Process names to skip- SOME_LONG_BATCH_JOB
Setting
Default
Description
thresholdMinutes
20
Fallback static minutes a process must be running to trigger an alert if no successful run history exists.
anomalyMultiplier
4.0
Multiplier applied to the rolling median duration to calculate the dynamic threshold.
anomalyMinBaselineMinutes
10
The minimum baseline duration in minutes. Dynamic thresholds are capped to be at least this value to prevent false alerts on very fast processes.
excludeProcesses
[]
List of process names to exclude from this check. Use for known long-running processes that are expected to take a long time.
How to Respond
Click the alert link to go directly to the Process Monitor entry for the flagged process
Review the process details: what it is, who submitted it, when it started
Check whether the process appears to be making progress or is stuck
If the process is genuinely stuck, you may need to cancel it from PeopleSoft’s Process Monitor
Investigate why it got stuck: look for locks, resource contention, or data issues
Tuning the Threshold
The right threshold depends on your environment. You can adjust anomalyMultiplier or anomalyMinBaselineMinutes globally or per-database to reduce noise, or use excludeProcesses to ignore specific jobs entirely.
10.1.2 - Process Errors
This alert finds Process Scheduler requests that have failed within a configurable lookback window.
New to psLens? This page documents one specific alert. To see how it appears on the dashboard,
what operators investigate, and how teams tune it, start with a live walkthrough.
Alert ID:process_errorsCategory: Process Scheduler
Default lookback: 24 hours
What This Alert Detects
This alert finds Process Scheduler requests that have failed within a configurable lookback window. It catches processes that ended in one of three error statuses:
Run Status
PeopleSoft Code
Meaning
Error
3
The process ended with an error condition
Not Successful
10
The process ran but reported a non-success result
Unable to Post
12
The process output could not be delivered
Severity Logic
Process Type
Status
Severity
Recurring (on a recurrence schedule)
Error (3), Not Successful (10), Unable to Post (12)
Critical
Non-Recurring (ad-hoc execution)
Error (3), Not Successful (10), Unable to Post (12)
Warning
Recurring Processes: Any failure fires Critical immediately.
Non-Recurring Processes: Fire Warning after the thresholdMinutes grace period.
Alert Details
Each alert item includes:
Process name and instance number
Run status label (Error, Not Successful, Unable to Post)
The operator who submitted the request
When the process ran
A link to the Process Monitor detail page for that instance
Configuration
alerts:checks:process_errors:enabled:truelookbackHours:24# How far back to look for failuresthresholdMinutes:15# Grace period buffer in minutes for non-recurring errorsexcludeProcesses:# Process names to skip- KNOWN_FLAKY_PROCESS
Setting
Default
Description
lookbackHours
24
Number of hours back to search for failed processes
thresholdMinutes
0
Grace period buffer (in minutes) for non-recurring process errors before they raise a Warning alert.
excludeProcesses
[]
List of process names to exclude from this check
How to Respond
Click the alert link to go directly to the Process Monitor entry for the failed process
Review the process details: run status, begin and end times, server
Look for output files or log information that might explain the failure
Check whether this is a one-time failure or a repeating issue
If the process needs to be rerun, submit a new request from PeopleSoft
Common Causes of Process Failures
Data errors: The process encountered unexpected data (null values, bad formats, constraint violations)
Resource issues: The server ran out of memory or disk space
Timeout: The process exceeded its allowed run time
Configuration problems: A required configuration parameter is missing or incorrect
Dependency failures: A process that runs after another failed because the first one didn’t complete correctly
Reducing Alert Noise
If certain processes fail regularly and you’re already tracking them separately, add them to excludeProcesses to keep the alert list focused on unexpected failures.
10.1.3 - Backlogged Processes
This alert finds Process Scheduler requests that are in Queued or Blocked status and whose scheduled run time (RUNDTTM) has already passed by more …
New to psLens? This page documents one specific alert. To see how it appears on the dashboard,
what operators investigate, and how teams tune it, start with a live walkthrough.
Alert ID:backlogged_processesCategory: Process Scheduler
Default threshold: 30 minutes
What This Alert Detects
This alert finds Process Scheduler requests that are in Queued or Blocked status and whose scheduled run time (RUNDTTM) has already passed by more than the configured threshold. This alert focuses exclusively on processes currently waiting to start. Once a process begins running, it is cleared from this alert and is instead tracked by the Queue Latency alert.
Severity Logic
Condition
Severity
Overdue by more than thresholdMinutes
Warning
Overdue by more than thresholdMinutes × 2
Critical
For example, with the default threshold of 30 minutes:
A process scheduled 40 minutes ago that is still queued → Warning
A process scheduled 65 minutes ago that is still queued → Critical
What Gets Checked
The alert queries the Process Scheduler request table for processes in run status 5 (Queued) or 18 (Blocked) whose RUNDTTM (scheduled run datetime) is in the past. For each result, it calculates how far past the scheduled time the process is based on RUNDTTM and the current server time.
Processes with no RUNDTTM value are skipped. Completed or active runs are skipped.
Alert Details
Each alert item includes:
Process name (PRCSNAME)
Process instance number
How long the process is overdue (in minutes)
Current run status (Queued or Blocked)
The operator who submitted the request
A link to the Process Monitor detail page for that instance
Configuration
alerts:checks:backlogged_processes:enabled:truethresholdMinutes:30# Minutes overdue before flagging as WarningexcludeProcesses:# Process names to skip- SOME_LOW_PRIORITY_JOB
Setting
Default
Description
thresholdMinutes
30
Minutes past the scheduled run time before a queued/blocked process triggers a Warning alert. Critical fires at 2× this value.
excludeProcesses
[]
List of process names to exclude from this check. Use for processes that are known to queue for a long time and are not a concern.
How to Respond
Click the alert link to go directly to the Process Monitor entry for the flagged process
Check whether the Process Scheduler server is running and accepting work
Look at how many processes are currently running on the server. It may have hit its concurrency limit
Check if the process type or class has reached its maximum allowed concurrent instances
For blocked processes, investigate what is blocking them (dependencies, server restrictions, etc.)
If the Process Scheduler server is down, restart it from PeopleSoft’s Process Scheduler administration
Tuning the Threshold
The right threshold depends on how busy your Process Scheduler is. In environments where many jobs are submitted at once, some queuing is normal. Set thresholdMinutes high enough to avoid false positives during peak batch windows but low enough to catch genuine problems. You can also use excludeProcesses to exclude specific low-priority processes that are known to queue for long periods.
10.1.4 - Locked OPRID Scheduled Processes
This alert finds queued or scheduled Process Scheduler requests where the submitting operator’s account (OPRID) is currently locked in PSOPRDEFN (A…
New to psLens? This page documents one specific alert. To see how it appears on the dashboard,
what operators investigate, and how teams tune it, start with a live walkthrough.
Alert ID:locked_oprid_processesCategory: Process Scheduler
What This Alert Detects
This alert finds queued or scheduled Process Scheduler requests where the submitting operator’s account (OPRID) is currently locked in PSOPRDEFN (ACCTLOCK = 1).
When an operator account is locked after a process has been queued, PeopleSoft will refuse to run the process, or run it under the locked account and immediately fail. PeopleSoft does not surface this condition anywhere obvious: Process Monitor shows the job queued, the operator’s user page shows them locked, but nothing connects the two. This alert does.
Common scenarios:
A service or batch account had its password expire and was locked
An employee left and their account was locked, but scheduled jobs were not transferred
A security lockout from failed login attempts affected a batch account
Severity Logic
All findings are reported at Warning severity. Every queued or scheduled process with a locked submitting account is flagged.
What Gets Checked
The alert queries PSPRCSRQST joined to PSOPRDEFN for process requests in Queued or Scheduled run status where the submitting OPRID has ACCTLOCK = 1.
Alert Details
Each alert item includes:
Process name and instance number
Submitting OPRID (with link to User detail page)
Current run status (Queued, Scheduled, etc.)
Scheduled run date/time
Recurrence name (if applicable)
Configuration
alerts:checks:locked_oprid_processes:enabled:trueexcludeProcesses:[]# Process names to ignore
Setting
Default
Description
excludeProcesses
[]
List of process names to exclude from this check
How to Respond
Click the alert link to open the Process Monitor detail page for the affected instance
Identify the locked OPRID shown in the alert
Navigate to the User detail page to review the account lock status
Either unlock the account (if appropriate) or re-queue the process under an active operator account
For recurring processes, update the recurrence definition to use a non-locked operator
Investigate why the account was locked. If it was a failed login lockout, check the Failed Logins alert for additional context
Tables Queried
Table
Description
PSPRCSRQST
Process Scheduler request queue
PSOPRDEFN
Operator definitions (user accounts)
10.1.5 - Queue Latency
This page documents the queue latency alert, which monitors the delay between a process’s scheduled run time and its actual start time.
New to psLens? This page documents one specific alert. To see how it appears on the dashboard,
what operators investigate, and how teams tune it, start with a live walkthrough.
Alert ID:queue_latencyCategory: Process Scheduler
Default threshold: 15 minutes
Queue Latency Alert in psLens showing processes with start delays exceeding the threshold
What This Alert Detects
This page documents the queue latency alert, which monitors the delay between a process’s scheduled run time and its actual start time. It queries the PSPRCSRQST table for processes that have started running or completed within the lookback window and calculates the delay as BEGINDTTM - RUNDTTM.
Severity Logic
Condition
Severity
Start delay more than thresholdMinutes
Warning
For example, with the default threshold of 15 minutes:
A process scheduled for 10:00 that started running at 10:20 → Warning
What Gets Checked
The alert queries the Process Scheduler request table (PSPRCSRQST) for processes whose BEGINDTTM (begin datetime) is in the past lookback window (default 24 hours). For each process, it calculates the difference between BEGINDTTM and RUNDTTM (scheduled run datetime).
Processes that have not started running yet (empty BEGINDTTM value) are skipped. Active queuing checks are handled by the backlogged_processes alert.
Alert Details
Each alert item includes:
Process name (PRCSNAME)
Process instance number
Start delay duration (in minutes)
Current run status (Initiated, Processing, Success, Error, etc.)
The operator who submitted the request
A link to the Process Monitor detail page for that instance
Configuration
alerts:checks:queue_latency:enabled:truethresholdMinutes:15# Minutes delay before flagging as WarninglookbackHours:24# Hours to look back for completed/running processesexcludeProcesses:# Process names to skip- LOW_PRIORITY_AE
Setting
Default
Description
thresholdMinutes
15
Minutes of start delay before a process triggers a Warning alert.
lookbackHours
24
Hours to look back for processes to verify.
excludeProcesses
[]
List of process names to exclude from this check. Use for processes that are known to delay and are not a concern.
How to Respond
Click the alert link to go to the Process Monitor entry for the flagged process.
Review the process server definition to identify if it is running and accepting work.
Check the max concurrent limits configured on the Process Scheduler server or category definitions.
Verify if other higher-priority processes occupied all available channels.
If the delay is caused by category stalls, adjust the process class concurrency settings.
Tuning the Threshold
Environments with heavy batch schedules may experience normal queue delays during peak hours. Set thresholdMinutes high enough to prevent alerts on minor delays but low enough to flag scheduler capacity bottlenecks or server category stalls.
10.1.6 - Process Run Check
This alert monitors configured critical processes and fires when one has not completed successfully within its expected time window.
New to psLens? This page documents one specific alert. To see how it appears on the dashboard,
what operators investigate, and how teams tune it, start with a live walkthrough.
Alert ID:process_run_checkCategory: Process Scheduler
What This Alert Detects
This alert monitors configured critical processes and fires when one has not completed successfully within its expected time window. It is the alert equivalent of the Process Run Check report. The difference is that this runs automatically on every check cycle and surfaces failures on the dashboard without any manual action.
Use this alert for processes that must run on a regular cadence, such as:
Nightly batch jobs that must complete before business hours
Data synchronization processes that run every few hours
Critical integrations that should run multiple times per day
Post-maintenance verification of essential processes
Severity Logic
Condition
Severity
Process has run recently but not successfully in the configured window
Warning
Process has no run history at all
Critical
Configuration
Process checks are configured per process name in config.yaml. Each entry specifies the process name and the number of hours within which a successful run is expected.
alerts:checks:process_run_check:enabled:trueprocessChecks:SOMEJOBNAME:24# Must run successfully within 24 hoursANOTHERJOB:8# Must run successfully within 8 hoursNIGHTLY_ETL:12# Must run successfully within 12 hours
Setting
Default
Description
processChecks
{}
Map of process name to expected run window in hours
If a process name is listed with 0 or a negative value, the check defaults to a 24-hour window.
What Gets Checked
For each configured process, psLens queries PSPRCSRQST for successful runs (RunStatus = 9 / Success) within the configured time window. If none are found, it then checks for any run history to determine severity:
No successful run in window + recent run history found: Warning
No run history at all: Critical
Alert Details
Each alert item includes:
Process name
Configured threshold (hours)
Last known run status (if any history exists)
Last known run time (if any history exists)
Link to the Process Definition detail page
How to Respond
Click the alert link to open the Process Definition detail page for the affected process
Review recent run history to understand what happened. Did the process run but fail, or did it not run at all?
Check the Process Scheduler server configuration if the process never ran
Investigate error logs if the process ran but ended in a failed state
If the process ran and succeeded but outside the expected window, consider adjusting the threshold in config.yaml
Tables Queried
Table
Description
PSPRCSRQST
Process Scheduler request queue and run history
10.1.7 - Process Scheduler Down
This alert triggers when any active Process Scheduler server registered in PSSERVERSTAT has not reported a status update (heartbeat) within the con…
New to psLens? This page documents one specific alert. To see how it appears on the dashboard,
what operators investigate, and how teams tune it, start with a live walkthrough.
Alert ID:process_scheduler_downCategory: Process Scheduler
Default threshold: 10 minutes
What This Alert Detects
This alert triggers when any active Process Scheduler server registered in PSSERVERSTAT has not reported a status update (heartbeat) within the configured amount of time.
Note
The alert automatically ignores servers whose status is explicitly set to "1" (Down) or "7" (Suspended - Offline), as these represent intentionally stopped or offline schedulers. It will only flag active server configurations (e.g., Running, Suspended, Error, Overloaded) that have stalled or stopped updating.
Severity Logic
Condition
Severity
Heartbeat stale by more than thresholdMinutes
Warning
Heartbeat stale by more than thresholdMinutes × 2
Critical
For example, with the default threshold of 10 minutes:
A scheduler that hasn’t heartbeat’ed for 12 minutes → Warning
A scheduler that hasn’t heartbeat’ed for 22 minutes → Critical
What Gets Checked
The alert queries the PSSERVERSTAT table to retrieve all server status definitions. For each active scheduler (status not Down/Offline), it calculates the elapsed time since its LASTUPDDTTM timestamp. If that time exceeds the configured threshold, the alert fires.
Alert Details
Each alert item includes:
Server name (SERVERNAME)
Current status code and friendly string status (e.g., Running, Error, Suspended)
Last heartbeat timestamp (LASTUPDDTTM)
Host name (SRVRHOSTNAME)
A detailed explanation of how long the heartbeat has been stale
A link to the Server Definition detail page for that server
Configuration
alerts:checks:process_scheduler_down:enabled:truethresholdMinutes:10# Minutes stale before flagging as WarningexcludeProcesses:# Server names (e.g., PSUNX, PSNT) to skip- PSUNX_OLD
Setting
Default
Description
thresholdMinutes
10
Minutes of stale heartbeat status updates before a scheduler triggers a Warning alert. Critical fires at 2× this value.
excludeProcesses
[]
List of server names to exclude from this check. Use for retired scheduler definitions that linger in PSSERVERSTAT but aren’t cleaned up.
How to Respond
Click the alert link to go directly to the Server Definition detail page for the affected scheduler.
Check the Host Name where the Process Scheduler daemon runs.
Access the server host and verify whether the Process Scheduler processes (e.g., psadmin, PSAESRV, etc.) are running.
Review the Process Scheduler logs (e.g., TUXLOG, SCHED_*.LOG) on the host machine to diagnose why the process has hung or crashed.
If the scheduler has hung, stop the process scheduler daemon and restart it using psadmin.
If the server definition is obsolete or decommissioned, consider deleting it in PeopleSoft Server Definitions configuration to clean up the PSSERVERSTAT row.
10.1.8 - No Process Completed
This alert fires when no process has successfully completed within the configured lookback window. It is a broad scheduler health check.
New to psLens? This page documents one specific alert. To see how it appears on the dashboard,
what operators investigate, and how teams tune it, start with a live walkthrough.
Alert ID:no_process_completedCategory: Process Scheduler
Default lookback: 1 hour
What This Alert Detects
This alert fires when no process has successfully completed within the configured lookback window. It is a broad scheduler health check. If nothing has finished successfully in the past hour, the Process Scheduler may be down, stalled, or not dispatching jobs.
This is distinct from the Process Run Check, which monitors specific named processes. This alert monitors overall scheduler activity.
Severity Logic
Condition
Severity
Zero successful completions in the lookback window
Warning
What Gets Checked
The alert queries PSPRCSRQST for any process with RunStatus = 9 (Success) and an end datetime within the lookback window. If no rows are returned, the alert fires.
Only one result is needed to resolve the alert. The check uses a limit of 1 for efficiency.
Alert Details
When firing, the alert produces a single item:
Summary: No process completed successfully in the last N hour(s)
Lookback hours used for the check
Configuration
alerts:checks:no_process_completed:enabled:truelookbackHours:1# How far back to look for completed processes
Setting
Default
Description
lookbackHours
1
How many hours back to look for a successfully completed process.
How to Respond
Check PeopleSoft’s Process Monitor to see if any processes are running, queued, or have recently completed
Verify the Process Scheduler server is running (PeopleSoft > PeopleTools > Process Scheduler > Servers)
If processes are queued but not running, the scheduler daemon may need to be restarted
If this fires regularly during off-hours when no jobs run, increase lookbackHours or disable the alert for those periods
Tuning
If your environment has periods where no batch jobs are expected to run (e.g., overnight maintenance windows), consider increasing lookbackHours to cover those gaps, or disable the alert entirely during those windows.
10.1.9 - Stalled Recurrences
This alert fires when a scheduled recurring process has finished a run recently (within the lookback window) but does not have a subsequent schedul…
New to psLens? This page documents one specific alert. To see how it appears on the dashboard,
what operators investigate, and how teams tune it, start with a live walkthrough.
Alert ID:stalled_recurrencesCategory: Process Scheduler
Default lookback: 336 hours (14 days)
What This Alert Detects
This alert fires when a scheduled recurring process has finished a run recently (within the lookback window) but does not have a subsequent scheduled instance.
In PeopleSoft, the Process Scheduler is responsible for scheduling the next run of a process based on its recurrence definition when the current one runs. If the scheduler is interrupted, a database is refreshed, or an error occurs during the scheduling process, the recurring job can fall off the schedule. This check identifies those occurrences so they do not go unnoticed.
Severity Logic
Condition
Severity
The latest completed run failed (status was Error, Not Successful, or Unable to Post) and no next run is scheduled
Critical
The latest completed run succeeded or was cancelled and no next run is scheduled
Warning
What Gets Checked
The alert queries PSPRCSRQST for all process requests that have a recurrence name assigned. It then groups these requests by:
Process Name (PRCSNAME)
Run Control ID (RUNCNTLID)
User ID (OPRID)
Recurrence Name (RECURNAME)
For each unique combination, if the latest instance has a completed status and there are no active/pending requests (such as Queued, Blocked, Hold, Pending, Initiated, or Processing) to follow, the recurrence is flagged as stalled.
Alert Details
When firing, the alert produces an item for each stalled recurrence:
Summary: Recurrence RECURNAME for PRCSNAME — Stalled (Last status: STATUS)
Details:
prcsName: The process name
runCntlId: The run control ID
oprid: The user ID that submitted the process
recurName: The recurrence definition name
lastInstance: The process instance number of the last run
lastRunStatus: The status of the last run (e.g. Success, Error)
lastRunDttm: The date and time the last run was scheduled
Configuration
alerts:checks:stalled_recurrences:enabled:truelookbackHours:336# How far back to look for completed runs (14 days)
Setting
Default
Description
lookbackHours
336
How many hours back to look for the last completed run of a recurrence.
How to Respond
Click the link in the alert detail to view the last process instance in the Process Monitor.
Check the logs for that instance if the status was an error.
If the recurrence should continue running, go to PeopleSoft and submit the process again on the same recurrence name using the matching User ID and Run Control ID.
If the recurrence has intentionally finished its life cycle (e.g., reached its end date), you can ignore the warning or configure the process in the exclusions list.
Integration Broker alerts monitor your PeopleSoft IB infrastructure for errors, stalled messages, volume anomalies, and sync exceptions.
Where to start. For a new environment, enable IB Down, IB Dispatcher Down, IB No Active Domain, and IB Operation Errors first. These four catch the conditions that produce the most pages. Add stalled checks after tuning thresholds for your operations. Volume checks need 24 hours of history before they fire usefully.
Message nodes registered as down in PSNODESDOWN with blocked transactions
10.2.1 - IB Operation Errors
This alert finds asynchronous Integration Broker operation instances that are in Error or Timeout status within a configurable lookback window.
New to psLens? This page documents one specific alert. To see how it appears on the dashboard,
what operators investigate, and how teams tune it, start with a live walkthrough.
This alert finds asynchronous Integration Broker operation instances that are in Error or Timeout status within a configurable lookback window. These are messages that attempted to process but did not complete successfully.
An IB operation instance represents a single execution of a Service Operation through the Integration Broker. When an instance errors, the message did not reach its destination. The original publish/subscribe data is preserved in the IB tables and can usually be resubmitted from the Service Operations Monitor.
Severity Logic
Status
Severity
Error
Critical
Timeout
Warning
Error status means the processing actively failed. Timeout means it ran out of time, which may be a transient issue but still warrants investigation.
Alert Details
Each alert item includes:
Operation instance ID
Service operation name
Status (Error or Timeout)
The originating node
When the instance was created
A link to the IB Monitor detail page
Configuration
alerts:checks:ib_operation_errors:enabled:truelookbackHours:24# How far back to look for errorsexcludeOperations:# Operation names to skip- SOME_NOISY_OPERATION
Setting
Default
Description
lookbackHours
24
Number of hours back to search for error/timeout instances
excludeOperations
[]
List of IB operation names to exclude from this check
How to Respond
Click the alert link to go to the IB Monitor entry for the failed operation
Review the error details. The IB Monitor shows the error message or exception
Check whether this is a configuration issue (wrong endpoint, auth failure) or a data issue
If the message needs to be reprocessed, you can do so from PeopleSoft’s Service Operations Monitor
If this is a recurring operation, investigate the root cause before errors pile up
Relationship to Other IB Alerts
This alert finds operations that have already ended in error. For operations that are stuck in progress, see IB Operations Stalled.
For similar alerts on publication and subscription contracts, see:
This alert finds asynchronous Integration Broker operation instances that are stuck in New or Working status and have been in that state longer tha…
New to psLens? This page documents one specific alert. To see how it appears on the dashboard,
what operators investigate, and how teams tune it, start with a live walkthrough.
This alert finds asynchronous Integration Broker operation instances that are stuck in New or Working status and have been in that state longer than the configured threshold. These are messages that started processing (or are waiting to be processed) but have not completed in a reasonable amount of time.
Cross-reference with IB Dispatcher Down first. A stalled queue plus a down dispatcher is almost always the dispatcher.
Severity Logic
Condition
Severity
Stuck longer than thresholdMinutes
Warning
Stuck longer than thresholdMinutes × 2
Critical
For example, with the default threshold of 30 minutes:
An operation stuck for 35 minutes → Warning
An operation stuck for 65 minutes or more → Critical
Alert Details
Each alert item includes:
Operation instance ID
Service operation name
Current status (New or Working)
How long it has been stuck (in minutes)
The originating node
A link to the IB Monitor detail page
Configuration
alerts:checks:ib_operation_stalled:enabled:truethresholdMinutes:30# Minutes before flagging as WarningexcludeOperations:# Operation names to skip- BULK_SYNC_OPERATION
Setting
Default
Description
thresholdMinutes
30
Minutes an operation must be stuck to trigger a Warning. Critical fires at 2× this value.
excludeOperations
[]
List of IB operation names to exclude from this check. Use for known long-running operations.
How to Respond
Click the alert link to go to the IB Monitor entry for the stalled operation
Check whether the IB dispatcher/handlers are running on the PeopleSoft application server
Look for signs of a larger IB backlog (many operations in New status)
Check the gateway and connector configuration if the operation can’t reach a node
If the operation is safe to reprocess, you can cancel and resubmit from PeopleSoft’s Service Operations Monitor
Relationship to Other IB Alerts
This alert finds operations that are stuck in progress. For operations that have already ended in error, see IB Operation Errors.
For similar alerts on publication and subscription contracts, see:
This alert finds Integration Broker publication contracts that are in Error or Timeout status within a configurable lookback window.
New to psLens? This page documents one specific alert. To see how it appears on the dashboard,
what operators investigate, and how teams tune it, start with a live walkthrough.
This alert finds Integration Broker publication contracts that are in Error or Timeout status within a configurable lookback window.
In the PeopleSoft Integration Broker architecture, a publication contract tracks the delivery of a published message to a specific subscribing node. When a publication contract fails, it means a message that PeopleSoft published was not successfully delivered to one or more subscribers.
When This Matters
Publication contract errors typically mean:
An outbound message from PeopleSoft was not delivered to a downstream system
An integration partner did not receive data it was expecting
A workflow or data sync that depends on this message may be incomplete
Severity Logic
Status
Severity
Error
Critical
Timeout
Warning
Alert Details
Each alert item includes:
Publication contract ID
Service operation name
Status (Error or Timeout)
The target subscribing node
When the contract was created
A link to the IB Monitor detail page
Configuration
alerts:checks:ib_pub_contract_errors:enabled:truelookbackHours:24# How far back to look for errorsexcludeOperations:# Operation names to skip- HIGH_VOLUME_SYNC
Setting
Default
Description
lookbackHours
24
Number of hours back to search for error/timeout contracts
excludeOperations
[]
List of IB operation names to exclude from this check
How to Respond
Click the alert link to go to the IB Monitor entry for the failed contract
Review the error details. The IB Monitor shows the error message
Check whether the target subscribing node is reachable and its connector is configured correctly
This alert finds Integration Broker publication contracts that are stuck in New or Working status and have not progressed beyond that state within …
New to psLens? This page documents one specific alert. To see how it appears on the dashboard,
what operators investigate, and how teams tune it, start with a live walkthrough.
This alert finds Integration Broker publication contracts that are stuck in New or Working status and have not progressed beyond that state within the configured threshold.
A stalled publication contract means PeopleSoft has published a message to a subscriber, but the delivery has not completed. The message is either waiting to be picked up (New) or is in the process of being delivered but taking too long (Working).
alerts:checks:ib_pub_contract_stalled:enabled:truethresholdMinutes:30# Minutes before flagging as WarningexcludeOperations:# Operation names to skip- LARGE_BATCH_SYNC
Setting
Default
Description
thresholdMinutes
30
Minutes a contract must be stuck to trigger a Warning. Critical fires at 2× this value.
excludeOperations
[]
List of IB operation names to exclude. Use for operations that legitimately take a long time.
How to Respond
Click the alert link to go to the IB Monitor entry for the stalled contract
Check whether the IB dispatchers are running on the PeopleSoft application server
Look for a larger backlog (many contracts in New status may mean the dispatcher is down)
Check whether the target node’s endpoint is reachable
Review connector configuration for the target node
This alert finds Integration Broker subscription contracts that are in Error or Timeout status within a configurable lookback window.
New to psLens? This page documents one specific alert. To see how it appears on the dashboard,
what operators investigate, and how teams tune it, start with a live walkthrough.
This alert finds Integration Broker subscription contracts that are in Error or Timeout status within a configurable lookback window.
In the PeopleSoft Integration Broker architecture, a subscription contract tracks the processing of an inbound message by a subscribing handler. When a subscription contract fails, it means PeopleSoft received a message from an external system but was unable to process it completely.
When This Matters
Subscription contract errors typically mean:
An inbound message from an integration partner was not fully processed
PeopleSoft was unable to apply the data changes the message carried
A business process that depends on this message may be incomplete or in an error state
Severity Logic
Status
Severity
Error
Critical
Timeout
Warning
Alert Details
Each alert item includes:
Subscription contract ID
Service operation name
Status (Error or Timeout)
The originating (publishing) node
When the contract was created
A link to the IB Monitor detail page
Configuration
alerts:checks:ib_sub_contract_errors:enabled:truelookbackHours:24# How far back to look for errorsexcludeOperations:# Operation names to skip- KNOWN_RETRY_OPERATION
Setting
Default
Description
lookbackHours
24
Number of hours back to search for error/timeout contracts
excludeOperations
[]
List of IB operation names to exclude from this check
How to Respond
Click the alert link to go to the IB Monitor entry for the failed contract
Review the error details. The IB Monitor typically shows the exception or error message from the handler PeopleCode
Check the subscription handler code for the operation (viewable in the Service Operation detail page in psLens)
Investigate whether the data in the message is valid. Handler errors often come from unexpected data
If the subscription can be safely reprocessed, resubmit from PeopleSoft’s Subscription Contracts Monitor
This alert finds Integration Broker subscription contracts that are stuck in New or Working status and have not progressed beyond that state within…
New to psLens? This page documents one specific alert. To see how it appears on the dashboard,
what operators investigate, and how teams tune it, start with a live walkthrough.
This alert finds Integration Broker subscription contracts that are stuck in New or Working status and have not progressed beyond that state within the configured threshold.
A stalled subscription contract means PeopleSoft received an inbound message from an external system, but has not yet finished processing it. The message is either waiting to be handled (New) or is in the process of being handled but taking too long (Working).
When This Matters
For sub contracts, the most common cause specific to this alert is subscription handler PeopleCode that runs unusually long or waits on an external resource. For broader IB-side causes (dispatcher down, backlog), cross-reference IB Dispatcher Down and IB Operations Stalled.
Severity Logic
Condition
Severity
Stuck longer than thresholdMinutes
Warning
Stuck longer than thresholdMinutes × 2
Critical
Alert Details
Each alert item includes:
Subscription contract ID
Service operation name
Current status (New or Working)
How long it has been stuck (in minutes)
The originating (publishing) node
A link to the IB Monitor detail page
Configuration
alerts:checks:ib_sub_contract_stalled:enabled:truethresholdMinutes:30# Minutes before flagging as WarningexcludeOperations:# Operation names to skip- BULK_INBOUND_SYNC
Setting
Default
Description
thresholdMinutes
30
Minutes a contract must be stuck to trigger a Warning. Critical fires at 2× this value.
excludeOperations
[]
List of IB operation names to exclude. Use for known long-running handlers.
How to Respond
Click the alert link to go to the IB Monitor entry for the stalled contract
Check whether the IB dispatchers are running on the PeopleSoft application server
Look for a broader backlog. Many New contracts may mean no dispatcher is running
Check application server logs for errors in the subscription handler
For Working contracts, check whether the handler PeopleCode is looping or waiting on an external resource
This alert detects when the volume of IB async operation instances (PSAPMSGPUBHDR) is significantly higher than the rolling historical average.
New to psLens? This page documents one specific alert. To see how it appears on the dashboard,
what operators investigate, and how teams tune it, start with a live walkthrough.
This alert detects when the volume of IB async operation instances (PSAPMSGPUBHDR) is significantly higher than the rolling historical average.
A sudden volume spike may indicate a runaway integration sending messages in a loop, an upstream system retrying failed messages, or an unusually large but legitimate batch publish event.
How Baselining Works
psLens maintains a rolling history of up to 288 volume snapshots (approximately 24 hours at a 5-minute check interval). Each check cycle records the current message count for the lookback window.
Once at least 6 baseline snapshots have accumulated, the alert begins comparing the current count against the historical average. This prevents false alerts during the first few minutes after psLens starts.
Severity Logic
Condition
Severity
Volume exceeds average by >= thresholdPercent
Warning
Volume exceeds average by >= thresholdPercent x 2
Critical
Historical average is 0 and current count is > 0
Warning
For example, with the default threshold of 50%:
Current count is 75% above average → Warning
Current count is 100%+ above average → Critical
Configuration
alerts:checks:ib_operation_volume:enabled:truelookbackHours:1# Window for counting current messagesthresholdCount:50# Percentage increase to trigger Warning
Setting
Default
Description
lookbackHours
1
Hours to look back when counting current message volume
thresholdCount
50
Percentage increase over historical average to trigger a Warning alert. Critical fires at 2x this value.
Alert Details
Each alert item includes:
Current message count for the lookback window
Historical average count
Percentage increase above average
Number of baseline samples used
Link to the IB Monitor page
How to Respond
Navigate to the IB Monitor in psLens to see which operations are generating the volume
Check if any operations are in Error or Stalled status (see related IB alerts)
Review the specific operations with high message counts to determine if the volume is expected
If a runaway integration is identified, investigate the upstream system sending the messages
This alert detects when the volume of IB publication contracts (PSAPMSGPUBCON) is significantly higher than the rolling historical average.
New to psLens? This page documents one specific alert. To see how it appears on the dashboard,
what operators investigate, and how teams tune it, start with a live walkthrough.
This alert detects when the volume of IB publication contracts (PSAPMSGPUBCON) is significantly higher than the rolling historical average. Publication contracts represent messages being delivered to subscribing nodes, so a spike here can indicate unexpected fan-out, retries, or a high-volume event.
A sudden volume spike may indicate repeated retries of failed contracts inflating the count, an upstream system publishing in a loop, or a legitimate but unusually large batch publication event.
How Baselining Works
psLens maintains a rolling history of up to 288 volume snapshots (approximately 24 hours at a 5-minute check interval). Each check cycle records the current publication contract count for the lookback window.
Once at least 6 baseline snapshots have accumulated, the alert begins comparing the current count against the historical average.
Severity Logic
Condition
Severity
Volume exceeds average by >= thresholdPercent
Warning
Volume exceeds average by >= thresholdPercent x 2
Critical
Historical average is 0 and current count is > 0
Warning
For example, with the default threshold of 50%:
Current count is 75% above average → Warning
Current count is 100%+ above average → Critical
Configuration
alerts:checks:ib_pub_contract_volume:enabled:truelookbackHours:1# Window for counting current contractsthresholdCount:50# Percentage increase to trigger Warning
Setting
Default
Description
lookbackHours
1
Hours to look back when counting current contract volume
thresholdCount
50
Percentage increase over historical average to trigger a Warning alert. Critical fires at 2x this value.
Alert Details
Each alert item includes:
Current publication contract count for the lookback window
Historical average count
Percentage increase above average
Number of baseline samples used
Link to the IB Monitor page
How to Respond
Navigate to the IB Monitor in psLens to see which publication contracts are generating the volume
This alert fires when the SWS endpoint returns a connection error, timeout, 404, or 5xx.
New to psLens? This page documents one specific alert. To see how it appears on the dashboard,
what operators investigate, and how teams tune it, start with a live walkthrough.
This alert fires when the SWS endpoint returns a connection error, timeout, 404, or 5xx. psLens cannot fetch IB data without SWS, so this also blocks every other psLens IB check. A connection failure indicates that the Integration Broker gateway, local node, or application server is down.
Severity Logic
Condition
Severity
SWS connection attempt fails
Critical
What Gets Checked
The alert invokes the standard SWS connection test method. If it receives any network connection error (e.g., HTTP gateway timeout, connection refused, dns resolving failure, or HTTP 404/500 errors), a Critical alert is raised immediately.
Alert Details
Each alert item includes:
The base REST URL of the SWS endpoint (baseURL)
The raw network or connection error message
Troubleshooting links to verify connection settings
Configuration
alerts:checks:ib_down:enabled:true
Setting
Default
Description
enabled
true
Whether this check is active.
How to Respond
Verify that the PeopleSoft Web Server and PIA are up and running.
Check the Integration Gateway web application status (typically /PSIGW/PeopleSoftListeningConnector).
Ensure that the application server domain is booted and the Integration Broker handlers/dispatchers are active.
Verify there are no firewalls, proxies, or security policies blocking outbound HTTPS traffic from the psLens server to the Integration Broker gateway port.
Inspect the basic auth credentials in the config.yaml to ensure the API service user has not expired or been locked.
This alert detects when the volume of IB subscription contracts (PSAPMSGSUBCON) is significantly higher than the rolling historical average.
New to psLens? This page documents one specific alert. To see how it appears on the dashboard,
what operators investigate, and how teams tune it, start with a live walkthrough.
This alert detects when the volume of IB subscription contracts (PSAPMSGSUBCON) is significantly higher than the rolling historical average. Subscription contracts represent inbound messages being processed by local subscribers, so a spike here can indicate a flood of inbound messages, excessive retries, or an integration firing more frequently than expected.
How Baselining Works
psLens maintains a rolling history of up to 288 volume snapshots (approximately 24 hours at a 5-minute check interval). Each check cycle records the current subscription contract count for the lookback window.
Once at least 6 baseline snapshots have accumulated, the alert begins comparing the current count against the historical average.
Severity Logic
Condition
Severity
Volume exceeds average by >= thresholdPercent
Warning
Volume exceeds average by >= thresholdPercent x 2
Critical
Historical average is 0 and current count is > 0
Warning
For example, with the default threshold of 50%:
Current count is 75% above average → Warning
Current count is 100%+ above average → Critical
Configuration
alerts:checks:ib_sub_contract_volume:enabled:truelookbackHours:1# Window for counting current contractsthresholdCount:50# Percentage increase to trigger Warning
Setting
Default
Description
lookbackHours
1
Hours to look back when counting current contract volume
thresholdCount
50
Percentage increase over historical average to trigger a Warning alert. Critical fires at 2x this value.
Alert Details
Each alert item includes:
Current subscription contract count for the lookback window
Historical average count
Percentage increase above average
Number of baseline samples used
Link to the IB Monitor page
How to Respond
Navigate to the IB Monitor in psLens to see which subscription contracts are generating the volume
This alert triggers when no active message domains are found in the Integration Broker.
New to psLens? This page documents one specific alert. To see how it appears on the dashboard,
what operators investigate, and how teams tune it, start with a live walkthrough.
This alert triggers when no active message domains are found in the Integration Broker. In PeopleSoft, message domains correspond to individual application servers running the Integration Broker background processes. If there are no active domains, Integration Broker cannot route, dispatch, or process any asynchronous publication or subscription messages.
Severity Logic
Condition
Severity
No message domains are in “Active” status
Critical
What Gets Checked
The alert queries the PSAPMSGDOMSTAT table to retrieve all registered domains. It counts the domains where the status is "A" (Active). If the count of active domains is zero, it triggers a Critical alert.
Alert Details
Each alert item includes:
The total count of registered domains
A list of inactive domains along with their machine names and app server paths
A link to the Integration Broker Monitor on the dashboard to inspect the domain statuses
Configuration
alerts:checks:ib_no_active_domain:enabled:true
Setting
Default
Description
enabled
true
Whether this check is active.
How to Respond
Log into the PeopleSoft server or use PSAdmin to check the status of the application server domains.
Verify if the Quick-Start or normal app server configuration has Integration Broker (Pub/Sub) processes enabled.
If the application server was recently restarted, check if the domains were configured to boot automatically or if they need to be booted manually.
Check system logs for application server boot crashes, memory errors, or database connection failures.
10.2.12 - IB Dispatcher Down
This alert monitors Integration Broker dispatcher processes (such as the publication dispatcher, subscription dispatcher, or handler dispatchers) o…
New to psLens? This page documents one specific alert. To see how it appears on the dashboard,
what operators investigate, and how teams tune it, start with a live walkthrough.
This alert monitors Integration Broker dispatcher processes (such as the publication dispatcher, subscription dispatcher, or handler dispatchers) on active domains and triggers when any dispatcher is inactive or has stopped reporting health updates.
When a dispatcher process is down, messages assigned to that dispatcher fail to process and queue up indefinitely, leading to a backlog.
Severity Logic
Condition
Severity
Dispatcher status is not active, or no health update within thresholdMinutes
Warning
Dispatcher has not updated health status for more than thresholdMinutes × 2
Critical
For example, with the default threshold of 10 minutes:
No health update for 11 minutes → Warning
No health update for 20+ minutes → Critical
What Gets Checked
The alert queries PSAPMSGDSPSTAT for dispatcher process statuses. For each dispatcher associated with an Active domain (from PSAPMSGDOMSTAT), it verifies:
The status string is "ACT" (Active).
The health timestamp (DspHealthDttm) has been updated within the threshold window.
Note: Dispatchers on inactive domains are ignored by this check (they are covered by the IB No Active Domain check).
Alert Details
Each alert item includes:
Dispatcher process name
Physical machine/host name
App server path
The last updated health timestamp
Reason for the down status (e.g. status not active, or elapsed minutes since last update)
Minutes a dispatcher can go without updating health before raising a Warning. Critical fires at 2× this threshold.
How to Respond
Go to the Integration Broker Monitor on the psLens dashboard to identify which specific dispatcher on which host is failing.
Log into the affected PeopleSoft application server and check the status of the dispatcher processes via PSAdmin.
Review the application server and Pub/Sub subdirectories log files (such as APPSRV.log, TUXLOG, or stderr / stdout logs) for crashes, Tuxedo errors, or database lockups.
Restart the Pub/Sub processes on the application server if the dispatcher has locked up or crashed.
10.2.13 - IB Sync Operation Exceptions
This alert detects synchronous IB service operations that have logged errors in the sync transaction log (PSIBLOGHDR) within the configured lookbac…
New to psLens? This page documents one specific alert. To see how it appears on the dashboard,
what operators investigate, and how teams tune it, start with a live walkthrough.
This alert detects synchronous IB service operations that have logged errors in the sync transaction log (PSIBLOGHDR) within the configured lookback window. Results are aggregated by operation name to avoid noise from high-volume sync operations that may have individual errors but function normally overall.
Unlike async IB errors (which create persistent queue entries), sync operation errors are logged transiently in PSIBLOGHDR. Without active monitoring, these errors are often missed until a consuming system reports a problem.
Severity Logic
All findings are reported at Warning severity. Since synchronous request-response transactions are executed in real time, any error must be handled and logged by the calling HTTP client. Administrators generally cannot resolve these errors from within PeopleSoft, as the client must reinitiate the transaction.
What Gets Checked
The alert queries PSIBLOGHDR for records with error status within the lookback window, aggregated by IB operation name. Only operations with at least one error are reported. Operations in the exclude list are skipped.
Alert Details
Each alert item includes:
Service operation name (with link to Service Operation detail page)
Number of errors in the lookback window
Lookback window in hours
Configuration
alerts:checks:ib_sync_exceptions:enabled:falselookbackHours:24# How far back to check for sync errorsexcludeOperations:[]# Operation names to ignore
Setting
Default
Description
enabled
false
Enable or disable the sync exception checker
lookbackHours
24
Hours to look back for sync operation errors
excludeOperations
[]
List of operation names to exclude from this check
How to Respond
Click the alert link to open the Service Operation detail page
Review the operation’s handler configuration and routing
Check PSIBLOGHDR directly for the specific error messages (psLens links to the operation, not individual log entries)
Verify that the operation’s service handler is still functional and the underlying code has not changed
Contact the calling system to understand whether they are seeing failures on their end
The PSIBLOGHDR table must be whitelisted in the PeopleSoft SWS framework on each target environment. Sync logging must be enabled on the relevant routings. If logging is disabled, errors will not appear in PSIBLOGHDR. See the Sync Operations Without Logging report to find operations where logging may be disabled.
Tables Queried
Table
Description
PSIBLOGHDR
IB sync transaction log headers
10.2.14 - IB Nodes Down
This alert triggers when there are entries in the PeopleSoft table PSNODESDOWN.
New to psLens? This page documents one specific alert. To see how it appears on the dashboard,
what operators investigate, and how teams tune it, start with a live walkthrough.
This alert triggers when there are entries in the PeopleSoft table PSNODESDOWN. An entry in this table indicates that a message node is blocked or offline.
When the Integration Broker attempts to publish a message to an external or remote node and the connection fails, the system registers the node as “down” in PSNODESDOWN. While the node is down, all subsequent publication contracts to that node are automatically paused/blocked and remain queued in the database until the node status is resolved.
Severity Logic
Condition
Severity
Message node entry exists in PSNODESDOWN
Critical
What Gets Checked
The alert queries PSNODESDOWN for any active rows. For each row found, it groups the results by message node and counts the number of blocked transactions.
Alert Details
Each alert item includes:
The name of the offline message node
The count of blocked transactions queueing for the node
A link to the Node detail page in the browser showing connection diagnostics
Configuration
alerts:checks:ib_nodes_down:enabled:true
Setting
Default
Description
enabled
true
Whether this check is active.
How to Respond
Click the node link in the alert to inspect the node configuration and test connectivity.
Check if the external target service (e.g. an external API gateway, third-party system, or another PeopleSoft application node) is offline or undergoing maintenance.
Verify network routing and gateway connector configurations.
Once the external endpoint is confirmed to be healthy, delete the down-node status entry in PeopleSoft (typically via the Service Operations Monitor > Administration > Nodes Down page) and resubmit or force retry the stalled publication contracts.
10.3 - Security
Security alerts: failed login detection and authentication monitoring.
Security alerts monitor your PeopleSoft environment for authentication issues and suspicious login activity.
Users with excessive failed login attempts in PSPTLOGINAUDIT
10.3.1 - Failed Logins
This alert finds PeopleSoft users with excessive failed login attempts by querying the PSPTLOGINAUDIT table.
New to psLens? This page documents one specific alert. To see how it appears on the dashboard,
what operators investigate, and how teams tune it, start with a live walkthrough.
This alert finds PeopleSoft users with excessive failed login attempts by querying the PSPTLOGINAUDIT table. It only reports users whose most recent login attempt was a failure (PT_SIGNON_STATUS = 1).
PSPTLOGINAUDIT stores only the last login state per user. Once a user successfully logs in, their failure count resets. This means the alert reflects the current state: users who are actively failing to log in right now.
A high number of failed logins may indicate:
A brute-force attack against a user account
A user who has forgotten their password
An integration or batch account with stale credentials
An account lockout situation that needs admin attention
Severity Logic
Condition
Severity
Failed logins >= thresholdCount
Warning
Failed logins >= thresholdCount x 2
Critical
For example, with the default threshold of 5:
A user with 6 failed logins -> Warning
A user with 10 or more failed logins -> Critical
What Gets Checked
The alert queries PSPTLOGINAUDIT for rows where:
PT_SIGNON_STATUS = '1' (last attempt was a failure)
FAILEDLOGINS >= threshold (failed count meets or exceeds the configured threshold)
Results are ordered by FAILEDLOGINS descending (highest failure counts first).
Alert Details
Each alert item includes:
Signon ID (PTSIGNONID) — the username entered at the login screen
OPRID — the resolved PeopleSoft user ID
Number of failed login attempts
Authentication type (Token/SSO, Signon PeopleCode, or Standard)
Timestamp of the last failed login attempt
A link to the User detail page (when the OPRID is resolved)
Configuration
alerts:checks:failed_logins:enabled:truethresholdCount:5# Failed attempts before flagging as Warning
Setting
Default
Description
thresholdCount
5
Number of failed logins to trigger a Warning alert. Critical fires at 2x this value.
How to Respond
Click the alert link to go to the User detail page for the affected account
Check the authentication type. Token/SSO failures may indicate a misconfigured integration
Review the timestamp. Recent failures are more concerning than old ones
Check if the user’s account is locked (ACCTLOCK in PSOPRDEFN)
If the failures look like a brute-force attempt, consider locking the account and investigating the source
For legitimate users, help them reset their password and unlock their account
The PSPTLOGINAUDIT table must be whitelisted in the PeopleSoft SWS framework on each target environment. If the table is not whitelisted, this alert will log an error on each check cycle but will not affect other alerts.
10.4 - Web Server / WebLib Down
psLens POSTs to one or more configured WebLib or IScript URLs every check cycle.
New to psLens? This page documents one specific alert. To see how it appears on the dashboard,
what operators investigate, and how teams tune it, start with a live walkthrough.
Alert ID:weblib_downCategory: Web Server / WebLib
Default threshold: Immediate
What This Alert Detects
psLens POSTs to one or more configured WebLib or IScript URLs every check cycle. If any target connection fails or returns a 5xx, the alert fires Critical.
By default, the checker tests the standard delivered WebLib endpoint:
WEBLIB_PTBR.ISCRIPT1.FieldFormula.IScript_StartPage
If the Web Server is down, or if the whitelisted API service account loses security access to the tested WebLib, the alert triggers immediately.
Severity Logic
Condition
Severity
Target URL is unreachable or connection times out
Critical
Target WebLib returns an HTTP status code >= 500 (Internal Server Error)
Critical
Note: HTTP statuses like 200 (Success), 401 (Unauthorized), 403 (Forbidden), or 302 (Redirect) indicate the Web Server is active and processing requests; they do not trigger a down alert.
What Gets Checked
For each target URL configured in weblibTestTargets:
It sends an HTTP POST request with a 10-second timeout.
It applies HTTP Basic Authentication using either target-specific credentials or default database connection credentials.
It registers a failure if the request fails to connect or returns a status code in the 5xx range.
List of target configurations. Each target requires a url and optional username / password overrides.
How to Respond
Verify whether the PeopleSoft Web Server (WebLogic or WebSphere) process is booted and running.
Check if there are network outages, load balancer failures, or firewall changes between the psLens server and the PIA URL.
If the server is reachable but returning a weblib_down alert, verify that the configured PeopleSoft service account has security clearance (assigned Permission Lists) to access the target WebLib.
10.5 - Generic SWS Alerts
Generic SWS Alerts let you define alert checks in YAML using PsoftQL queries against whitelisted PeopleSoft records.
Generic SWS Alerts
Generic SWS Alerts let you define alert checks in YAML using PsoftQL queries against whitelisted PeopleSoft records. Use these when you need a one-off check that the built-in alert types don’t cover.
The scheduler runs each query on the database’s checking interval and triggers alerts based on the resulting row counts.
Configuration Properties
Generic alerts are configured under the genericSWSAlerts list, either globally under alerts or overridden per-database under databases[].alerts.
Property
Type
Required
Default
Description
id
String
Yes
-
Unique alphanumeric identifier. The system registers the alert internally as generic_sws_<id>.
name
String
Yes
-
Friendly name shown on the dashboard and in reports (e.g. Stale Admins).
enabled
Boolean
No
true
Toggle execution of this generic alert.
severity
String
No
warning
Severity of the alert when triggered: info, warning, or critical.
alertOn
String
No
row_found
Condition to trigger the alert: row_found (trigger if row count > 0) or no_result_found (trigger if row count == 0).
message
String
Yes
-
Summary message shown on the dashboard and sent in notifications when the alert triggers.
For security, the SWS client restricts query capabilities to a defined list of records. Every record/table referenced in a generic alert query must be whitelisted in the SWS whitelisting table (C_SWS_REC_WL) on the target PeopleSoft database.
If a query references a record that is not whitelisted, the alert run will fail with a whitelisting validation error.
PsoftQL Query Structure
The query property follows the exact structure of a psLens PsoftQLRequest query:
Property
Type
Description
records
Array
List of record configurations to query (can be nested for joins).
rowLimit
Integer
Max rows to return (recommended to keep low, e.g. 5 or 10).
orderBy
String
SQL ORDER BY clause for sorting findings.
noEffectiveDateLogic
Boolean
Set true to skip automatic EFFDT filtering logic.
noEffectiveStatusLogic
Boolean
Set true to skip automatic EFF_STATUS = 'A' filtering logic.
Record Configuration (records[])
recordName (String, Required): PeopleSoft record name (e.g., PSOPRDEFN).
excludeFields (List, Optional): Field names to exclude from results.
Practical Examples
Example 1: Critical Administrative Account Access (Row Found)
This alert triggers a Critical warning if an administrator account has been modified recently, or if a locked/inactive operator is seen initiating processes.
alerts:genericSWSAlerts:- id:"locked_oprid_activity"name:"Locked Admin Activity"enabled:trueseverity:"critical"alertOn:"row_found"message:"Security warning: Activity detected from locked operator accounts!"query:records:- recordName:"PSPRCSRQST"sqlWhereClause:"RUNDTTM > CAST(SYSDATE - 1 AS DATE) AND OPRID IN (SELECT OPRID FROM PSOPRDEFN WHERE ACCTLOCK = 1)"rowLimit:5
Example 2: Process Scheduler Daemon Down (No Result Found)
This alert triggers a Critical warning if no process scheduler daemon has updated its status in the last 15 minutes, indicating that the scheduler might be down.
alerts:genericSWSAlerts:- id:"scheduler_daemon_down"name:"Process Scheduler Daemon Status"enabled:trueseverity:"critical"alertOn:"no_result_found"message:"Alert: No active process scheduler daemons detected in the last 15 minutes!"query:records:- recordName:"PSSERVERDEFN"sqlWhereClause:"LASTUPDDTTM > CAST(SYSDATE - 1/96 AS DATE)"# 15 minutes lookbackrowLimit:1
Notification Routing
To route notifications for a generic SWS alert, use its registered ID (generic_sws_<id>) in the alertTypes property of your notification subscription:
psLens reference material: PeopleSoft tables, configuration options, and technical details.
Reference
This section contains reference material for understanding psLens internals and the PeopleSoft tables it works with.
PeopleSoft Tables Used by psLens
The following tables list every PeopleSoft metadata and operational table that psLens queries through the SWS framework. All of these must be whitelisted (see Installation for the full whitelist SQL).
If you add a new query against a PeopleSoft record in the code, add it to the appropriate category below and add a matching INSERT to the installation guide.
Security Tables
Table
Description
Used By
PSCLASSDEFN
Permission list definitions
Permission Lists browser, Full Access report, PeopleTools Access report
PSAUTHITEM
Menu / component authorizations per permission list
Menu item transfer destinations (target menu / component / page / portal / node) — keyed on MENUNAME + ITEMNAME only (no BARNAME). Populated for PSMENUITEM.ITEMTYPE = 12 (Transfer) items.
Menus detail
PSPROJECTDEFN
Project definitions
Projects browser
PSPROJECTITEM
Items contained in a project
Projects detail, App Packages detail
PSBCDEFN
Component Interface definitions
Component Interfaces browser
PSBCITEM
Component Interface property and method items
Component Interfaces detail
PSPRSMDEFN
Component Reference (CREF) and folder definitions
Components detail, Component References
PSPRSMSYSATTR
Component Reference system attributes
Component References detail
PSPRSMSYSATTRVL
Component Reference system attribute values
Component References detail
PSPRSMATTRVAL
Component Reference custom attribute values
Component References detail
PSPRSMPERM
Component Reference permission list mappings
Component References detail
PSPRUFDEFN
Portal user favorites
Users detail
Integration Broker Tables
Table
Description
Used By
PSMSGNODEDEFN
Message node definitions
Nodes browser, Nodes No Password report, Users detail (Special Use: nodes whose USERID = this OPRID)
PSNODECONPROP
Node connector properties
Nodes detail
PSNODEURITEXT
Node URI text
Nodes detail
PSNODESDOWN
Down message nodes and blocked transactions
Nodes detail, Nodes Down alert
PSSERVICE
Service definitions
Services browser
PSSERVICEOPR
Service operations within a service
Services detail, Application Services detail
PSOPERATION
Service operation definitions
Service Operations browser, Message Definitions detail
PSOPERATIONAC
Service operation handler access (status)
Service Operations detail
PSOPERATIONURI
Service operation URIs
Service Operations detail
PSOPRVERDFN
Service operation version definitions
Service Operations detail
PSOPRVERDFNPARM
Service operation version parameters
Service Operations detail, Queues detail
PSOPRHDLR
Service operation handler definitions
Service Operations detail
PSIBRTNGDEFN
Integration Broker routing definitions
Services detail, Nodes detail
PSIBAPPLDEFN
Application service (ASF) definitions
Application Services browser
PSIBAPPLOPR
Application service operations and handler classes
Application Services detail
PSIBAPPURI
Application service URI templates
Application Services detail
PSIBAPPMETHOD
Application service REST method configuration
Application Services detail
PSIBPARAM
Application service method parameters
Application Services detail
PSIBBASEPARAM
Application service base parameters
Application Services detail
PSIBTEMPLPARAM
Application service template parameters
Application Services detail
PSIBBASETMPLPRM
Application service base template parameters
Application Services detail
PSIBAPPLSTATES
Application service result state to HTTP status mappings
Queries detail (Execution Log panel), Users detail (Query History panel)
PSTREEDEFN
Query tree definitions
Query Trees browser
PSTREENODE
Query tree node structure
Query Trees detail
Audit & User Profile Tables
Table
Description
Used By
PSPTLOGINAUDIT
Sign-on / sign-off audit trail
Login Audit page
PSUSEREMAIL
User email addresses
Users detail
PSOPTIONS
System-wide options; OPRID is the user context for Signon PeopleCode pre-authentication
Users detail (Special Use card)
Configuration Reference
For the full config.yaml reference, see Configuration.
Alert Reference
For details on all alert types, see the Alerts section.
Report Reference
For details on all available reports, see the Reports section.
12 - Roadmap
Planned psLens capabilities, with stable phrasing about commitment. No published dates.
Roadmap
This page shows where psLens is headed next so you can judge how well it fits the way your team works today and what you may want from it next. The biggest direction is live, read-only AI access through MCP, followed by targeted improvements in authentication, auditability, and operational visibility.
If a specific planned feature matters to your evaluation, bring it up on the demo call. The roadmap is part of the sales conversation precisely because customer demand changes the order.
psLens as an MCP Server
The largest planned area is exposing psLens through the Model Context Protocol so AI tools (Claude Code, Claude Desktop, Cursor, Continue, and any other MCP-aware host) can query PeopleSoft live, without anyone running an export by hand first.
The current AI Enablement story documented at AI Enablement is the export-and-paste workflow. MCP removes the manual step. The same whitelisted read surface that backs the dashboard becomes the surface the agent calls.
The design
The first cut is spec’d as a read MCP: a single read-only MCP server embedded in your psLens instance. Same process, same single-tenant deployment, mounted at /mcp over the Streamable HTTP transport with API-key authentication. Nothing writes to PeopleSoft, and every query goes through the same SWS query layer and table whitelist as the dashboard, so nothing becomes reachable over MCP that the UI cannot already see.
The tool surface is deliberately small — roughly a dozen tools in three groups:
Generic object tools.search_object, get_object, get_related, and get_peoplecode cover every object type the dashboard browses (30+ types) without needing a tool per type. A catalog resource documents the valid object types and relations so the agent can discover the surface before calling it.
Composed shortcuts. Single calls for the questions people actually ask. user_access takes one OPRID and returns the full role and permission-list chain. who_has_access takes one object and returns everyone who can reach it. ib_monitor and audit_dangerous wrap the Integration Broker and dangerous-permission surfaces.
Operational tools.run_report invokes any of the 14 existing reports and streams progress back to the agent, with an async job variant for long runs. list_alerts and list_databases round it out.
Alongside the tools, the server exposes resources the agent can read passively (per-database connection status, the table whitelist, the object-type catalog) and prompt templates for repeatable workflows such as user-access audits, impact analysis, and IB failure triage.
The use cases below show what this surface is for.
1. Metadata research
The core case. Every PeopleSoft object psLens browses becomes a tool the agent can call: records, fields, projects, application packages, app engines, components, pages, menus, queries, service operations, permission lists, users, message catalog entries, SQL objects.
Example agent prompt:
Open my customization repo. For every Application Engine in project HCM_CUST_2026, summarize what it does in two sentences, list its temp tables, and flag any that reference deprecated meta-SQL.
Today this requires exporting each AE to Markdown, copying them into the workspace, and prompting against the saved files. The generic object tools let the agent walk the project itself and pull each AE on demand.
2. Security and access questions
Surfaces the same data the security dashboard exposes (users, roles, permission lists, web service authorizations) as a question-and-answer tool for ad-hoc audit conversations.
Example agent prompt:
Does the user J_PETERS have access to the PROCESS_MONITOR component on PROD? Show me the role-and-permission-list chain that grants it, or confirm there is none.
The agent traces the access path live without the operator pulling a full report or writing the 4-table join by hand.
3. Operations and alert triage
The Process Scheduler, Integration Broker, and alert history surfaces are exposed as live tools.
Example agent prompt (2am triage):
Production looks sick. Pull the last 30 minutes of alert history, the current Process Monitor failure list, and the IB queue depth on PROD. Tell me what is most likely the root cause and the next thing to check.
The agent correlates across surfaces (a queued process plus a locked OPRID plus a stalled IB dispatcher) faster than a person clicking through three different pages.
4. Report automation
The 14 on-demand reports already available in the dashboard (Full Access, Stale Passwords, Node Security Audit, Dangerous Permissions, and the rest) become tools the agent can invoke and consume.
Example agent prompt (recurring cadence):
Run the security report bundle against PROD. Compare the findings to last week’s run, summarize what changed, and write a one-page Slack-ready summary highlighting any new account that gained broad access.
This is the highest-value case for security teams that want a weekly or monthly audit cadence without writing the orchestration themselves.
5. Cross-environment comparison
Project Compare and Recurring-Process Compare are already in psLens. As MCP tools they let an agent answer drift questions across DEV, TEST, and PROD without anyone clicking through the comparison UI.
Example agent prompt (post-migration):
A migration ran last night moving project HCM_RELEASE_42 from TEST to PROD. Pull the project compare, list every object that differs between TEST and PROD now, and tell me which differences are expected (newly added) versus suspicious (changed in a way that suggests a botched merge).
What this is not
Not a write path to PeopleSoft. No tool exposes a way to change PeopleSoft data. psLens is read-only against PeopleSoft today and stays that way.
Not a SaaS shared MCP. The MCP endpoint is part of your psLens instance, same single-tenant model as the dashboard.
Not coupled to a specific AI vendor. MCP is an open protocol. Any client that speaks it works.
Other Roadmap Items
These are documented in context on the page where the reader is likely asking the question. The roadmap page lists them here so a reviewer can see the full surface in one place.
First-class user-action audit log. Structured per-user event log written to NATS KV with configurable retention, exportable to your SIEM. Targeted to land alongside native SSO. See Data Handling & Logging → Audit Logging.
Observability
Prometheus /metrics endpoint. For customers who want metric-based monitoring in addition to the existing /healthz + log stream. See Deployment & Operations → Monitoring.
We are open for product feedback. New reports and alerts are modules in an existing framework (the 14 reports and 16 alerts in psLens today were added one module at a time), so a request that fits that framework is usually the fastest kind of item to ship.
If your audit needs a report psLens does not have, or you want a recurring security check automated, tell us. psLens is onboarding design partners, and partner requests set the build order.
How to influence the roadmap
Three ways an item moves up the queue:
It blocks a deal. Tell us during contracting.
It blocks a deployment in progress. Tell us in the customer Slack channel or via the contact page.
It is something many customers have asked for independently. We watch for patterns across customer conversations and re-rank when one emerges.
We do not run a public voting board. We do read every email.
13 - FAQ
Frequently asked questions about psLens: supported PeopleTools versions, security, deployment, and commercial terms.
Frequently Asked Questions
Quick answers to the questions we get most often. If your question is not here, reach out through the contact page.
Getting Started
Do I need App Designer to use psLens?
No. psLens is an alternative to opening App Designer for research, auditing, and monitoring work. Your developers still use App Designer for building and modifying PeopleSoft objects. psLens is for everything else (search, security audits, process monitoring, IB monitoring, reporting).
How long does setup take?
A typical first-time install is under an hour of real work: install the SWS framework in your PeopleSoft environment, deploy your psLens instance, point it at your SWS endpoint, and log in. The installation guide walks through every step with Docker and bare-metal examples.
Can I try psLens without installing the SWS framework?
No. SWS is how psLens reaches PeopleSoft; there is no alternate data path. The demo is the right way to see it running against a live environment before you commit to an install. SWS documentation lives at sws.books.cedarhillsgroup.com.
Which PeopleTools versions are supported?
psLens relies on standard PeopleTools metadata tables (PSRECDEFN, PSPNLDEFN, PSCLASSDEFN, process scheduler tables, Integration Broker tables) that have been stable for many PeopleTools releases. If you are on a currently supported PeopleTools release, psLens will run against it. Ask on the demo call if you have a specific version in mind.
What is the technology stack used by psLens?
A single Go binary. Rendering happens server-side and updates are pushed to the browser as HTML fragments over Server-Sent Events using Datastar. There is no React or Angular bundle to ship, and nothing from PeopleSoft is cached in the browser. See the Architecture Overview for details.
Security
Is psLens really read-only?
Yes. psLens does not have a code path that writes to PeopleSoft. It issues read queries through the SWS framework, which itself only answers queries against a whitelisted set of metadata tables. See the Security & Trust page for the full story.
What permissions does the SWS service account need in PeopleSoft?
Read access to the whitelisted PeopleTools metadata tables. No write access. No access to transactional business tables. The whitelist ships with psLens and SWS; you can review and narrow it before you approve it in your environment.
Does psLens store a copy of our PeopleSoft data?
No. psLens stores two things: alert history (short retention, meant to show what is currently wrong) and report output (kept for 90 days so you can review past audit findings). It does not copy employee records, financial transactions, HR data, or any other business data into its own storage.
There can be some temporary caching in memory on the server to facilitate rendering and alert/report generation, but this is short-lived and does not persist beyond the lifetime of the request or the retention period for alerts and reports.
Where does the data live?
Inside your dedicated psLens instance. Every customer gets their own isolated deployment; there is no shared multi-tenant backend. See Security & Trust for deployment isolation details.
Does psLens cache or store PeopleSoft data in my web browser?
No. psLens renders pages on the server and streams them as HTML fragments. The browser displays the HTML; it does not write metadata or credentials to LocalStorage, SessionStorage, or IndexedDB. As soon as the browser tab is closed, the data is cleared from client memory.
Deployment
Can I host psLens inside my own infrastructure?
Yes. The default is a dedicated instance hosted on fly.io, but psLens ships as a Go binary and a Docker image, so you can run it in your own cloud account, Kubernetes cluster, or on a Linux VM. The installation guide covers Docker, systemd, and air-gapped setups.
Does psLens work in an air-gapped environment?
Yes. The installation docs include instructions for environments with no outbound internet access. psLens does not phone home and does not require outbound connectivity at runtime beyond reaching your SWS endpoint.
How do upgrades work?
Upgrades replace the psLens binary or Docker image. Configuration stays in config.yaml or environment variables. Alert and report history is preserved across upgrades. See the upgrade section of the installation guide.
Day-to-Day Use
Can psLens connect to multiple PeopleSoft environments?
Yes. A single psLens instance can be configured to connect to multiple databases (DEV, TEST, PROD). The database selector appears on every search and report page. See configuration.
Can I compare objects across environments?
Yes. The Project Compare report compares project items across databases, useful after migrations to confirm what actually landed where.
Can I share or export what I find?
Yes. Every PS object detail page and every completed report can be exported as Markdown. The output is plain text that works in wikis, PRs, documentation sites, or as input to AI tools. See the AI enablement use case.
Commercial
How is psLens sold?
psLens is sold as a flat-rate subscription of $500/month with unlimited seats/users and PeopleSoft environments. You can monitor multiple environments under the same subscription without additional charges. If you add a new staging or project database, that can be monitored as part of the standard licencing. No hidden fees.
There is a one-time setup fee:
$2,500 for CHG-managed deployments (hosted on Fly.io).
$4,500 for self-hosted deployments (composed of the standard $2,500 implementation fee plus a $2,000 self-host setup fee).
Setup fees cover SWS configuration, installation assistance, whitelisting setup, and up to 10 hours of collaborative VM, network, and firewall setup support.
Why is there an extra charge for self-hosting?
Self-hosting requires additional setup and support to ensure the environment is correctly configured, networked, and secured. The extra fee covers the additional effort and resources needed for a self-hosted deployment compared to a CHG-managed deployment. Self-Hosting is unique across each customer environment, requiring tailored configuration and support for each deployment and possible discovery, troubleshooting, and validation steps to ensure the environment operates correctly. The extra charge to self-hosted deployments is to recoup the additional effort and resources expended to set up and validate the self-hosted environment.
Note: This standard pricing applies to single-organization end-users only. It does not apply to hosting providers, managed service providers (MSPs), or organizations that host and manage PeopleSoft databases for multiple third-party clients. Contact us for multi-client custom pricing.
What kind of support is included?
Setup assistance is included with every deployment. Ongoing support terms are part of the agreement and vary by customer. We will walk through it on the demo call.
Who builds psLens?
psLens is built by Cedar Hills Group, a PeopleSoft consultancy. The same team that built the SWS framework builds psLens.
Code & Supply Chain
Can we review the source code?
psLens is closed-source, but Cedar Hills Group offers a read-only source review under NDA as part of procurement. See Code & Supply Chain for details.
Is the code scanned for vulnerabilities?
Yes. We use govulncheck in our continuous integration pipeline to detect known Go package vulnerabilities on every build and run daily scans. Dependabot is enabled to monitor and automatically raise pull requests for dependency updates (Go modules, GitHub Actions, and Docker base images). See Code & Supply Chain.
Yes. Front psLens with a reverse proxy that handles SSO (Cloudflare Access, oauth2-proxy, Pomerium, Tailscale, nginx/Traefik with OIDC). This is the recommended production pattern today. Native OIDC inside psLens is on the roadmap. See Authentication & Access.
Does psLens have role-based access control?
No, by design. Because psLens is read-only and the query surface is whitelisted on the PeopleSoft side, the access boundary is “who can log in to psLens at all,” not “what role do they have inside it.” Per-user authorization is enforced at the reverse-proxy / IdP layer if you need it.
This is something we are exploring in a future release, pending customer feedback.
How are passwords stored?
No end-user passwords. psLens uses email magic-link or reverse-proxy SSO. The only password-shaped secret psLens holds is the SWS service-account credential, encrypted at rest with AES-256-GCM. See Data Handling & Logging → Encryption.
Can we require MFA?
Yes. Enforce MFA at the IdP layer with reverse-proxy SSO. Magic-link auth on its own is single-factor.
Audit & Logging
Where do logs go?
psLens writes structured logs to stderr only. Your container runtime decides what happens next: Docker logging driver, systemd journal, fly.io log stream, or Kubernetes log shipper, then on to your SIEM.
Does psLens retain logs?
No. psLens does not manage log retention. Whatever your container runtime or log aggregator does is what you get. This is intentional, so your existing log-retention SLA covers psLens without us getting in the way.
Compliance
Are you SOC 2 certified?
Not yet. Certification is on the roadmap. In the interim, Compliance & Vendor maps the relevant Trust Service Criteria to current controls, and we complete SIG / CAIQ questionnaires in detail.
Where does our data physically live?
In your dedicated psLens instance. Managed deployments run in the fly.io region you choose at provisioning. Self-hosted: wherever you run the container. There is no shared multi-tenant backend, so there is no other location for data to exist.
Who are your sub-processors?
Depends on your deployment mode. For managed deployments: fly.io (hosting) and the SMTP provider for magic-link auth (if enabled). GHCR is touched only at docker pull time, not at runtime. Self-hosters have none of the above. See Compliance & Vendor → Sub-Processors.
What happens if Cedar Hills Group goes away?
You keep the Docker image you’re running, and self-hosting works without any Cedar Hills Group infrastructure. All state is in the per-customer /data volume, portable to your own infrastructure on demand. See Compliance & Vendor → Business Continuity.
Pending customer feedback, we can potentially look at a code escrow of the GitHub source code.
Operations
What load does psLens put on my PeopleSoft environment?
Small, and you control all of it. There are three sources of queries:
Browsing and search run on demand when someone uses the UI. Each page issues a handful of paged queries against PeopleTools metadata tables, comparable to a person opening a page in PIA. There is no background crawler or sync job; psLens fetches what is on screen and nothing else.
Alert checks are the only recurring traffic. They run on a configurable interval (default every 5 minutes), and each check is a small number of bounded queries. You can change the interval per database, disable individual checks, or turn alerting off entirely for an environment. See configuration.
Reports run only when someone starts one.
All of this arrives through the Integration Broker REST endpoint as ordinary service operation requests, so it appears in your existing IB monitoring like any other integration. psLens never opens a connection to the database itself.
What exactly does SWS install in my PeopleSoft environment?
A standard App Designer project, migrated dev-first through your normal change process: roughly 100 objects under the CHG_/C_ prefixes, two service operations, and two roles. What SWS Installs in PeopleSoft lists the full breakdown for the admin, DBA, or security reviewer who has to approve it.
What’s the backup procedure?
Tar /data/nats and /data/projects nightly; back up PSLENS_MASTER_KEY separately and out-of-band. Restore is “untar into a fresh volume and start the container.” See Deployment & Operations → Backup.
There is no critical data stored in the application and technically, all the data could be left behind in the event of a failure. The backup procedure is primarily for convenience and peace of mind, not a strict requirement for disaster recovery.
How do I upgrade?
Pin production to vMAJOR.MINOR, then docker compose pull && docker compose up -d. The data volume survives the restart. Roll back by pinning to the prior patch tag. See Deployment & Operations → Upgrades.
What’s the resource footprint?
Small. 1 vCPU and 512 MB RAM as a minimum, 1 GB disk for /data. psLens is a single Go process; scaling is vertical. See Deployment & Operations → Sizing.
What network egress does psLens need?
HTTPS to your SWS endpoint, and SMTPS to your mail server only if magic-link auth is enabled. Nothing else: no telemetry, no update checks, no callback to Cedar Hills Group. Egress filtering is straightforward.
Does psLens have a Prometheus endpoint?
Not today. GET /healthz covers liveness; structured slog covers everything else. A native /metrics endpoint is on the roadmap.
✨ Apply to join the psLens Design Partner Program — early access, dedicated setup, and your requests set the build order.
Apply Now →