Alert checks run on a 5-minute timer against every connected database. Findings appear on the dashboard with severity, and clear automatically when the underlying condition resolves. There is no acknowledge or dismiss.
Alerts surface on the dashboard with severity and context, then hand the operator into the exact follow-up view
How the Alert System Works
psLens runs a set of alert checks on a timer (default: every 5 minutes)
Each check queries one or more connected databases
If a check finds something worth noting, it creates alert items with a severity level
Alert results appear on the dashboard immediately
When the underlying issue resolves, the alert clears automatically on the next check cycle
Alerts always reflect the current state of the system.
Alert Severity Levels
Severity
Color
Meaning
Critical
Red
Something is actively wrong and needs immediate attention
Warning
Yellow
Something should be investigated. It may become a problem.
Info
Blue
Low-priority finding; worth noting but not urgent
Alert Data Retention
Alert results are stored for 15 minutes. This means the dashboard shows findings from the most recent check cycle. Once an issue is resolved and the next check runs cleanly, the alert data expires.
Configuring Alerts
Alerts are configured in config.yaml. You can:
Enable or disable the entire alert system (alerts.enabled)
Set how often checks run (alerts.intervalMinutes)
Enable or disable individual checks
Set thresholds for stalled/long-running checks
Set lookback windows for error checks
Exclude specific process names or IB operation names from checks
See Configuration for the full configuration reference.
Alert Categories
Browse alerts by category:
Process Scheduler: Long-running processes, errors, backlogged jobs, locked operators, critical process monitoring
Web Server / WebLib: Alerts when the PeopleSoft Web Server or WebLib endpoints fail to respond
Security: Failed login detection and authentication monitoring
Generic SWS Alerts: Define custom, queryable alert rules using PsoftQL against any whitelisted tables
See Alerts in Action
The catalog tells you what psLens checks. A live walkthrough shows what matters operationally: how alerts appear, how they clear, and how quickly your team can move from a card on the dashboard to the underlying problem.
Process Scheduler alerts: long-running processes, process errors, backlogged processes, queue latency, locked operators, and critical process monitoring.
Process Scheduler alerts monitor your PeopleSoft batch processing environment for errors, stalls, and missing critical runs.
Schedulers that have not updated their heartbeat status in PSSERVERSTAT recently
1.1 - Long-Running Processes
This alert finds Process Scheduler requests that are currently in Initiated or Processing status and have been running longer than their expected d…
New to psLens? This page documents one specific alert. To see how it appears on the dashboard,
what operators investigate, and how teams tune it, start with a live walkthrough.
Alert ID:long_running_processesCategory: Process Scheduler
Default threshold: Dynamic (4x rolling median, min 10 min baseline) or static fallback (20 minutes)
What This Alert Detects
This alert finds Process Scheduler requests that are currently in Initiated or Processing status and have been running longer than their expected duration.
Instead of relying solely on a static global threshold, psLens dynamically calculates an expected duration for each process using its own history:
It fetches the last 10 successful run durations for the specific process name (PRCSNAME).
It calculates the rolling median runtime of those successful runs.
It raises an alert if the current execution duration exceeds a multiple of the median (default: $4\times$ the median, with a minimum baseline of 10 minutes).
If no successful runs are found (e.g. a brand new process or a process that has never completed successfully), it falls back to the static global thresholdMinutes (default: 20 minutes).
A process that has been running for a long time may be stuck, consuming excessive server resources, or waiting on a lock or resource that will never become available.
Severity Logic
Condition
Severity
Running longer than dynamic threshold (or static fallback)
Warning
For example:
If a process usually runs in 3 minutes: median is 3m. $4\times 3 = 12$ minutes. The alert triggers if it runs for 12 minutes or more.
If a process usually runs in 1 minute: median is 1m. $4\times 1 = 4$ minutes. Since this is below the 10-minute minimum baseline, the baseline is used: the alert triggers if it runs for 10 minutes or more.
If a process has no history: fallback is used. The alert triggers if it runs for 20 minutes or more.
What Gets Checked
The alert queries the Process Scheduler request table for processes in run status 6 (Initiated) or 7 (Processing). For each result, it calculates how long the process has been running based on its BeginDttm (begin datetime) and the current server time.
Processes with no BeginDttm value are skipped (the process hasn’t truly started yet).
Alert Details
Each alert item includes:
Process name (PRCSNAME)
Process instance number
How long the process has been running (in minutes)
The rolling median runtime (if available, in minutes)
The operator who submitted the request
A link to the Process Monitor detail page for that instance
Configuration
alerts:checks:long_running_processes:enabled:truethresholdMinutes:20# Fallback static minutes when history is emptyanomalyMultiplier:4.0# Multiplier applied to rolling mediananomalyMinBaselineMinutes:10# Minimum baseline runtime before alertingexcludeProcesses:# Process names to skip- SOME_LONG_BATCH_JOB
Setting
Default
Description
thresholdMinutes
20
Fallback static minutes a process must be running to trigger an alert if no successful run history exists.
anomalyMultiplier
4.0
Multiplier applied to the rolling median duration to calculate the dynamic threshold.
anomalyMinBaselineMinutes
10
The minimum baseline duration in minutes. Dynamic thresholds are capped to be at least this value to prevent false alerts on very fast processes.
excludeProcesses
[]
List of process names to exclude from this check. Use for known long-running processes that are expected to take a long time.
How to Respond
Click the alert link to go directly to the Process Monitor entry for the flagged process
Review the process details: what it is, who submitted it, when it started
Check whether the process appears to be making progress or is stuck
If the process is genuinely stuck, you may need to cancel it from PeopleSoft’s Process Monitor
Investigate why it got stuck: look for locks, resource contention, or data issues
Tuning the Threshold
The right threshold depends on your environment. You can adjust anomalyMultiplier or anomalyMinBaselineMinutes globally or per-database to reduce noise, or use excludeProcesses to ignore specific jobs entirely.
1.2 - Process Errors
This alert finds Process Scheduler requests that have failed within a configurable lookback window.
New to psLens? This page documents one specific alert. To see how it appears on the dashboard,
what operators investigate, and how teams tune it, start with a live walkthrough.
Alert ID:process_errorsCategory: Process Scheduler
Default lookback: 24 hours
What This Alert Detects
This alert finds Process Scheduler requests that have failed within a configurable lookback window. It catches processes that ended in one of three error statuses:
Run Status
PeopleSoft Code
Meaning
Error
3
The process ended with an error condition
Not Successful
10
The process ran but reported a non-success result
Unable to Post
12
The process output could not be delivered
Severity Logic
Process Type
Status
Severity
Recurring (on a recurrence schedule)
Error (3), Not Successful (10), Unable to Post (12)
Critical
Non-Recurring (ad-hoc execution)
Error (3), Not Successful (10), Unable to Post (12)
Warning
Recurring Processes: Any failure fires Critical immediately.
Non-Recurring Processes: Fire Warning after the thresholdMinutes grace period.
Alert Details
Each alert item includes:
Process name and instance number
Run status label (Error, Not Successful, Unable to Post)
The operator who submitted the request
When the process ran
A link to the Process Monitor detail page for that instance
Configuration
alerts:checks:process_errors:enabled:truelookbackHours:24# How far back to look for failuresthresholdMinutes:15# Grace period buffer in minutes for non-recurring errorsexcludeProcesses:# Process names to skip- KNOWN_FLAKY_PROCESS
Setting
Default
Description
lookbackHours
24
Number of hours back to search for failed processes
thresholdMinutes
0
Grace period buffer (in minutes) for non-recurring process errors before they raise a Warning alert.
excludeProcesses
[]
List of process names to exclude from this check
How to Respond
Click the alert link to go directly to the Process Monitor entry for the failed process
Review the process details: run status, begin and end times, server
Look for output files or log information that might explain the failure
Check whether this is a one-time failure or a repeating issue
If the process needs to be rerun, submit a new request from PeopleSoft
Common Causes of Process Failures
Data errors: The process encountered unexpected data (null values, bad formats, constraint violations)
Resource issues: The server ran out of memory or disk space
Timeout: The process exceeded its allowed run time
Configuration problems: A required configuration parameter is missing or incorrect
Dependency failures: A process that runs after another failed because the first one didn’t complete correctly
Reducing Alert Noise
If certain processes fail regularly and you’re already tracking them separately, add them to excludeProcesses to keep the alert list focused on unexpected failures.
1.3 - Backlogged Processes
This alert finds Process Scheduler requests that are in Queued or Blocked status and whose scheduled run time (RUNDTTM) has already passed by more …
New to psLens? This page documents one specific alert. To see how it appears on the dashboard,
what operators investigate, and how teams tune it, start with a live walkthrough.
Alert ID:backlogged_processesCategory: Process Scheduler
Default threshold: 30 minutes
What This Alert Detects
This alert finds Process Scheduler requests that are in Queued or Blocked status and whose scheduled run time (RUNDTTM) has already passed by more than the configured threshold. This alert focuses exclusively on processes currently waiting to start. Once a process begins running, it is cleared from this alert and is instead tracked by the Queue Latency alert.
Severity Logic
Condition
Severity
Overdue by more than thresholdMinutes
Warning
Overdue by more than thresholdMinutes × 2
Critical
For example, with the default threshold of 30 minutes:
A process scheduled 40 minutes ago that is still queued → Warning
A process scheduled 65 minutes ago that is still queued → Critical
What Gets Checked
The alert queries the Process Scheduler request table for processes in run status 5 (Queued) or 18 (Blocked) whose RUNDTTM (scheduled run datetime) is in the past. For each result, it calculates how far past the scheduled time the process is based on RUNDTTM and the current server time.
Processes with no RUNDTTM value are skipped. Completed or active runs are skipped.
Alert Details
Each alert item includes:
Process name (PRCSNAME)
Process instance number
How long the process is overdue (in minutes)
Current run status (Queued or Blocked)
The operator who submitted the request
A link to the Process Monitor detail page for that instance
Configuration
alerts:checks:backlogged_processes:enabled:truethresholdMinutes:30# Minutes overdue before flagging as WarningexcludeProcesses:# Process names to skip- SOME_LOW_PRIORITY_JOB
Setting
Default
Description
thresholdMinutes
30
Minutes past the scheduled run time before a queued/blocked process triggers a Warning alert. Critical fires at 2× this value.
excludeProcesses
[]
List of process names to exclude from this check. Use for processes that are known to queue for a long time and are not a concern.
How to Respond
Click the alert link to go directly to the Process Monitor entry for the flagged process
Check whether the Process Scheduler server is running and accepting work
Look at how many processes are currently running on the server. It may have hit its concurrency limit
Check if the process type or class has reached its maximum allowed concurrent instances
For blocked processes, investigate what is blocking them (dependencies, server restrictions, etc.)
If the Process Scheduler server is down, restart it from PeopleSoft’s Process Scheduler administration
Tuning the Threshold
The right threshold depends on how busy your Process Scheduler is. In environments where many jobs are submitted at once, some queuing is normal. Set thresholdMinutes high enough to avoid false positives during peak batch windows but low enough to catch genuine problems. You can also use excludeProcesses to exclude specific low-priority processes that are known to queue for long periods.
1.4 - Locked OPRID Scheduled Processes
This alert finds queued or scheduled Process Scheduler requests where the submitting operator’s account (OPRID) is currently locked in PSOPRDEFN (A…
New to psLens? This page documents one specific alert. To see how it appears on the dashboard,
what operators investigate, and how teams tune it, start with a live walkthrough.
Alert ID:locked_oprid_processesCategory: Process Scheduler
What This Alert Detects
This alert finds queued or scheduled Process Scheduler requests where the submitting operator’s account (OPRID) is currently locked in PSOPRDEFN (ACCTLOCK = 1).
When an operator account is locked after a process has been queued, PeopleSoft will refuse to run the process, or run it under the locked account and immediately fail. PeopleSoft does not surface this condition anywhere obvious: Process Monitor shows the job queued, the operator’s user page shows them locked, but nothing connects the two. This alert does.
Common scenarios:
A service or batch account had its password expire and was locked
An employee left and their account was locked, but scheduled jobs were not transferred
A security lockout from failed login attempts affected a batch account
Severity Logic
All findings are reported at Warning severity. Every queued or scheduled process with a locked submitting account is flagged.
What Gets Checked
The alert queries PSPRCSRQST joined to PSOPRDEFN for process requests in Queued or Scheduled run status where the submitting OPRID has ACCTLOCK = 1.
Alert Details
Each alert item includes:
Process name and instance number
Submitting OPRID (with link to User detail page)
Current run status (Queued, Scheduled, etc.)
Scheduled run date/time
Recurrence name (if applicable)
Configuration
alerts:checks:locked_oprid_processes:enabled:trueexcludeProcesses:[]# Process names to ignore
Setting
Default
Description
excludeProcesses
[]
List of process names to exclude from this check
How to Respond
Click the alert link to open the Process Monitor detail page for the affected instance
Identify the locked OPRID shown in the alert
Navigate to the User detail page to review the account lock status
Either unlock the account (if appropriate) or re-queue the process under an active operator account
For recurring processes, update the recurrence definition to use a non-locked operator
Investigate why the account was locked. If it was a failed login lockout, check the Failed Logins alert for additional context
Tables Queried
Table
Description
PSPRCSRQST
Process Scheduler request queue
PSOPRDEFN
Operator definitions (user accounts)
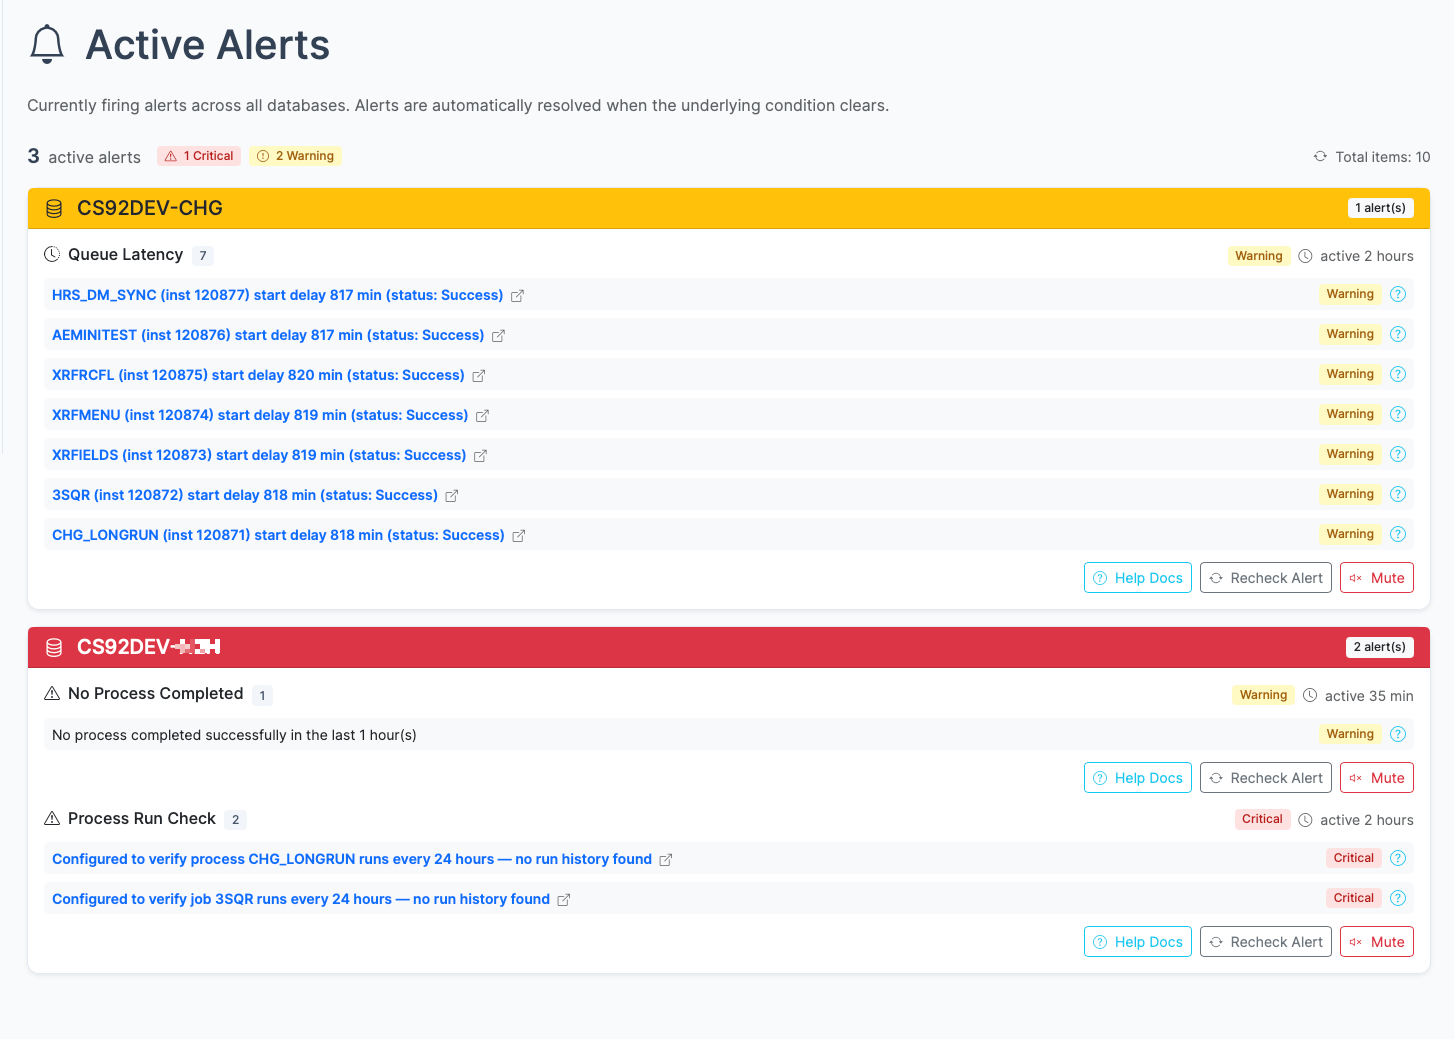
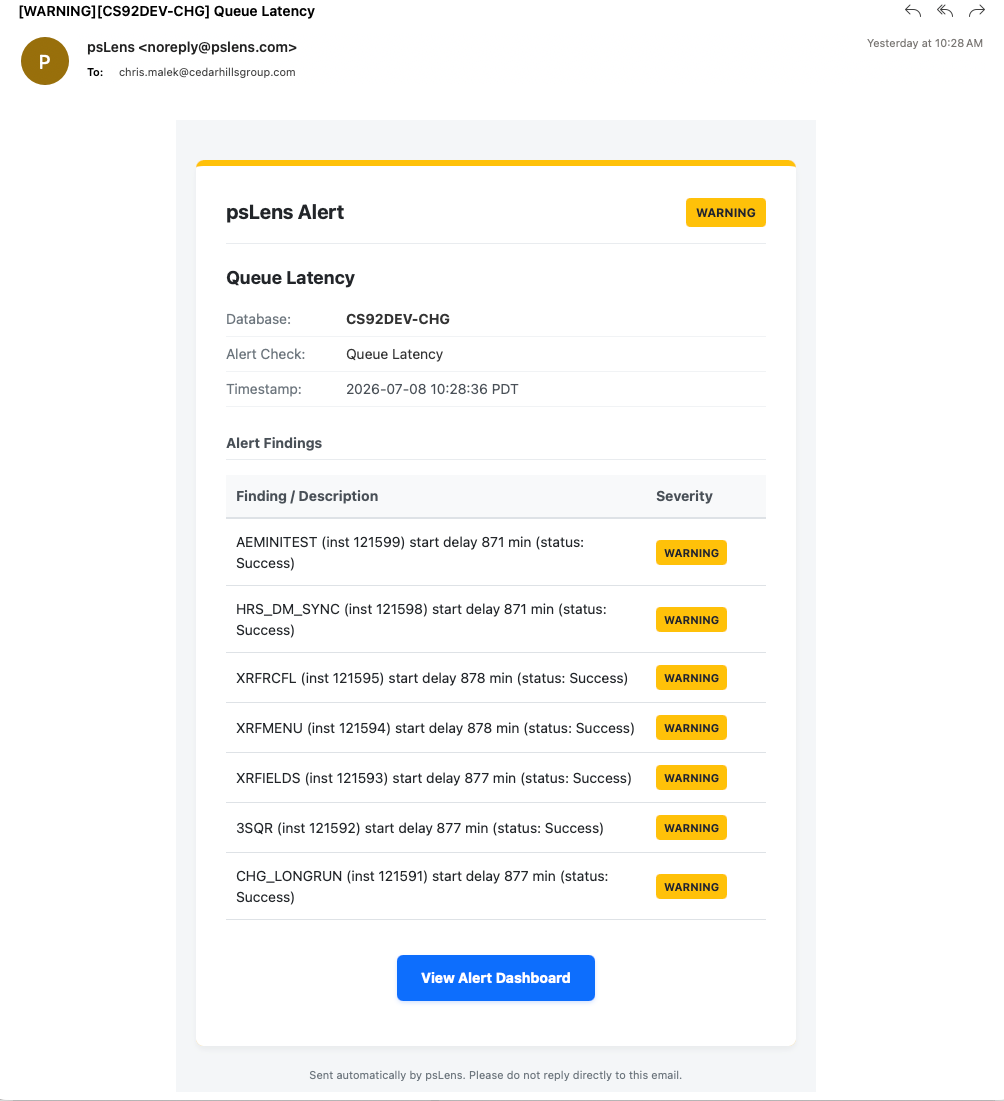
1.5 - Queue Latency
This page documents the queue latency alert, which monitors the delay between a process’s scheduled run time and its actual start time.
New to psLens? This page documents one specific alert. To see how it appears on the dashboard,
what operators investigate, and how teams tune it, start with a live walkthrough.
Alert ID:queue_latencyCategory: Process Scheduler
Default threshold: 15 minutes
Queue Latency Alert in psLens showing processes with start delays exceeding the threshold
What This Alert Detects
This page documents the queue latency alert, which monitors the delay between a process’s scheduled run time and its actual start time. It queries the PSPRCSRQST table for processes that have started running or completed within the lookback window and calculates the delay as BEGINDTTM - RUNDTTM.
Severity Logic
Condition
Severity
Start delay more than thresholdMinutes
Warning
For example, with the default threshold of 15 minutes:
A process scheduled for 10:00 that started running at 10:20 → Warning
What Gets Checked
The alert queries the Process Scheduler request table (PSPRCSRQST) for processes whose BEGINDTTM (begin datetime) is in the past lookback window (default 24 hours). For each process, it calculates the difference between BEGINDTTM and RUNDTTM (scheduled run datetime).
Processes that have not started running yet (empty BEGINDTTM value) are skipped. Active queuing checks are handled by the backlogged_processes alert.
Alert Details
Each alert item includes:
Process name (PRCSNAME)
Process instance number
Start delay duration (in minutes)
Current run status (Initiated, Processing, Success, Error, etc.)
The operator who submitted the request
A link to the Process Monitor detail page for that instance
Configuration
alerts:checks:queue_latency:enabled:truethresholdMinutes:15# Minutes delay before flagging as WarninglookbackHours:24# Hours to look back for completed/running processesexcludeProcesses:# Process names to skip- LOW_PRIORITY_AE
Setting
Default
Description
thresholdMinutes
15
Minutes of start delay before a process triggers a Warning alert.
lookbackHours
24
Hours to look back for processes to verify.
excludeProcesses
[]
List of process names to exclude from this check. Use for processes that are known to delay and are not a concern.
How to Respond
Click the alert link to go to the Process Monitor entry for the flagged process.
Review the process server definition to identify if it is running and accepting work.
Check the max concurrent limits configured on the Process Scheduler server or category definitions.
Verify if other higher-priority processes occupied all available channels.
If the delay is caused by category stalls, adjust the process class concurrency settings.
Tuning the Threshold
Environments with heavy batch schedules may experience normal queue delays during peak hours. Set thresholdMinutes high enough to prevent alerts on minor delays but low enough to flag scheduler capacity bottlenecks or server category stalls.
1.6 - Process Run Check
This alert monitors configured critical processes and fires when one has not completed successfully within its expected time window.
New to psLens? This page documents one specific alert. To see how it appears on the dashboard,
what operators investigate, and how teams tune it, start with a live walkthrough.
Alert ID:process_run_checkCategory: Process Scheduler
What This Alert Detects
This alert monitors configured critical processes and fires when one has not completed successfully within its expected time window. It is the alert equivalent of the Process Run Check report. The difference is that this runs automatically on every check cycle and surfaces failures on the dashboard without any manual action.
Use this alert for processes that must run on a regular cadence, such as:
Nightly batch jobs that must complete before business hours
Data synchronization processes that run every few hours
Critical integrations that should run multiple times per day
Post-maintenance verification of essential processes
Severity Logic
Condition
Severity
Process has run recently but not successfully in the configured window
Warning
Process has no run history at all
Critical
Configuration
Process checks are configured per process name in config.yaml. Each entry specifies the process name and the number of hours within which a successful run is expected.
alerts:checks:process_run_check:enabled:trueprocessChecks:SOMEJOBNAME:24# Must run successfully within 24 hoursANOTHERJOB:8# Must run successfully within 8 hoursNIGHTLY_ETL:12# Must run successfully within 12 hours
Setting
Default
Description
processChecks
{}
Map of process name to expected run window in hours
If a process name is listed with 0 or a negative value, the check defaults to a 24-hour window.
What Gets Checked
For each configured process, psLens queries PSPRCSRQST for successful runs (RunStatus = 9 / Success) within the configured time window. If none are found, it then checks for any run history to determine severity:
No successful run in window + recent run history found: Warning
No run history at all: Critical
Alert Details
Each alert item includes:
Process name
Configured threshold (hours)
Last known run status (if any history exists)
Last known run time (if any history exists)
Link to the Process Definition detail page
How to Respond
Click the alert link to open the Process Definition detail page for the affected process
Review recent run history to understand what happened. Did the process run but fail, or did it not run at all?
Check the Process Scheduler server configuration if the process never ran
Investigate error logs if the process ran but ended in a failed state
If the process ran and succeeded but outside the expected window, consider adjusting the threshold in config.yaml
Tables Queried
Table
Description
PSPRCSRQST
Process Scheduler request queue and run history
1.7 - Process Scheduler Down
This alert triggers when any active Process Scheduler server registered in PSSERVERSTAT has not reported a status update (heartbeat) within the con…
New to psLens? This page documents one specific alert. To see how it appears on the dashboard,
what operators investigate, and how teams tune it, start with a live walkthrough.
Alert ID:process_scheduler_downCategory: Process Scheduler
Default threshold: 10 minutes
What This Alert Detects
This alert triggers when any active Process Scheduler server registered in PSSERVERSTAT has not reported a status update (heartbeat) within the configured amount of time.
Note
The alert automatically ignores servers whose status is explicitly set to "1" (Down) or "7" (Suspended - Offline), as these represent intentionally stopped or offline schedulers. It will only flag active server configurations (e.g., Running, Suspended, Error, Overloaded) that have stalled or stopped updating.
Severity Logic
Condition
Severity
Heartbeat stale by more than thresholdMinutes
Warning
Heartbeat stale by more than thresholdMinutes × 2
Critical
For example, with the default threshold of 10 minutes:
A scheduler that hasn’t heartbeat’ed for 12 minutes → Warning
A scheduler that hasn’t heartbeat’ed for 22 minutes → Critical
What Gets Checked
The alert queries the PSSERVERSTAT table to retrieve all server status definitions. For each active scheduler (status not Down/Offline), it calculates the elapsed time since its LASTUPDDTTM timestamp. If that time exceeds the configured threshold, the alert fires.
Alert Details
Each alert item includes:
Server name (SERVERNAME)
Current status code and friendly string status (e.g., Running, Error, Suspended)
Last heartbeat timestamp (LASTUPDDTTM)
Host name (SRVRHOSTNAME)
A detailed explanation of how long the heartbeat has been stale
A link to the Server Definition detail page for that server
Configuration
alerts:checks:process_scheduler_down:enabled:truethresholdMinutes:10# Minutes stale before flagging as WarningexcludeProcesses:# Server names (e.g., PSUNX, PSNT) to skip- PSUNX_OLD
Setting
Default
Description
thresholdMinutes
10
Minutes of stale heartbeat status updates before a scheduler triggers a Warning alert. Critical fires at 2× this value.
excludeProcesses
[]
List of server names to exclude from this check. Use for retired scheduler definitions that linger in PSSERVERSTAT but aren’t cleaned up.
How to Respond
Click the alert link to go directly to the Server Definition detail page for the affected scheduler.
Check the Host Name where the Process Scheduler daemon runs.
Access the server host and verify whether the Process Scheduler processes (e.g., psadmin, PSAESRV, etc.) are running.
Review the Process Scheduler logs (e.g., TUXLOG, SCHED_*.LOG) on the host machine to diagnose why the process has hung or crashed.
If the scheduler has hung, stop the process scheduler daemon and restart it using psadmin.
If the server definition is obsolete or decommissioned, consider deleting it in PeopleSoft Server Definitions configuration to clean up the PSSERVERSTAT row.
1.8 - No Process Completed
This alert fires when no process has successfully completed within the configured lookback window. It is a broad scheduler health check.
New to psLens? This page documents one specific alert. To see how it appears on the dashboard,
what operators investigate, and how teams tune it, start with a live walkthrough.
Alert ID:no_process_completedCategory: Process Scheduler
Default lookback: 1 hour
What This Alert Detects
This alert fires when no process has successfully completed within the configured lookback window. It is a broad scheduler health check. If nothing has finished successfully in the past hour, the Process Scheduler may be down, stalled, or not dispatching jobs.
This is distinct from the Process Run Check, which monitors specific named processes. This alert monitors overall scheduler activity.
Severity Logic
Condition
Severity
Zero successful completions in the lookback window
Warning
What Gets Checked
The alert queries PSPRCSRQST for any process with RunStatus = 9 (Success) and an end datetime within the lookback window. If no rows are returned, the alert fires.
Only one result is needed to resolve the alert. The check uses a limit of 1 for efficiency.
Alert Details
When firing, the alert produces a single item:
Summary: No process completed successfully in the last N hour(s)
Lookback hours used for the check
Configuration
alerts:checks:no_process_completed:enabled:truelookbackHours:1# How far back to look for completed processes
Setting
Default
Description
lookbackHours
1
How many hours back to look for a successfully completed process.
How to Respond
Check PeopleSoft’s Process Monitor to see if any processes are running, queued, or have recently completed
Verify the Process Scheduler server is running (PeopleSoft > PeopleTools > Process Scheduler > Servers)
If processes are queued but not running, the scheduler daemon may need to be restarted
If this fires regularly during off-hours when no jobs run, increase lookbackHours or disable the alert for those periods
Tuning
If your environment has periods where no batch jobs are expected to run (e.g., overnight maintenance windows), consider increasing lookbackHours to cover those gaps, or disable the alert entirely during those windows.
1.9 - Stalled Recurrences
This alert fires when a scheduled recurring process has finished a run recently (within the lookback window) but does not have a subsequent schedul…
New to psLens? This page documents one specific alert. To see how it appears on the dashboard,
what operators investigate, and how teams tune it, start with a live walkthrough.
Alert ID:stalled_recurrencesCategory: Process Scheduler
Default lookback: 336 hours (14 days)
What This Alert Detects
This alert fires when a scheduled recurring process has finished a run recently (within the lookback window) but does not have a subsequent scheduled instance.
In PeopleSoft, the Process Scheduler is responsible for scheduling the next run of a process based on its recurrence definition when the current one runs. If the scheduler is interrupted, a database is refreshed, or an error occurs during the scheduling process, the recurring job can fall off the schedule. This check identifies those occurrences so they do not go unnoticed.
Severity Logic
Condition
Severity
The latest completed run failed (status was Error, Not Successful, or Unable to Post) and no next run is scheduled
Critical
The latest completed run succeeded or was cancelled and no next run is scheduled
Warning
What Gets Checked
The alert queries PSPRCSRQST for all process requests that have a recurrence name assigned. It then groups these requests by:
Process Name (PRCSNAME)
Run Control ID (RUNCNTLID)
User ID (OPRID)
Recurrence Name (RECURNAME)
For each unique combination, if the latest instance has a completed status and there are no active/pending requests (such as Queued, Blocked, Hold, Pending, Initiated, or Processing) to follow, the recurrence is flagged as stalled.
Alert Details
When firing, the alert produces an item for each stalled recurrence:
Summary: Recurrence RECURNAME for PRCSNAME — Stalled (Last status: STATUS)
Details:
prcsName: The process name
runCntlId: The run control ID
oprid: The user ID that submitted the process
recurName: The recurrence definition name
lastInstance: The process instance number of the last run
lastRunStatus: The status of the last run (e.g. Success, Error)
lastRunDttm: The date and time the last run was scheduled
Configuration
alerts:checks:stalled_recurrences:enabled:truelookbackHours:336# How far back to look for completed runs (14 days)
Setting
Default
Description
lookbackHours
336
How many hours back to look for the last completed run of a recurrence.
How to Respond
Click the link in the alert detail to view the last process instance in the Process Monitor.
Check the logs for that instance if the status was an error.
If the recurrence should continue running, go to PeopleSoft and submit the process again on the same recurrence name using the matching User ID and Run Control ID.
If the recurrence has intentionally finished its life cycle (e.g., reached its end date), you can ignore the warning or configure the process in the exclusions list.
Integration Broker alerts monitor your PeopleSoft IB infrastructure for errors, stalled messages, volume anomalies, and sync exceptions.
Where to start. For a new environment, enable IB Down, IB Dispatcher Down, IB No Active Domain, and IB Operation Errors first. These four catch the conditions that produce the most pages. Add stalled checks after tuning thresholds for your operations. Volume checks need 24 hours of history before they fire usefully.
Message nodes registered as down in PSNODESDOWN with blocked transactions
2.1 - IB Operation Errors
This alert finds asynchronous Integration Broker operation instances that are in Error or Timeout status within a configurable lookback window.
New to psLens? This page documents one specific alert. To see how it appears on the dashboard,
what operators investigate, and how teams tune it, start with a live walkthrough.
This alert finds asynchronous Integration Broker operation instances that are in Error or Timeout status within a configurable lookback window. These are messages that attempted to process but did not complete successfully.
An IB operation instance represents a single execution of a Service Operation through the Integration Broker. When an instance errors, the message did not reach its destination. The original publish/subscribe data is preserved in the IB tables and can usually be resubmitted from the Service Operations Monitor.
Severity Logic
Status
Severity
Error
Critical
Timeout
Warning
Error status means the processing actively failed. Timeout means it ran out of time, which may be a transient issue but still warrants investigation.
Alert Details
Each alert item includes:
Operation instance ID
Service operation name
Status (Error or Timeout)
The originating node
When the instance was created
A link to the IB Monitor detail page
Configuration
alerts:checks:ib_operation_errors:enabled:truelookbackHours:24# How far back to look for errorsexcludeOperations:# Operation names to skip- SOME_NOISY_OPERATION
Setting
Default
Description
lookbackHours
24
Number of hours back to search for error/timeout instances
excludeOperations
[]
List of IB operation names to exclude from this check
How to Respond
Click the alert link to go to the IB Monitor entry for the failed operation
Review the error details. The IB Monitor shows the error message or exception
Check whether this is a configuration issue (wrong endpoint, auth failure) or a data issue
If the message needs to be reprocessed, you can do so from PeopleSoft’s Service Operations Monitor
If this is a recurring operation, investigate the root cause before errors pile up
Relationship to Other IB Alerts
This alert finds operations that have already ended in error. For operations that are stuck in progress, see IB Operations Stalled.
For similar alerts on publication and subscription contracts, see:
This alert finds asynchronous Integration Broker operation instances that are stuck in New or Working status and have been in that state longer tha…
New to psLens? This page documents one specific alert. To see how it appears on the dashboard,
what operators investigate, and how teams tune it, start with a live walkthrough.
This alert finds asynchronous Integration Broker operation instances that are stuck in New or Working status and have been in that state longer than the configured threshold. These are messages that started processing (or are waiting to be processed) but have not completed in a reasonable amount of time.
Cross-reference with IB Dispatcher Down first. A stalled queue plus a down dispatcher is almost always the dispatcher.
Severity Logic
Condition
Severity
Stuck longer than thresholdMinutes
Warning
Stuck longer than thresholdMinutes × 2
Critical
For example, with the default threshold of 30 minutes:
An operation stuck for 35 minutes → Warning
An operation stuck for 65 minutes or more → Critical
Alert Details
Each alert item includes:
Operation instance ID
Service operation name
Current status (New or Working)
How long it has been stuck (in minutes)
The originating node
A link to the IB Monitor detail page
Configuration
alerts:checks:ib_operation_stalled:enabled:truethresholdMinutes:30# Minutes before flagging as WarningexcludeOperations:# Operation names to skip- BULK_SYNC_OPERATION
Setting
Default
Description
thresholdMinutes
30
Minutes an operation must be stuck to trigger a Warning. Critical fires at 2× this value.
excludeOperations
[]
List of IB operation names to exclude from this check. Use for known long-running operations.
How to Respond
Click the alert link to go to the IB Monitor entry for the stalled operation
Check whether the IB dispatcher/handlers are running on the PeopleSoft application server
Look for signs of a larger IB backlog (many operations in New status)
Check the gateway and connector configuration if the operation can’t reach a node
If the operation is safe to reprocess, you can cancel and resubmit from PeopleSoft’s Service Operations Monitor
Relationship to Other IB Alerts
This alert finds operations that are stuck in progress. For operations that have already ended in error, see IB Operation Errors.
For similar alerts on publication and subscription contracts, see:
This alert finds Integration Broker publication contracts that are in Error or Timeout status within a configurable lookback window.
New to psLens? This page documents one specific alert. To see how it appears on the dashboard,
what operators investigate, and how teams tune it, start with a live walkthrough.
This alert finds Integration Broker publication contracts that are in Error or Timeout status within a configurable lookback window.
In the PeopleSoft Integration Broker architecture, a publication contract tracks the delivery of a published message to a specific subscribing node. When a publication contract fails, it means a message that PeopleSoft published was not successfully delivered to one or more subscribers.
When This Matters
Publication contract errors typically mean:
An outbound message from PeopleSoft was not delivered to a downstream system
An integration partner did not receive data it was expecting
A workflow or data sync that depends on this message may be incomplete
Severity Logic
Status
Severity
Error
Critical
Timeout
Warning
Alert Details
Each alert item includes:
Publication contract ID
Service operation name
Status (Error or Timeout)
The target subscribing node
When the contract was created
A link to the IB Monitor detail page
Configuration
alerts:checks:ib_pub_contract_errors:enabled:truelookbackHours:24# How far back to look for errorsexcludeOperations:# Operation names to skip- HIGH_VOLUME_SYNC
Setting
Default
Description
lookbackHours
24
Number of hours back to search for error/timeout contracts
excludeOperations
[]
List of IB operation names to exclude from this check
How to Respond
Click the alert link to go to the IB Monitor entry for the failed contract
Review the error details. The IB Monitor shows the error message
Check whether the target subscribing node is reachable and its connector is configured correctly
This alert finds Integration Broker publication contracts that are stuck in New or Working status and have not progressed beyond that state within …
New to psLens? This page documents one specific alert. To see how it appears on the dashboard,
what operators investigate, and how teams tune it, start with a live walkthrough.
This alert finds Integration Broker publication contracts that are stuck in New or Working status and have not progressed beyond that state within the configured threshold.
A stalled publication contract means PeopleSoft has published a message to a subscriber, but the delivery has not completed. The message is either waiting to be picked up (New) or is in the process of being delivered but taking too long (Working).
alerts:checks:ib_pub_contract_stalled:enabled:truethresholdMinutes:30# Minutes before flagging as WarningexcludeOperations:# Operation names to skip- LARGE_BATCH_SYNC
Setting
Default
Description
thresholdMinutes
30
Minutes a contract must be stuck to trigger a Warning. Critical fires at 2× this value.
excludeOperations
[]
List of IB operation names to exclude. Use for operations that legitimately take a long time.
How to Respond
Click the alert link to go to the IB Monitor entry for the stalled contract
Check whether the IB dispatchers are running on the PeopleSoft application server
Look for a larger backlog (many contracts in New status may mean the dispatcher is down)
Check whether the target node’s endpoint is reachable
Review connector configuration for the target node
This alert finds Integration Broker subscription contracts that are in Error or Timeout status within a configurable lookback window.
New to psLens? This page documents one specific alert. To see how it appears on the dashboard,
what operators investigate, and how teams tune it, start with a live walkthrough.
This alert finds Integration Broker subscription contracts that are in Error or Timeout status within a configurable lookback window.
In the PeopleSoft Integration Broker architecture, a subscription contract tracks the processing of an inbound message by a subscribing handler. When a subscription contract fails, it means PeopleSoft received a message from an external system but was unable to process it completely.
When This Matters
Subscription contract errors typically mean:
An inbound message from an integration partner was not fully processed
PeopleSoft was unable to apply the data changes the message carried
A business process that depends on this message may be incomplete or in an error state
Severity Logic
Status
Severity
Error
Critical
Timeout
Warning
Alert Details
Each alert item includes:
Subscription contract ID
Service operation name
Status (Error or Timeout)
The originating (publishing) node
When the contract was created
A link to the IB Monitor detail page
Configuration
alerts:checks:ib_sub_contract_errors:enabled:truelookbackHours:24# How far back to look for errorsexcludeOperations:# Operation names to skip- KNOWN_RETRY_OPERATION
Setting
Default
Description
lookbackHours
24
Number of hours back to search for error/timeout contracts
excludeOperations
[]
List of IB operation names to exclude from this check
How to Respond
Click the alert link to go to the IB Monitor entry for the failed contract
Review the error details. The IB Monitor typically shows the exception or error message from the handler PeopleCode
Check the subscription handler code for the operation (viewable in the Service Operation detail page in psLens)
Investigate whether the data in the message is valid. Handler errors often come from unexpected data
If the subscription can be safely reprocessed, resubmit from PeopleSoft’s Subscription Contracts Monitor
This alert finds Integration Broker subscription contracts that are stuck in New or Working status and have not progressed beyond that state within…
New to psLens? This page documents one specific alert. To see how it appears on the dashboard,
what operators investigate, and how teams tune it, start with a live walkthrough.
This alert finds Integration Broker subscription contracts that are stuck in New or Working status and have not progressed beyond that state within the configured threshold.
A stalled subscription contract means PeopleSoft received an inbound message from an external system, but has not yet finished processing it. The message is either waiting to be handled (New) or is in the process of being handled but taking too long (Working).
When This Matters
For sub contracts, the most common cause specific to this alert is subscription handler PeopleCode that runs unusually long or waits on an external resource. For broader IB-side causes (dispatcher down, backlog), cross-reference IB Dispatcher Down and IB Operations Stalled.
Severity Logic
Condition
Severity
Stuck longer than thresholdMinutes
Warning
Stuck longer than thresholdMinutes × 2
Critical
Alert Details
Each alert item includes:
Subscription contract ID
Service operation name
Current status (New or Working)
How long it has been stuck (in minutes)
The originating (publishing) node
A link to the IB Monitor detail page
Configuration
alerts:checks:ib_sub_contract_stalled:enabled:truethresholdMinutes:30# Minutes before flagging as WarningexcludeOperations:# Operation names to skip- BULK_INBOUND_SYNC
Setting
Default
Description
thresholdMinutes
30
Minutes a contract must be stuck to trigger a Warning. Critical fires at 2× this value.
excludeOperations
[]
List of IB operation names to exclude. Use for known long-running handlers.
How to Respond
Click the alert link to go to the IB Monitor entry for the stalled contract
Check whether the IB dispatchers are running on the PeopleSoft application server
Look for a broader backlog. Many New contracts may mean no dispatcher is running
Check application server logs for errors in the subscription handler
For Working contracts, check whether the handler PeopleCode is looping or waiting on an external resource
This alert detects when the volume of IB async operation instances (PSAPMSGPUBHDR) is significantly higher than the rolling historical average.
New to psLens? This page documents one specific alert. To see how it appears on the dashboard,
what operators investigate, and how teams tune it, start with a live walkthrough.
This alert detects when the volume of IB async operation instances (PSAPMSGPUBHDR) is significantly higher than the rolling historical average.
A sudden volume spike may indicate a runaway integration sending messages in a loop, an upstream system retrying failed messages, or an unusually large but legitimate batch publish event.
How Baselining Works
psLens maintains a rolling history of up to 288 volume snapshots (approximately 24 hours at a 5-minute check interval). Each check cycle records the current message count for the lookback window.
Once at least 6 baseline snapshots have accumulated, the alert begins comparing the current count against the historical average. This prevents false alerts during the first few minutes after psLens starts.
Severity Logic
Condition
Severity
Volume exceeds average by >= thresholdPercent
Warning
Volume exceeds average by >= thresholdPercent x 2
Critical
Historical average is 0 and current count is > 0
Warning
For example, with the default threshold of 50%:
Current count is 75% above average → Warning
Current count is 100%+ above average → Critical
Configuration
alerts:checks:ib_operation_volume:enabled:truelookbackHours:1# Window for counting current messagesthresholdCount:50# Percentage increase to trigger Warning
Setting
Default
Description
lookbackHours
1
Hours to look back when counting current message volume
thresholdCount
50
Percentage increase over historical average to trigger a Warning alert. Critical fires at 2x this value.
Alert Details
Each alert item includes:
Current message count for the lookback window
Historical average count
Percentage increase above average
Number of baseline samples used
Link to the IB Monitor page
How to Respond
Navigate to the IB Monitor in psLens to see which operations are generating the volume
Check if any operations are in Error or Stalled status (see related IB alerts)
Review the specific operations with high message counts to determine if the volume is expected
If a runaway integration is identified, investigate the upstream system sending the messages
This alert detects when the volume of IB publication contracts (PSAPMSGPUBCON) is significantly higher than the rolling historical average.
New to psLens? This page documents one specific alert. To see how it appears on the dashboard,
what operators investigate, and how teams tune it, start with a live walkthrough.
This alert detects when the volume of IB publication contracts (PSAPMSGPUBCON) is significantly higher than the rolling historical average. Publication contracts represent messages being delivered to subscribing nodes, so a spike here can indicate unexpected fan-out, retries, or a high-volume event.
A sudden volume spike may indicate repeated retries of failed contracts inflating the count, an upstream system publishing in a loop, or a legitimate but unusually large batch publication event.
How Baselining Works
psLens maintains a rolling history of up to 288 volume snapshots (approximately 24 hours at a 5-minute check interval). Each check cycle records the current publication contract count for the lookback window.
Once at least 6 baseline snapshots have accumulated, the alert begins comparing the current count against the historical average.
Severity Logic
Condition
Severity
Volume exceeds average by >= thresholdPercent
Warning
Volume exceeds average by >= thresholdPercent x 2
Critical
Historical average is 0 and current count is > 0
Warning
For example, with the default threshold of 50%:
Current count is 75% above average → Warning
Current count is 100%+ above average → Critical
Configuration
alerts:checks:ib_pub_contract_volume:enabled:truelookbackHours:1# Window for counting current contractsthresholdCount:50# Percentage increase to trigger Warning
Setting
Default
Description
lookbackHours
1
Hours to look back when counting current contract volume
thresholdCount
50
Percentage increase over historical average to trigger a Warning alert. Critical fires at 2x this value.
Alert Details
Each alert item includes:
Current publication contract count for the lookback window
Historical average count
Percentage increase above average
Number of baseline samples used
Link to the IB Monitor page
How to Respond
Navigate to the IB Monitor in psLens to see which publication contracts are generating the volume
This alert fires when the SWS endpoint returns a connection error, timeout, 404, or 5xx.
New to psLens? This page documents one specific alert. To see how it appears on the dashboard,
what operators investigate, and how teams tune it, start with a live walkthrough.
This alert fires when the SWS endpoint returns a connection error, timeout, 404, or 5xx. psLens cannot fetch IB data without SWS, so this also blocks every other psLens IB check. A connection failure indicates that the Integration Broker gateway, local node, or application server is down.
Severity Logic
Condition
Severity
SWS connection attempt fails
Critical
What Gets Checked
The alert invokes the standard SWS connection test method. If it receives any network connection error (e.g., HTTP gateway timeout, connection refused, dns resolving failure, or HTTP 404/500 errors), a Critical alert is raised immediately.
Alert Details
Each alert item includes:
The base REST URL of the SWS endpoint (baseURL)
The raw network or connection error message
Troubleshooting links to verify connection settings
Configuration
alerts:checks:ib_down:enabled:true
Setting
Default
Description
enabled
true
Whether this check is active.
How to Respond
Verify that the PeopleSoft Web Server and PIA are up and running.
Check the Integration Gateway web application status (typically /PSIGW/PeopleSoftListeningConnector).
Ensure that the application server domain is booted and the Integration Broker handlers/dispatchers are active.
Verify there are no firewalls, proxies, or security policies blocking outbound HTTPS traffic from the psLens server to the Integration Broker gateway port.
Inspect the basic auth credentials in the config.yaml to ensure the API service user has not expired or been locked.
2.10 - Abnormal IB Subscription Contract Volume
This alert detects when the volume of IB subscription contracts (PSAPMSGSUBCON) is significantly higher than the rolling historical average.
New to psLens? This page documents one specific alert. To see how it appears on the dashboard,
what operators investigate, and how teams tune it, start with a live walkthrough.
This alert detects when the volume of IB subscription contracts (PSAPMSGSUBCON) is significantly higher than the rolling historical average. Subscription contracts represent inbound messages being processed by local subscribers, so a spike here can indicate a flood of inbound messages, excessive retries, or an integration firing more frequently than expected.
How Baselining Works
psLens maintains a rolling history of up to 288 volume snapshots (approximately 24 hours at a 5-minute check interval). Each check cycle records the current subscription contract count for the lookback window.
Once at least 6 baseline snapshots have accumulated, the alert begins comparing the current count against the historical average.
Severity Logic
Condition
Severity
Volume exceeds average by >= thresholdPercent
Warning
Volume exceeds average by >= thresholdPercent x 2
Critical
Historical average is 0 and current count is > 0
Warning
For example, with the default threshold of 50%:
Current count is 75% above average → Warning
Current count is 100%+ above average → Critical
Configuration
alerts:checks:ib_sub_contract_volume:enabled:truelookbackHours:1# Window for counting current contractsthresholdCount:50# Percentage increase to trigger Warning
Setting
Default
Description
lookbackHours
1
Hours to look back when counting current contract volume
thresholdCount
50
Percentage increase over historical average to trigger a Warning alert. Critical fires at 2x this value.
Alert Details
Each alert item includes:
Current subscription contract count for the lookback window
Historical average count
Percentage increase above average
Number of baseline samples used
Link to the IB Monitor page
How to Respond
Navigate to the IB Monitor in psLens to see which subscription contracts are generating the volume
This alert triggers when no active message domains are found in the Integration Broker.
New to psLens? This page documents one specific alert. To see how it appears on the dashboard,
what operators investigate, and how teams tune it, start with a live walkthrough.
This alert triggers when no active message domains are found in the Integration Broker. In PeopleSoft, message domains correspond to individual application servers running the Integration Broker background processes. If there are no active domains, Integration Broker cannot route, dispatch, or process any asynchronous publication or subscription messages.
Severity Logic
Condition
Severity
No message domains are in “Active” status
Critical
What Gets Checked
The alert queries the PSAPMSGDOMSTAT table to retrieve all registered domains. It counts the domains where the status is "A" (Active). If the count of active domains is zero, it triggers a Critical alert.
Alert Details
Each alert item includes:
The total count of registered domains
A list of inactive domains along with their machine names and app server paths
A link to the Integration Broker Monitor on the dashboard to inspect the domain statuses
Configuration
alerts:checks:ib_no_active_domain:enabled:true
Setting
Default
Description
enabled
true
Whether this check is active.
How to Respond
Log into the PeopleSoft server or use PSAdmin to check the status of the application server domains.
Verify if the Quick-Start or normal app server configuration has Integration Broker (Pub/Sub) processes enabled.
If the application server was recently restarted, check if the domains were configured to boot automatically or if they need to be booted manually.
Check system logs for application server boot crashes, memory errors, or database connection failures.
2.12 - IB Dispatcher Down
This alert monitors Integration Broker dispatcher processes (such as the publication dispatcher, subscription dispatcher, or handler dispatchers) o…
New to psLens? This page documents one specific alert. To see how it appears on the dashboard,
what operators investigate, and how teams tune it, start with a live walkthrough.
This alert monitors Integration Broker dispatcher processes (such as the publication dispatcher, subscription dispatcher, or handler dispatchers) on active domains and triggers when any dispatcher is inactive or has stopped reporting health updates.
When a dispatcher process is down, messages assigned to that dispatcher fail to process and queue up indefinitely, leading to a backlog.
Severity Logic
Condition
Severity
Dispatcher status is not active, or no health update within thresholdMinutes
Warning
Dispatcher has not updated health status for more than thresholdMinutes × 2
Critical
For example, with the default threshold of 10 minutes:
No health update for 11 minutes → Warning
No health update for 20+ minutes → Critical
What Gets Checked
The alert queries PSAPMSGDSPSTAT for dispatcher process statuses. For each dispatcher associated with an Active domain (from PSAPMSGDOMSTAT), it verifies:
The status string is "ACT" (Active).
The health timestamp (DspHealthDttm) has been updated within the threshold window.
Note: Dispatchers on inactive domains are ignored by this check (they are covered by the IB No Active Domain check).
Alert Details
Each alert item includes:
Dispatcher process name
Physical machine/host name
App server path
The last updated health timestamp
Reason for the down status (e.g. status not active, or elapsed minutes since last update)
Minutes a dispatcher can go without updating health before raising a Warning. Critical fires at 2× this threshold.
How to Respond
Go to the Integration Broker Monitor on the psLens dashboard to identify which specific dispatcher on which host is failing.
Log into the affected PeopleSoft application server and check the status of the dispatcher processes via PSAdmin.
Review the application server and Pub/Sub subdirectories log files (such as APPSRV.log, TUXLOG, or stderr / stdout logs) for crashes, Tuxedo errors, or database lockups.
Restart the Pub/Sub processes on the application server if the dispatcher has locked up or crashed.
2.13 - IB Sync Operation Exceptions
This alert detects synchronous IB service operations that have logged errors in the sync transaction log (PSIBLOGHDR) within the configured lookbac…
New to psLens? This page documents one specific alert. To see how it appears on the dashboard,
what operators investigate, and how teams tune it, start with a live walkthrough.
This alert detects synchronous IB service operations that have logged errors in the sync transaction log (PSIBLOGHDR) within the configured lookback window. Results are aggregated by operation name to avoid noise from high-volume sync operations that may have individual errors but function normally overall.
Unlike async IB errors (which create persistent queue entries), sync operation errors are logged transiently in PSIBLOGHDR. Without active monitoring, these errors are often missed until a consuming system reports a problem.
Severity Logic
All findings are reported at Warning severity. Since synchronous request-response transactions are executed in real time, any error must be handled and logged by the calling HTTP client. Administrators generally cannot resolve these errors from within PeopleSoft, as the client must reinitiate the transaction.
What Gets Checked
The alert queries PSIBLOGHDR for records with error status within the lookback window, aggregated by IB operation name. Only operations with at least one error are reported. Operations in the exclude list are skipped.
Alert Details
Each alert item includes:
Service operation name (with link to Service Operation detail page)
Number of errors in the lookback window
Lookback window in hours
Configuration
alerts:checks:ib_sync_exceptions:enabled:falselookbackHours:24# How far back to check for sync errorsexcludeOperations:[]# Operation names to ignore
Setting
Default
Description
enabled
false
Enable or disable the sync exception checker
lookbackHours
24
Hours to look back for sync operation errors
excludeOperations
[]
List of operation names to exclude from this check
How to Respond
Click the alert link to open the Service Operation detail page
Review the operation’s handler configuration and routing
Check PSIBLOGHDR directly for the specific error messages (psLens links to the operation, not individual log entries)
Verify that the operation’s service handler is still functional and the underlying code has not changed
Contact the calling system to understand whether they are seeing failures on their end
The PSIBLOGHDR table must be whitelisted in the PeopleSoft SWS framework on each target environment. Sync logging must be enabled on the relevant routings. If logging is disabled, errors will not appear in PSIBLOGHDR. See the Sync Operations Without Logging report to find operations where logging may be disabled.
Tables Queried
Table
Description
PSIBLOGHDR
IB sync transaction log headers
2.14 - IB Nodes Down
This alert triggers when there are entries in the PeopleSoft table PSNODESDOWN.
New to psLens? This page documents one specific alert. To see how it appears on the dashboard,
what operators investigate, and how teams tune it, start with a live walkthrough.
This alert triggers when there are entries in the PeopleSoft table PSNODESDOWN. An entry in this table indicates that a message node is blocked or offline.
When the Integration Broker attempts to publish a message to an external or remote node and the connection fails, the system registers the node as “down” in PSNODESDOWN. While the node is down, all subsequent publication contracts to that node are automatically paused/blocked and remain queued in the database until the node status is resolved.
Severity Logic
Condition
Severity
Message node entry exists in PSNODESDOWN
Critical
What Gets Checked
The alert queries PSNODESDOWN for any active rows. For each row found, it groups the results by message node and counts the number of blocked transactions.
Alert Details
Each alert item includes:
The name of the offline message node
The count of blocked transactions queueing for the node
A link to the Node detail page in the browser showing connection diagnostics
Configuration
alerts:checks:ib_nodes_down:enabled:true
Setting
Default
Description
enabled
true
Whether this check is active.
How to Respond
Click the node link in the alert to inspect the node configuration and test connectivity.
Check if the external target service (e.g. an external API gateway, third-party system, or another PeopleSoft application node) is offline or undergoing maintenance.
Verify network routing and gateway connector configurations.
Once the external endpoint is confirmed to be healthy, delete the down-node status entry in PeopleSoft (typically via the Service Operations Monitor > Administration > Nodes Down page) and resubmit or force retry the stalled publication contracts.
3 - Security
Security alerts: failed login detection and authentication monitoring.
Security alerts monitor your PeopleSoft environment for authentication issues and suspicious login activity.
Users with excessive failed login attempts in PSPTLOGINAUDIT
3.1 - Failed Logins
This alert finds PeopleSoft users with excessive failed login attempts by querying the PSPTLOGINAUDIT table.
New to psLens? This page documents one specific alert. To see how it appears on the dashboard,
what operators investigate, and how teams tune it, start with a live walkthrough.
This alert finds PeopleSoft users with excessive failed login attempts by querying the PSPTLOGINAUDIT table. It only reports users whose most recent login attempt was a failure (PT_SIGNON_STATUS = 1).
PSPTLOGINAUDIT stores only the last login state per user. Once a user successfully logs in, their failure count resets. This means the alert reflects the current state: users who are actively failing to log in right now.
A high number of failed logins may indicate:
A brute-force attack against a user account
A user who has forgotten their password
An integration or batch account with stale credentials
An account lockout situation that needs admin attention
Severity Logic
Condition
Severity
Failed logins >= thresholdCount
Warning
Failed logins >= thresholdCount x 2
Critical
For example, with the default threshold of 5:
A user with 6 failed logins -> Warning
A user with 10 or more failed logins -> Critical
What Gets Checked
The alert queries PSPTLOGINAUDIT for rows where:
PT_SIGNON_STATUS = '1' (last attempt was a failure)
FAILEDLOGINS >= threshold (failed count meets or exceeds the configured threshold)
Results are ordered by FAILEDLOGINS descending (highest failure counts first).
Alert Details
Each alert item includes:
Signon ID (PTSIGNONID) — the username entered at the login screen
OPRID — the resolved PeopleSoft user ID
Number of failed login attempts
Authentication type (Token/SSO, Signon PeopleCode, or Standard)
Timestamp of the last failed login attempt
A link to the User detail page (when the OPRID is resolved)
Configuration
alerts:checks:failed_logins:enabled:truethresholdCount:5# Failed attempts before flagging as Warning
Setting
Default
Description
thresholdCount
5
Number of failed logins to trigger a Warning alert. Critical fires at 2x this value.
How to Respond
Click the alert link to go to the User detail page for the affected account
Check the authentication type. Token/SSO failures may indicate a misconfigured integration
Review the timestamp. Recent failures are more concerning than old ones
Check if the user’s account is locked (ACCTLOCK in PSOPRDEFN)
If the failures look like a brute-force attempt, consider locking the account and investigating the source
For legitimate users, help them reset their password and unlock their account
The PSPTLOGINAUDIT table must be whitelisted in the PeopleSoft SWS framework on each target environment. If the table is not whitelisted, this alert will log an error on each check cycle but will not affect other alerts.
4 - Web Server / WebLib Down
psLens POSTs to one or more configured WebLib or IScript URLs every check cycle.
New to psLens? This page documents one specific alert. To see how it appears on the dashboard,
what operators investigate, and how teams tune it, start with a live walkthrough.
Alert ID:weblib_downCategory: Web Server / WebLib
Default threshold: Immediate
What This Alert Detects
psLens POSTs to one or more configured WebLib or IScript URLs every check cycle. If any target connection fails or returns a 5xx, the alert fires Critical.
By default, the checker tests the standard delivered WebLib endpoint:
WEBLIB_PTBR.ISCRIPT1.FieldFormula.IScript_StartPage
If the Web Server is down, or if the whitelisted API service account loses security access to the tested WebLib, the alert triggers immediately.
Severity Logic
Condition
Severity
Target URL is unreachable or connection times out
Critical
Target WebLib returns an HTTP status code >= 500 (Internal Server Error)
Critical
Note: HTTP statuses like 200 (Success), 401 (Unauthorized), 403 (Forbidden), or 302 (Redirect) indicate the Web Server is active and processing requests; they do not trigger a down alert.
What Gets Checked
For each target URL configured in weblibTestTargets:
It sends an HTTP POST request with a 10-second timeout.
It applies HTTP Basic Authentication using either target-specific credentials or default database connection credentials.
It registers a failure if the request fails to connect or returns a status code in the 5xx range.
List of target configurations. Each target requires a url and optional username / password overrides.
How to Respond
Verify whether the PeopleSoft Web Server (WebLogic or WebSphere) process is booted and running.
Check if there are network outages, load balancer failures, or firewall changes between the psLens server and the PIA URL.
If the server is reachable but returning a weblib_down alert, verify that the configured PeopleSoft service account has security clearance (assigned Permission Lists) to access the target WebLib.
5 - Generic SWS Alerts
Generic SWS Alerts let you define alert checks in YAML using PsoftQL queries against whitelisted PeopleSoft records.
Generic SWS Alerts
Generic SWS Alerts let you define alert checks in YAML using PsoftQL queries against whitelisted PeopleSoft records. Use these when you need a one-off check that the built-in alert types don’t cover.
The scheduler runs each query on the database’s checking interval and triggers alerts based on the resulting row counts.
Configuration Properties
Generic alerts are configured under the genericSWSAlerts list, either globally under alerts or overridden per-database under databases[].alerts.
Property
Type
Required
Default
Description
id
String
Yes
-
Unique alphanumeric identifier. The system registers the alert internally as generic_sws_<id>.
name
String
Yes
-
Friendly name shown on the dashboard and in reports (e.g. Stale Admins).
enabled
Boolean
No
true
Toggle execution of this generic alert.
severity
String
No
warning
Severity of the alert when triggered: info, warning, or critical.
alertOn
String
No
row_found
Condition to trigger the alert: row_found (trigger if row count > 0) or no_result_found (trigger if row count == 0).
message
String
Yes
-
Summary message shown on the dashboard and sent in notifications when the alert triggers.
For security, the SWS client restricts query capabilities to a defined list of records. Every record/table referenced in a generic alert query must be whitelisted in the SWS whitelisting table (C_SWS_REC_WL) on the target PeopleSoft database.
If a query references a record that is not whitelisted, the alert run will fail with a whitelisting validation error.
PsoftQL Query Structure
The query property follows the exact structure of a psLens PsoftQLRequest query:
Property
Type
Description
records
Array
List of record configurations to query (can be nested for joins).
rowLimit
Integer
Max rows to return (recommended to keep low, e.g. 5 or 10).
orderBy
String
SQL ORDER BY clause for sorting findings.
noEffectiveDateLogic
Boolean
Set true to skip automatic EFFDT filtering logic.
noEffectiveStatusLogic
Boolean
Set true to skip automatic EFF_STATUS = 'A' filtering logic.
Record Configuration (records[])
recordName (String, Required): PeopleSoft record name (e.g., PSOPRDEFN).
excludeFields (List, Optional): Field names to exclude from results.
Practical Examples
Example 1: Critical Administrative Account Access (Row Found)
This alert triggers a Critical warning if an administrator account has been modified recently, or if a locked/inactive operator is seen initiating processes.
alerts:genericSWSAlerts:- id:"locked_oprid_activity"name:"Locked Admin Activity"enabled:trueseverity:"critical"alertOn:"row_found"message:"Security warning: Activity detected from locked operator accounts!"query:records:- recordName:"PSPRCSRQST"sqlWhereClause:"RUNDTTM > CAST(SYSDATE - 1 AS DATE) AND OPRID IN (SELECT OPRID FROM PSOPRDEFN WHERE ACCTLOCK = 1)"rowLimit:5
Example 2: Process Scheduler Daemon Down (No Result Found)
This alert triggers a Critical warning if no process scheduler daemon has updated its status in the last 15 minutes, indicating that the scheduler might be down.
alerts:genericSWSAlerts:- id:"scheduler_daemon_down"name:"Process Scheduler Daemon Status"enabled:trueseverity:"critical"alertOn:"no_result_found"message:"Alert: No active process scheduler daemons detected in the last 15 minutes!"query:records:- recordName:"PSSERVERDEFN"sqlWhereClause:"LASTUPDDTTM > CAST(SYSDATE - 1/96 AS DATE)"# 15 minutes lookbackrowLimit:1
Notification Routing
To route notifications for a generic SWS alert, use its registered ID (generic_sws_<id>) in the alertTypes property of your notification subscription: