Process Scheduler alerts: long-running processes, process errors, backlogged processes, queue latency, locked operators, and critical process monitoring.
Schedulers that have not updated their heartbeat status in PSSERVERSTAT recently
1 - Long-Running Processes
This alert finds Process Scheduler requests that are currently in Initiated or Processing status and have been running longer than their expected d…
New to psLens? This page documents one specific alert. To see how it appears on the dashboard,
what operators investigate, and how teams tune it, start with a live walkthrough.
Alert ID:long_running_processesCategory: Process Scheduler
Default threshold: Dynamic (4x rolling median, min 10 min baseline) or static fallback (20 minutes)
What This Alert Detects
This alert finds Process Scheduler requests that are currently in Initiated or Processing status and have been running longer than their expected duration.
Instead of relying solely on a static global threshold, psLens dynamically calculates an expected duration for each process using its own history:
It fetches the last 10 successful run durations for the specific process name (PRCSNAME).
It calculates the rolling median runtime of those successful runs.
It raises an alert if the current execution duration exceeds a multiple of the median (default: $4\times$ the median, with a minimum baseline of 10 minutes).
If no successful runs are found (e.g. a brand new process or a process that has never completed successfully), it falls back to the static global thresholdMinutes (default: 20 minutes).
A process that has been running for a long time may be stuck, consuming excessive server resources, or waiting on a lock or resource that will never become available.
Severity Logic
Condition
Severity
Running longer than dynamic threshold (or static fallback)
Warning
For example:
If a process usually runs in 3 minutes: median is 3m. $4\times 3 = 12$ minutes. The alert triggers if it runs for 12 minutes or more.
If a process usually runs in 1 minute: median is 1m. $4\times 1 = 4$ minutes. Since this is below the 10-minute minimum baseline, the baseline is used: the alert triggers if it runs for 10 minutes or more.
If a process has no history: fallback is used. The alert triggers if it runs for 20 minutes or more.
What Gets Checked
The alert queries the Process Scheduler request table for processes in run status 6 (Initiated) or 7 (Processing). For each result, it calculates how long the process has been running based on its BeginDttm (begin datetime) and the current server time.
Processes with no BeginDttm value are skipped (the process hasn’t truly started yet).
Alert Details
Each alert item includes:
Process name (PRCSNAME)
Process instance number
How long the process has been running (in minutes)
The rolling median runtime (if available, in minutes)
The operator who submitted the request
A link to the Process Monitor detail page for that instance
Configuration
alerts:checks:long_running_processes:enabled:truethresholdMinutes:20# Fallback static minutes when history is emptyanomalyMultiplier:4.0# Multiplier applied to rolling mediananomalyMinBaselineMinutes:10# Minimum baseline runtime before alertingexcludeProcesses:# Process names to skip- SOME_LONG_BATCH_JOB
Setting
Default
Description
thresholdMinutes
20
Fallback static minutes a process must be running to trigger an alert if no successful run history exists.
anomalyMultiplier
4.0
Multiplier applied to the rolling median duration to calculate the dynamic threshold.
anomalyMinBaselineMinutes
10
The minimum baseline duration in minutes. Dynamic thresholds are capped to be at least this value to prevent false alerts on very fast processes.
excludeProcesses
[]
List of process names to exclude from this check. Use for known long-running processes that are expected to take a long time.
How to Respond
Click the alert link to go directly to the Process Monitor entry for the flagged process
Review the process details: what it is, who submitted it, when it started
Check whether the process appears to be making progress or is stuck
If the process is genuinely stuck, you may need to cancel it from PeopleSoft’s Process Monitor
Investigate why it got stuck: look for locks, resource contention, or data issues
Tuning the Threshold
The right threshold depends on your environment. You can adjust anomalyMultiplier or anomalyMinBaselineMinutes globally or per-database to reduce noise, or use excludeProcesses to ignore specific jobs entirely.
2 - Process Errors
This alert finds Process Scheduler requests that have failed within a configurable lookback window.
New to psLens? This page documents one specific alert. To see how it appears on the dashboard,
what operators investigate, and how teams tune it, start with a live walkthrough.
Alert ID:process_errorsCategory: Process Scheduler
Default lookback: 24 hours
What This Alert Detects
This alert finds Process Scheduler requests that have failed within a configurable lookback window. It catches processes that ended in one of three error statuses:
Run Status
PeopleSoft Code
Meaning
Error
3
The process ended with an error condition
Not Successful
10
The process ran but reported a non-success result
Unable to Post
12
The process output could not be delivered
Severity Logic
Process Type
Status
Severity
Recurring (on a recurrence schedule)
Error (3), Not Successful (10), Unable to Post (12)
Critical
Non-Recurring (ad-hoc execution)
Error (3), Not Successful (10), Unable to Post (12)
Warning
Recurring Processes: Any failure fires Critical immediately.
Non-Recurring Processes: Fire Warning after the thresholdMinutes grace period.
Alert Details
Each alert item includes:
Process name and instance number
Run status label (Error, Not Successful, Unable to Post)
The operator who submitted the request
When the process ran
A link to the Process Monitor detail page for that instance
Configuration
alerts:checks:process_errors:enabled:truelookbackHours:24# How far back to look for failuresthresholdMinutes:15# Grace period buffer in minutes for non-recurring errorsexcludeProcesses:# Process names to skip- KNOWN_FLAKY_PROCESS
Setting
Default
Description
lookbackHours
24
Number of hours back to search for failed processes
thresholdMinutes
0
Grace period buffer (in minutes) for non-recurring process errors before they raise a Warning alert.
excludeProcesses
[]
List of process names to exclude from this check
How to Respond
Click the alert link to go directly to the Process Monitor entry for the failed process
Review the process details: run status, begin and end times, server
Look for output files or log information that might explain the failure
Check whether this is a one-time failure or a repeating issue
If the process needs to be rerun, submit a new request from PeopleSoft
Common Causes of Process Failures
Data errors: The process encountered unexpected data (null values, bad formats, constraint violations)
Resource issues: The server ran out of memory or disk space
Timeout: The process exceeded its allowed run time
Configuration problems: A required configuration parameter is missing or incorrect
Dependency failures: A process that runs after another failed because the first one didn’t complete correctly
Reducing Alert Noise
If certain processes fail regularly and you’re already tracking them separately, add them to excludeProcesses to keep the alert list focused on unexpected failures.
3 - Backlogged Processes
This alert finds Process Scheduler requests that are in Queued or Blocked status and whose scheduled run time (RUNDTTM) has already passed by more …
New to psLens? This page documents one specific alert. To see how it appears on the dashboard,
what operators investigate, and how teams tune it, start with a live walkthrough.
Alert ID:backlogged_processesCategory: Process Scheduler
Default threshold: 30 minutes
What This Alert Detects
This alert finds Process Scheduler requests that are in Queued or Blocked status and whose scheduled run time (RUNDTTM) has already passed by more than the configured threshold. This alert focuses exclusively on processes currently waiting to start. Once a process begins running, it is cleared from this alert and is instead tracked by the Queue Latency alert.
Severity Logic
Condition
Severity
Overdue by more than thresholdMinutes
Warning
Overdue by more than thresholdMinutes × 2
Critical
For example, with the default threshold of 30 minutes:
A process scheduled 40 minutes ago that is still queued → Warning
A process scheduled 65 minutes ago that is still queued → Critical
What Gets Checked
The alert queries the Process Scheduler request table for processes in run status 5 (Queued) or 18 (Blocked) whose RUNDTTM (scheduled run datetime) is in the past. For each result, it calculates how far past the scheduled time the process is based on RUNDTTM and the current server time.
Processes with no RUNDTTM value are skipped. Completed or active runs are skipped.
Alert Details
Each alert item includes:
Process name (PRCSNAME)
Process instance number
How long the process is overdue (in minutes)
Current run status (Queued or Blocked)
The operator who submitted the request
A link to the Process Monitor detail page for that instance
Configuration
alerts:checks:backlogged_processes:enabled:truethresholdMinutes:30# Minutes overdue before flagging as WarningexcludeProcesses:# Process names to skip- SOME_LOW_PRIORITY_JOB
Setting
Default
Description
thresholdMinutes
30
Minutes past the scheduled run time before a queued/blocked process triggers a Warning alert. Critical fires at 2× this value.
excludeProcesses
[]
List of process names to exclude from this check. Use for processes that are known to queue for a long time and are not a concern.
How to Respond
Click the alert link to go directly to the Process Monitor entry for the flagged process
Check whether the Process Scheduler server is running and accepting work
Look at how many processes are currently running on the server. It may have hit its concurrency limit
Check if the process type or class has reached its maximum allowed concurrent instances
For blocked processes, investigate what is blocking them (dependencies, server restrictions, etc.)
If the Process Scheduler server is down, restart it from PeopleSoft’s Process Scheduler administration
Tuning the Threshold
The right threshold depends on how busy your Process Scheduler is. In environments where many jobs are submitted at once, some queuing is normal. Set thresholdMinutes high enough to avoid false positives during peak batch windows but low enough to catch genuine problems. You can also use excludeProcesses to exclude specific low-priority processes that are known to queue for long periods.
4 - Locked OPRID Scheduled Processes
This alert finds queued or scheduled Process Scheduler requests where the submitting operator’s account (OPRID) is currently locked in PSOPRDEFN (A…
New to psLens? This page documents one specific alert. To see how it appears on the dashboard,
what operators investigate, and how teams tune it, start with a live walkthrough.
Alert ID:locked_oprid_processesCategory: Process Scheduler
What This Alert Detects
This alert finds queued or scheduled Process Scheduler requests where the submitting operator’s account (OPRID) is currently locked in PSOPRDEFN (ACCTLOCK = 1).
When an operator account is locked after a process has been queued, PeopleSoft will refuse to run the process, or run it under the locked account and immediately fail. PeopleSoft does not surface this condition anywhere obvious: Process Monitor shows the job queued, the operator’s user page shows them locked, but nothing connects the two. This alert does.
Common scenarios:
A service or batch account had its password expire and was locked
An employee left and their account was locked, but scheduled jobs were not transferred
A security lockout from failed login attempts affected a batch account
Severity Logic
All findings are reported at Warning severity. Every queued or scheduled process with a locked submitting account is flagged.
What Gets Checked
The alert queries PSPRCSRQST joined to PSOPRDEFN for process requests in Queued or Scheduled run status where the submitting OPRID has ACCTLOCK = 1.
Alert Details
Each alert item includes:
Process name and instance number
Submitting OPRID (with link to User detail page)
Current run status (Queued, Scheduled, etc.)
Scheduled run date/time
Recurrence name (if applicable)
Configuration
alerts:checks:locked_oprid_processes:enabled:trueexcludeProcesses:[]# Process names to ignore
Setting
Default
Description
excludeProcesses
[]
List of process names to exclude from this check
How to Respond
Click the alert link to open the Process Monitor detail page for the affected instance
Identify the locked OPRID shown in the alert
Navigate to the User detail page to review the account lock status
Either unlock the account (if appropriate) or re-queue the process under an active operator account
For recurring processes, update the recurrence definition to use a non-locked operator
Investigate why the account was locked. If it was a failed login lockout, check the Failed Logins alert for additional context
Tables Queried
Table
Description
PSPRCSRQST
Process Scheduler request queue
PSOPRDEFN
Operator definitions (user accounts)
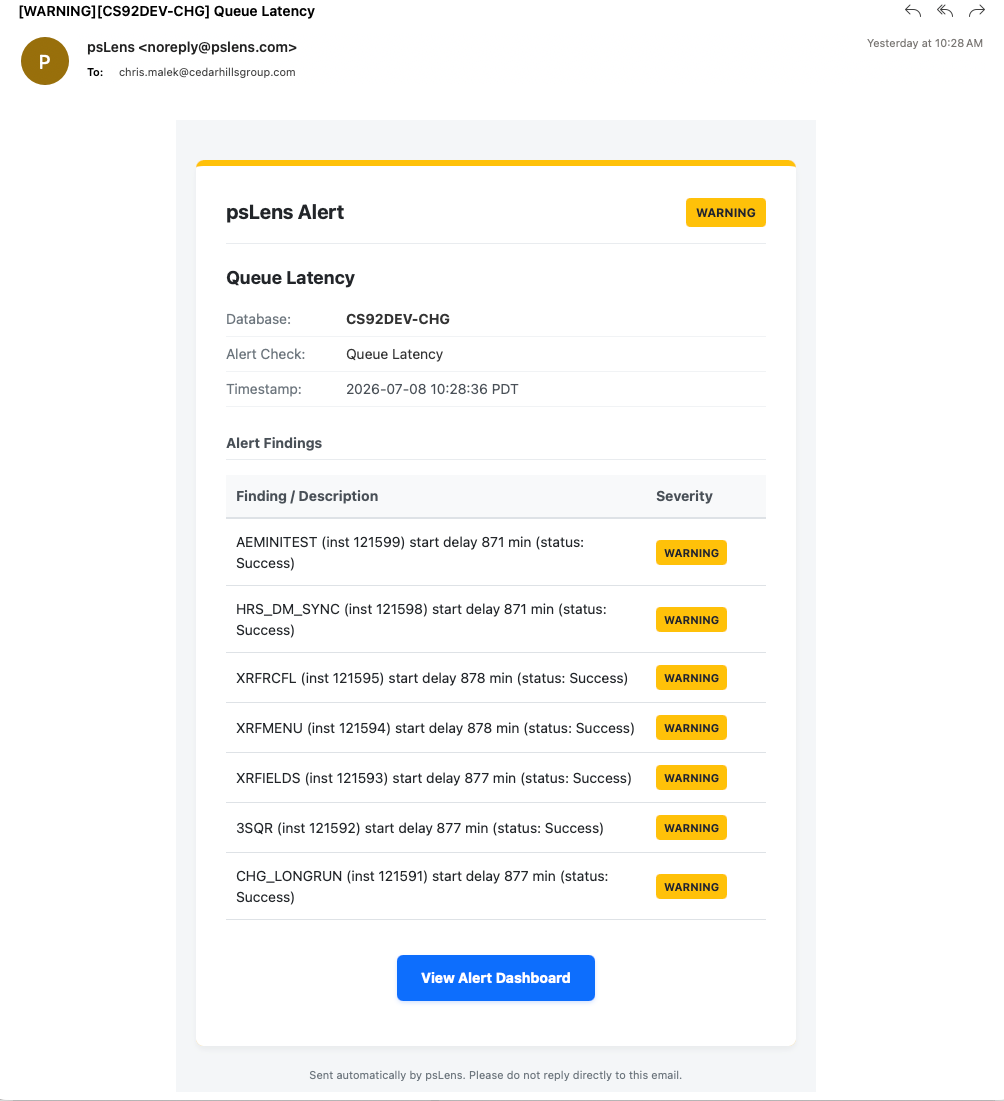
5 - Queue Latency
This page documents the queue latency alert, which monitors the delay between a process’s scheduled run time and its actual start time.
New to psLens? This page documents one specific alert. To see how it appears on the dashboard,
what operators investigate, and how teams tune it, start with a live walkthrough.
Alert ID:queue_latencyCategory: Process Scheduler
Default threshold: 15 minutes
Queue Latency Alert in psLens showing processes with start delays exceeding the threshold
What This Alert Detects
This page documents the queue latency alert, which monitors the delay between a process’s scheduled run time and its actual start time. It queries the PSPRCSRQST table for processes that have started running or completed within the lookback window and calculates the delay as BEGINDTTM - RUNDTTM.
Severity Logic
Condition
Severity
Start delay more than thresholdMinutes
Warning
For example, with the default threshold of 15 minutes:
A process scheduled for 10:00 that started running at 10:20 → Warning
What Gets Checked
The alert queries the Process Scheduler request table (PSPRCSRQST) for processes whose BEGINDTTM (begin datetime) is in the past lookback window (default 24 hours). For each process, it calculates the difference between BEGINDTTM and RUNDTTM (scheduled run datetime).
Processes that have not started running yet (empty BEGINDTTM value) are skipped. Active queuing checks are handled by the backlogged_processes alert.
Alert Details
Each alert item includes:
Process name (PRCSNAME)
Process instance number
Start delay duration (in minutes)
Current run status (Initiated, Processing, Success, Error, etc.)
The operator who submitted the request
A link to the Process Monitor detail page for that instance
Configuration
alerts:checks:queue_latency:enabled:truethresholdMinutes:15# Minutes delay before flagging as WarninglookbackHours:24# Hours to look back for completed/running processesexcludeProcesses:# Process names to skip- LOW_PRIORITY_AE
Setting
Default
Description
thresholdMinutes
15
Minutes of start delay before a process triggers a Warning alert.
lookbackHours
24
Hours to look back for processes to verify.
excludeProcesses
[]
List of process names to exclude from this check. Use for processes that are known to delay and are not a concern.
How to Respond
Click the alert link to go to the Process Monitor entry for the flagged process.
Review the process server definition to identify if it is running and accepting work.
Check the max concurrent limits configured on the Process Scheduler server or category definitions.
Verify if other higher-priority processes occupied all available channels.
If the delay is caused by category stalls, adjust the process class concurrency settings.
Tuning the Threshold
Environments with heavy batch schedules may experience normal queue delays during peak hours. Set thresholdMinutes high enough to prevent alerts on minor delays but low enough to flag scheduler capacity bottlenecks or server category stalls.
6 - Process Run Check
This alert monitors configured critical processes and fires when one has not completed successfully within its expected time window.
New to psLens? This page documents one specific alert. To see how it appears on the dashboard,
what operators investigate, and how teams tune it, start with a live walkthrough.
Alert ID:process_run_checkCategory: Process Scheduler
What This Alert Detects
This alert monitors configured critical processes and fires when one has not completed successfully within its expected time window. It is the alert equivalent of the Process Run Check report. The difference is that this runs automatically on every check cycle and surfaces failures on the dashboard without any manual action.
Use this alert for processes that must run on a regular cadence, such as:
Nightly batch jobs that must complete before business hours
Data synchronization processes that run every few hours
Critical integrations that should run multiple times per day
Post-maintenance verification of essential processes
Severity Logic
Condition
Severity
Process has run recently but not successfully in the configured window
Warning
Process has no run history at all
Critical
Configuration
Process checks are configured per process name in config.yaml. Each entry specifies the process name and the number of hours within which a successful run is expected.
alerts:checks:process_run_check:enabled:trueprocessChecks:SOMEJOBNAME:24# Must run successfully within 24 hoursANOTHERJOB:8# Must run successfully within 8 hoursNIGHTLY_ETL:12# Must run successfully within 12 hours
Setting
Default
Description
processChecks
{}
Map of process name to expected run window in hours
If a process name is listed with 0 or a negative value, the check defaults to a 24-hour window.
What Gets Checked
For each configured process, psLens queries PSPRCSRQST for successful runs (RunStatus = 9 / Success) within the configured time window. If none are found, it then checks for any run history to determine severity:
No successful run in window + recent run history found: Warning
No run history at all: Critical
Alert Details
Each alert item includes:
Process name
Configured threshold (hours)
Last known run status (if any history exists)
Last known run time (if any history exists)
Link to the Process Definition detail page
How to Respond
Click the alert link to open the Process Definition detail page for the affected process
Review recent run history to understand what happened. Did the process run but fail, or did it not run at all?
Check the Process Scheduler server configuration if the process never ran
Investigate error logs if the process ran but ended in a failed state
If the process ran and succeeded but outside the expected window, consider adjusting the threshold in config.yaml
Tables Queried
Table
Description
PSPRCSRQST
Process Scheduler request queue and run history
7 - Process Scheduler Down
This alert triggers when any active Process Scheduler server registered in PSSERVERSTAT has not reported a status update (heartbeat) within the con…
New to psLens? This page documents one specific alert. To see how it appears on the dashboard,
what operators investigate, and how teams tune it, start with a live walkthrough.
Alert ID:process_scheduler_downCategory: Process Scheduler
Default threshold: 10 minutes
What This Alert Detects
This alert triggers when any active Process Scheduler server registered in PSSERVERSTAT has not reported a status update (heartbeat) within the configured amount of time.
Note
The alert automatically ignores servers whose status is explicitly set to "1" (Down) or "7" (Suspended - Offline), as these represent intentionally stopped or offline schedulers. It will only flag active server configurations (e.g., Running, Suspended, Error, Overloaded) that have stalled or stopped updating.
Severity Logic
Condition
Severity
Heartbeat stale by more than thresholdMinutes
Warning
Heartbeat stale by more than thresholdMinutes × 2
Critical
For example, with the default threshold of 10 minutes:
A scheduler that hasn’t heartbeat’ed for 12 minutes → Warning
A scheduler that hasn’t heartbeat’ed for 22 minutes → Critical
What Gets Checked
The alert queries the PSSERVERSTAT table to retrieve all server status definitions. For each active scheduler (status not Down/Offline), it calculates the elapsed time since its LASTUPDDTTM timestamp. If that time exceeds the configured threshold, the alert fires.
Alert Details
Each alert item includes:
Server name (SERVERNAME)
Current status code and friendly string status (e.g., Running, Error, Suspended)
Last heartbeat timestamp (LASTUPDDTTM)
Host name (SRVRHOSTNAME)
A detailed explanation of how long the heartbeat has been stale
A link to the Server Definition detail page for that server
Configuration
alerts:checks:process_scheduler_down:enabled:truethresholdMinutes:10# Minutes stale before flagging as WarningexcludeProcesses:# Server names (e.g., PSUNX, PSNT) to skip- PSUNX_OLD
Setting
Default
Description
thresholdMinutes
10
Minutes of stale heartbeat status updates before a scheduler triggers a Warning alert. Critical fires at 2× this value.
excludeProcesses
[]
List of server names to exclude from this check. Use for retired scheduler definitions that linger in PSSERVERSTAT but aren’t cleaned up.
How to Respond
Click the alert link to go directly to the Server Definition detail page for the affected scheduler.
Check the Host Name where the Process Scheduler daemon runs.
Access the server host and verify whether the Process Scheduler processes (e.g., psadmin, PSAESRV, etc.) are running.
Review the Process Scheduler logs (e.g., TUXLOG, SCHED_*.LOG) on the host machine to diagnose why the process has hung or crashed.
If the scheduler has hung, stop the process scheduler daemon and restart it using psadmin.
If the server definition is obsolete or decommissioned, consider deleting it in PeopleSoft Server Definitions configuration to clean up the PSSERVERSTAT row.
8 - No Process Completed
This alert fires when no process has successfully completed within the configured lookback window. It is a broad scheduler health check.
New to psLens? This page documents one specific alert. To see how it appears on the dashboard,
what operators investigate, and how teams tune it, start with a live walkthrough.
Alert ID:no_process_completedCategory: Process Scheduler
Default lookback: 1 hour
What This Alert Detects
This alert fires when no process has successfully completed within the configured lookback window. It is a broad scheduler health check. If nothing has finished successfully in the past hour, the Process Scheduler may be down, stalled, or not dispatching jobs.
This is distinct from the Process Run Check, which monitors specific named processes. This alert monitors overall scheduler activity.
Severity Logic
Condition
Severity
Zero successful completions in the lookback window
Warning
What Gets Checked
The alert queries PSPRCSRQST for any process with RunStatus = 9 (Success) and an end datetime within the lookback window. If no rows are returned, the alert fires.
Only one result is needed to resolve the alert. The check uses a limit of 1 for efficiency.
Alert Details
When firing, the alert produces a single item:
Summary: No process completed successfully in the last N hour(s)
Lookback hours used for the check
Configuration
alerts:checks:no_process_completed:enabled:truelookbackHours:1# How far back to look for completed processes
Setting
Default
Description
lookbackHours
1
How many hours back to look for a successfully completed process.
How to Respond
Check PeopleSoft’s Process Monitor to see if any processes are running, queued, or have recently completed
Verify the Process Scheduler server is running (PeopleSoft > PeopleTools > Process Scheduler > Servers)
If processes are queued but not running, the scheduler daemon may need to be restarted
If this fires regularly during off-hours when no jobs run, increase lookbackHours or disable the alert for those periods
Tuning
If your environment has periods where no batch jobs are expected to run (e.g., overnight maintenance windows), consider increasing lookbackHours to cover those gaps, or disable the alert entirely during those windows.
9 - Stalled Recurrences
This alert fires when a scheduled recurring process has finished a run recently (within the lookback window) but does not have a subsequent schedul…
New to psLens? This page documents one specific alert. To see how it appears on the dashboard,
what operators investigate, and how teams tune it, start with a live walkthrough.
Alert ID:stalled_recurrencesCategory: Process Scheduler
Default lookback: 336 hours (14 days)
What This Alert Detects
This alert fires when a scheduled recurring process has finished a run recently (within the lookback window) but does not have a subsequent scheduled instance.
In PeopleSoft, the Process Scheduler is responsible for scheduling the next run of a process based on its recurrence definition when the current one runs. If the scheduler is interrupted, a database is refreshed, or an error occurs during the scheduling process, the recurring job can fall off the schedule. This check identifies those occurrences so they do not go unnoticed.
Severity Logic
Condition
Severity
The latest completed run failed (status was Error, Not Successful, or Unable to Post) and no next run is scheduled
Critical
The latest completed run succeeded or was cancelled and no next run is scheduled
Warning
What Gets Checked
The alert queries PSPRCSRQST for all process requests that have a recurrence name assigned. It then groups these requests by:
Process Name (PRCSNAME)
Run Control ID (RUNCNTLID)
User ID (OPRID)
Recurrence Name (RECURNAME)
For each unique combination, if the latest instance has a completed status and there are no active/pending requests (such as Queued, Blocked, Hold, Pending, Initiated, or Processing) to follow, the recurrence is flagged as stalled.
Alert Details
When firing, the alert produces an item for each stalled recurrence:
Summary: Recurrence RECURNAME for PRCSNAME — Stalled (Last status: STATUS)
Details:
prcsName: The process name
runCntlId: The run control ID
oprid: The user ID that submitted the process
recurName: The recurrence definition name
lastInstance: The process instance number of the last run
lastRunStatus: The status of the last run (e.g. Success, Error)
lastRunDttm: The date and time the last run was scheduled
Configuration
alerts:checks:stalled_recurrences:enabled:truelookbackHours:336# How far back to look for completed runs (14 days)
Setting
Default
Description
lookbackHours
336
How many hours back to look for the last completed run of a recurrence.
How to Respond
Click the link in the alert detail to view the last process instance in the Process Monitor.
Check the logs for that instance if the status was an error.
If the recurrence should continue running, go to PeopleSoft and submit the process again on the same recurrence name using the matching User ID and Run Control ID.
If the recurrence has intentionally finished its life cycle (e.g., reached its end date), you can ignore the warning or configure the process in the exclusions list.
✨ Apply to join the psLens Design Partner Program — early access, dedicated setup, and your requests set the build order.
Apply Now →