psLens provides two operational monitoring dashboards to keep track of the background activity and integration health of your PeopleSoft environments in real time.
Process Monitor — Monitor running, queued, and recently completed Process Scheduler requests.
Process Heatmap — Analyze historical Process Scheduler density and peak utilization windows.
IB Monitor — Track real-time message traffic, publication contracts, and subscription contracts flowing through the PeopleSoft Integration Broker.
1 - Process Heatmap
The Process Heatmap plots historical Process Scheduler activity as a day-of-week by hour-of-day grid, so you can see when the scheduler is busy.
Process Heatmap
The Process Heatmap plots historical Process Scheduler activity as a day-of-week by hour-of-day grid, so you can see when the scheduler is busy. Use it to find peak hours, scheduler idle windows, and times when a specific job actually runs.
The Process Heatmap dashboard visualizes hourly processing density to highlight peak scheduling windows.
Key Features
Density Visualization:
Each cell represents a specific hour of a specific day (e.g., Monday at 2:00 PM). The cell color ranges from light (low volume) to dark/vibrant (high volume).
Interactive Filters:
Database: Switch between your configured databases to compare load across PROD, TEST, or DEV.
Lookback Window: Select the historical date range to include in the calculation (e.g., Last 7 Days, Last 30 Days, or Last 90 Days).
Process Type / Name: Filter the heatmap to specific process types (e.g., Application Engines, SQR Reports) or individual process definitions to see when a specific job runs most frequently.
Hourly Breakdown:
Hovering over any cell reveals the exact number of processes that started, ran, or completed within that specific hour.
Use Cases
Batch Window Planning:
When scheduling a new, resource-intensive batch process, use the heatmap to find the quietest hours (lightest cells) to avoid system slowdowns or resource conflicts.
Peak Utilization Audit:
Identify when the Process Scheduler experiences maximum concurrency. If the grid is consistently dark during specific hours, it may explain CPU spikes or queue delays.
Scheduler Drift and Efficiency:
Check whether the overnight job actually ran overnight, or slipped into the workday.
2 - Process Monitor
The Process Monitor shows process requests that have run or are currently running.
Process Monitor
URL:/processmonitor
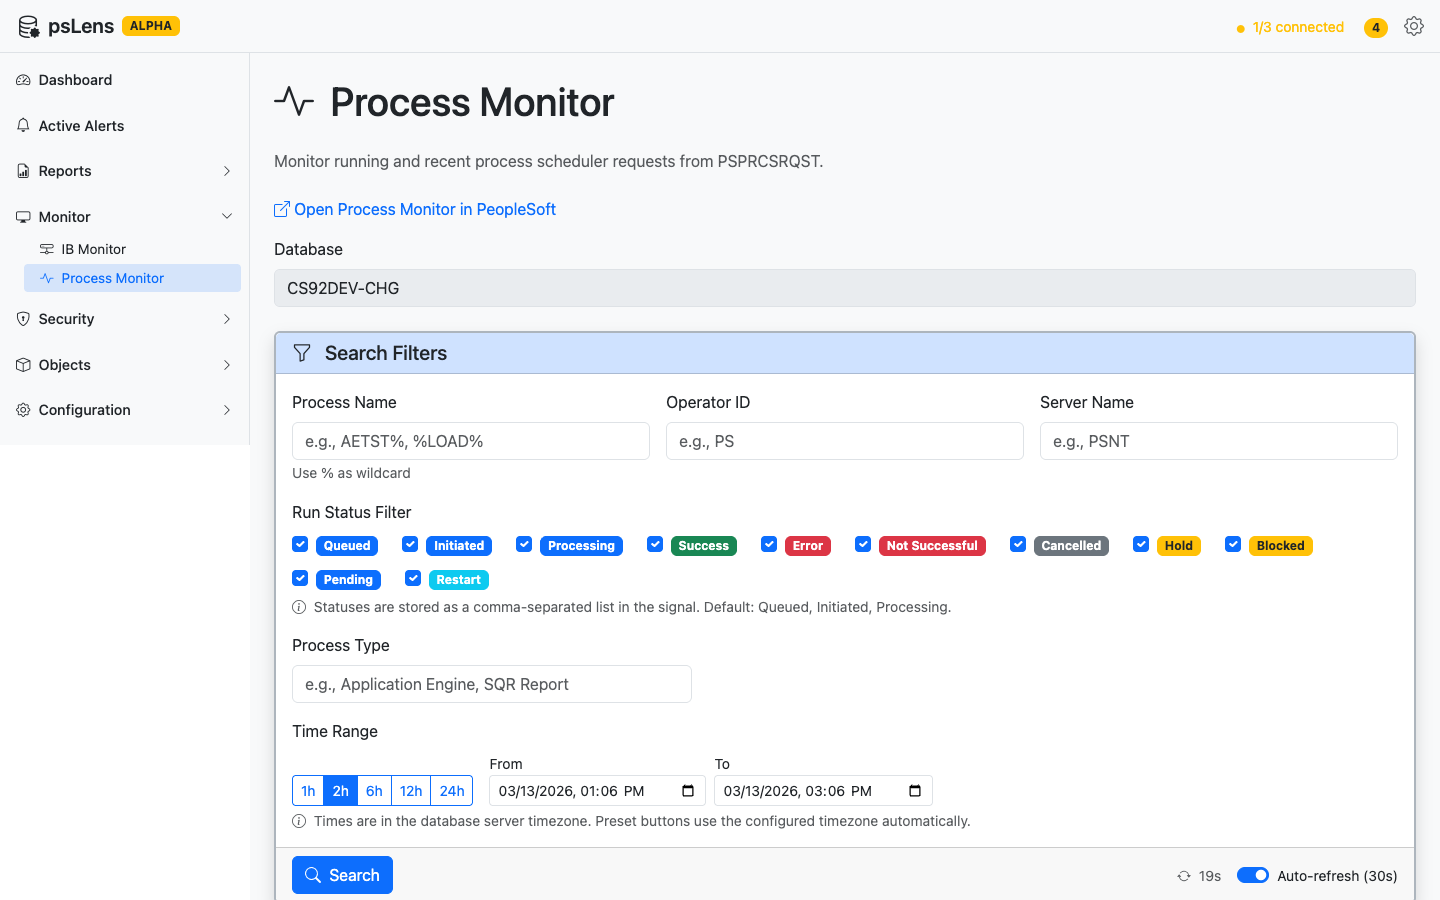
The Process Monitor shows process requests that have run or are currently running. This is the main operational view for the Process Scheduler — open it to see what is running, queued, or recently failed.
Process Monitor with search filters, timeline visualization, statistics, and process request details
What You Can Do
View Active and Queued Jobs: See running process requests (Initiated and Processing status) and queued or recently completed requests.
Filter and Search: Filter by process name, user, status, date range, and start delay threshold.
Monitor Start Delays and Queue Lag: View start delays (the difference between scheduled and actual begin times) highlighted directly in the results table. Filter the view to only show delayed processes, view aggregate start delay statistics, and see queue wait times plotted visually as warning-colored bars preceding process execution on the timeline.
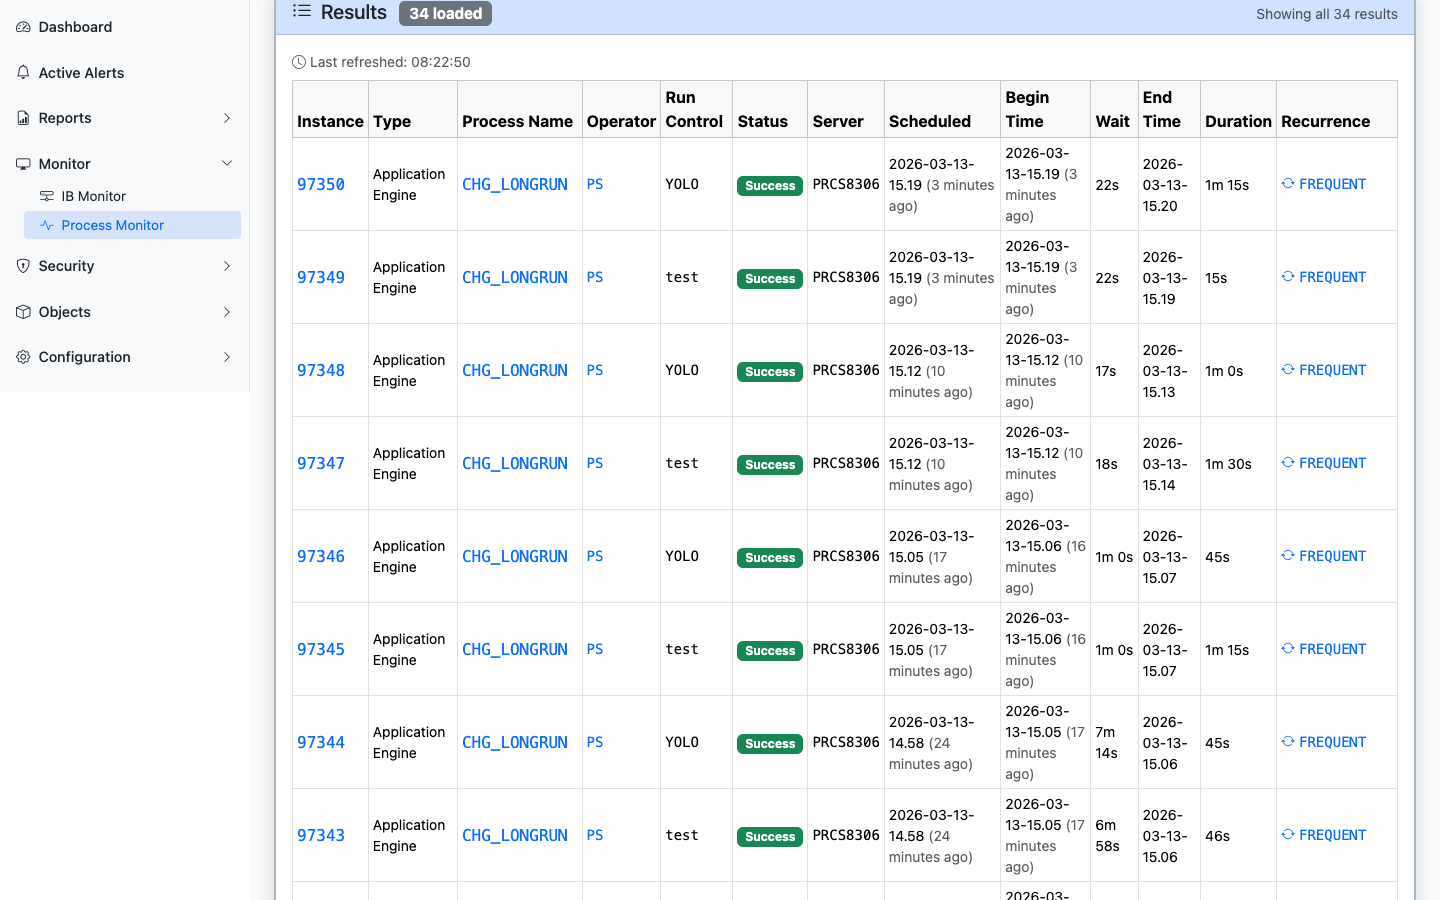
Drill Into Details: Click a process instance to see its full details: status, run dates, server, output, and log information.
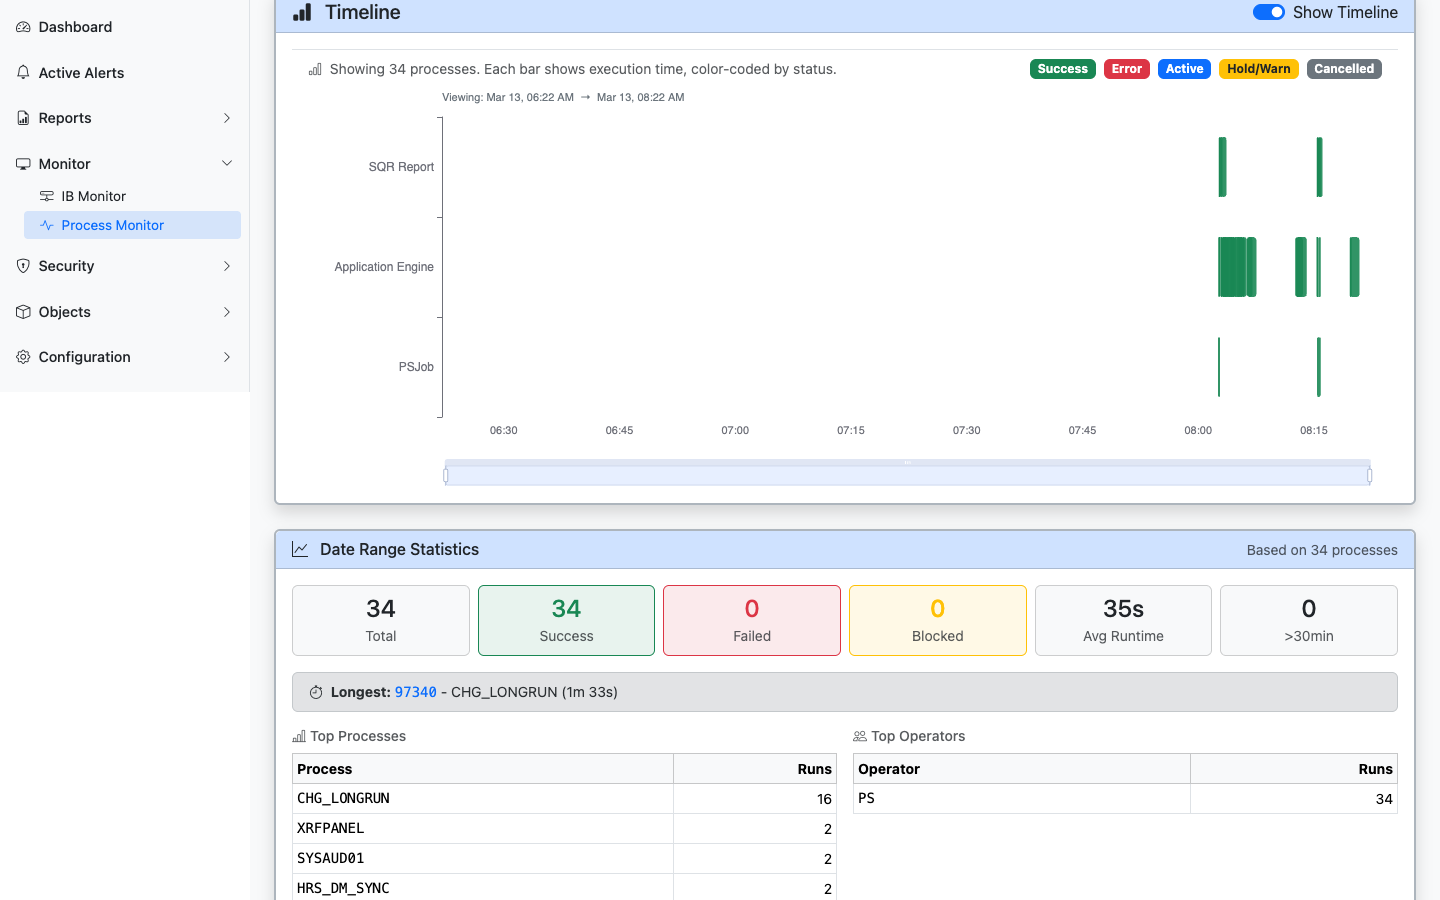
Timeline visualization with color-coded execution bars, date range statistics, top processes, and top operators
Process request results with clickable links to process instances, definitions, operators, and recurrences
When It’s Useful
Checking whether a scheduled process ran successfully.
Investigating a process failure (the detail view shows status codes and timing).
Seeing what is currently running on a server.
Responding to a Long-Running Processes alert from the dashboard.
Process Status Reference
Status
Meaning
Queued
Waiting to be picked up by a Process Scheduler server
Initiated
Server has picked up the request and is starting the process
Processing
Process is actively running
Success
Process completed successfully
Error
Process ended with an error condition
Not Successful
Process ran but reported a non-success result
Unable to Post
Output could not be delivered
Cancelled
Process was cancelled before it completed
Alerts for Process Scheduler
Two alert types monitor the Process Scheduler automatically:
Long-Running Processes — Flags processes that have been running longer than the configured threshold.
Process Errors — Finds processes that have failed within the lookback window.
When these alerts fire, the dashboard shows them with direct links to the relevant Process Monitor entries.
3 - IB Monitor
The IB Monitor shows the real-time status of PeopleSoft Integration Broker message traffic.
IB Monitor
URL:/ibmonitor
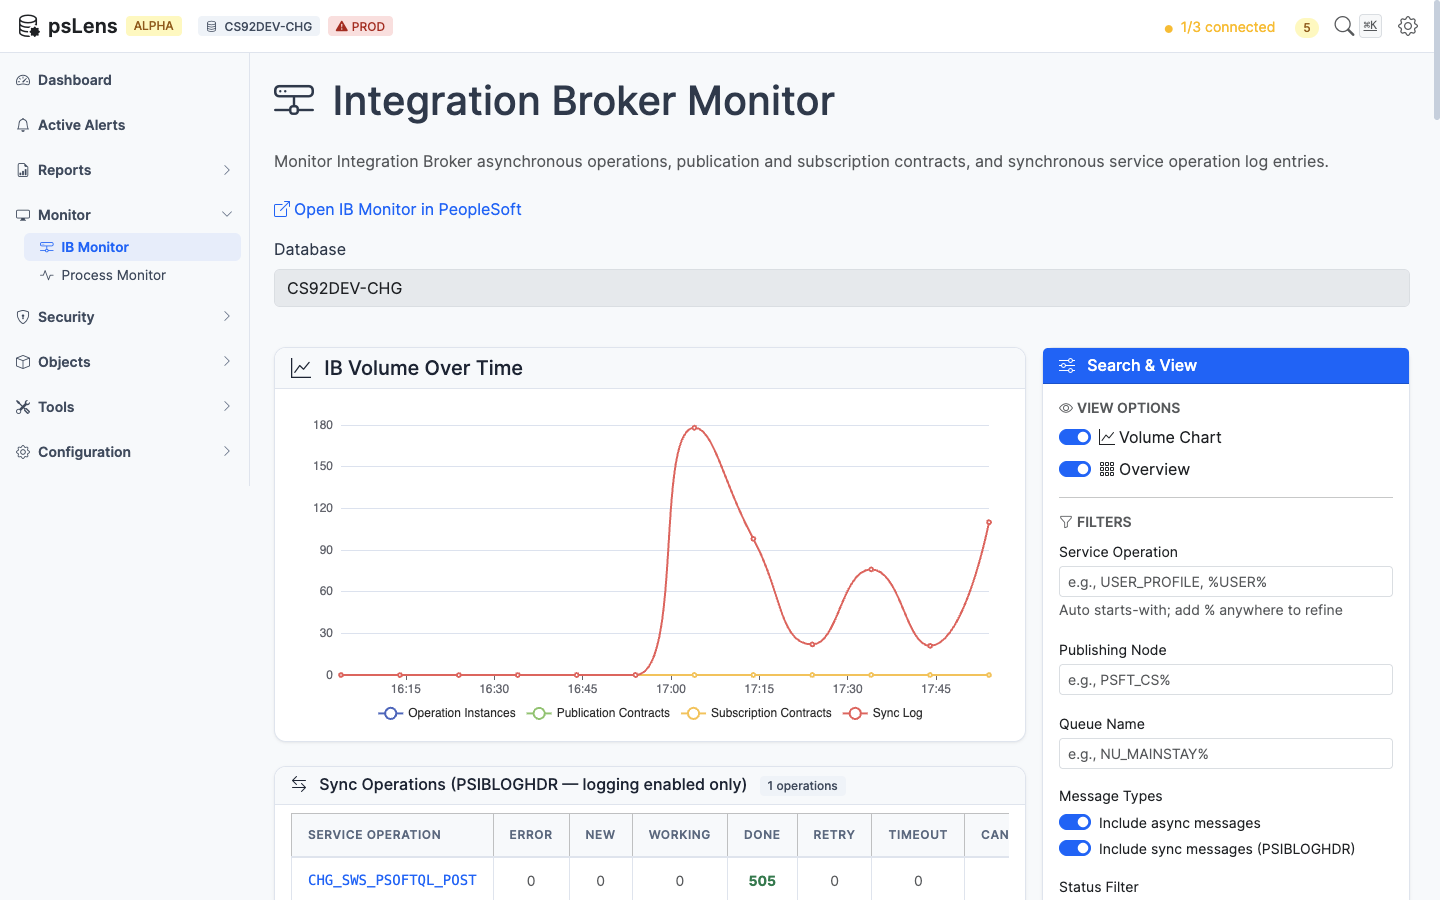
The IB Monitor shows the real-time status of PeopleSoft Integration Broker message traffic. Open it when an integration is failing or messages aren’t moving.
Integration Broker Monitor with status filters, time range selection, and operation/contract tabs