Process Scheduler
Process Scheduler alerts: long-running processes, process errors, backlogged processes, queue latency, locked operators, and critical process monitoring.
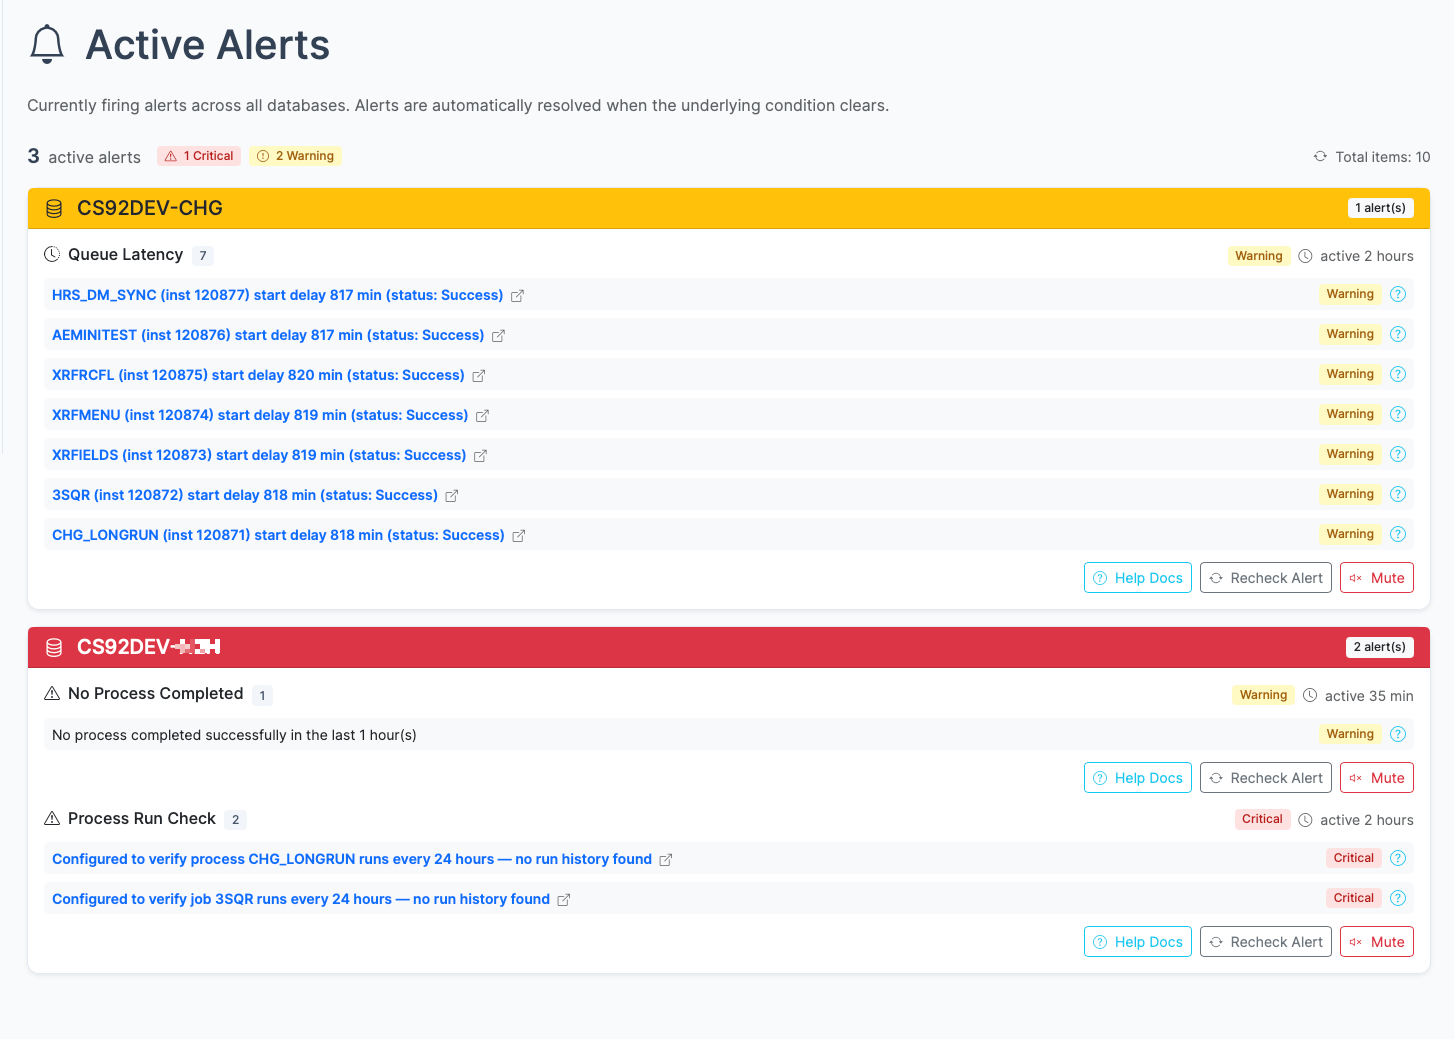
Alert checks run on a 5-minute timer against every connected database. Findings appear on the dashboard with severity, and clear automatically when the underlying condition resolves. There is no acknowledge or dismiss.
Alerts surface on the dashboard with severity and context, then hand the operator into the exact follow-up view
Alerts always reflect the current state of the system.
| Severity | Color | Meaning |
|---|---|---|
| Critical | Red | Something is actively wrong and needs immediate attention |
| Warning | Yellow | Something should be investigated. It may become a problem. |
| Info | Blue | Low-priority finding; worth noting but not urgent |
Alert results are stored for 15 minutes. This means the dashboard shows findings from the most recent check cycle. Once an issue is resolved and the next check runs cleanly, the alert data expires.
Alerts are configured in config.yaml. You can:
alerts.enabled)alerts.intervalMinutes)See Configuration for the full configuration reference.
Browse alerts by category:
The catalog tells you what psLens checks. A live walkthrough shows what matters operationally: how alerts appear, how they clear, and how quickly your team can move from a card on the dashboard to the underlying problem.
Process Scheduler alerts: long-running processes, process errors, backlogged processes, queue latency, locked operators, and critical process monitoring.
Integration Broker alerts: operation errors, contract errors, stalled messages, abnormal volume detection, and sync exceptions.
Security alerts: failed login detection and authentication monitoring.
psLens POSTs to one or more configured WebLib or IScript URLs every check cycle.
Generic SWS Alerts let you define alert checks in YAML using PsoftQL queries against whitelisted PeopleSoft records.