System Overview
Categories:
System Overview
The home screen of psLens (System Overview) gives you a quick health overview of all your connected PeopleSoft databases, with a focus on anything that currently needs attention.
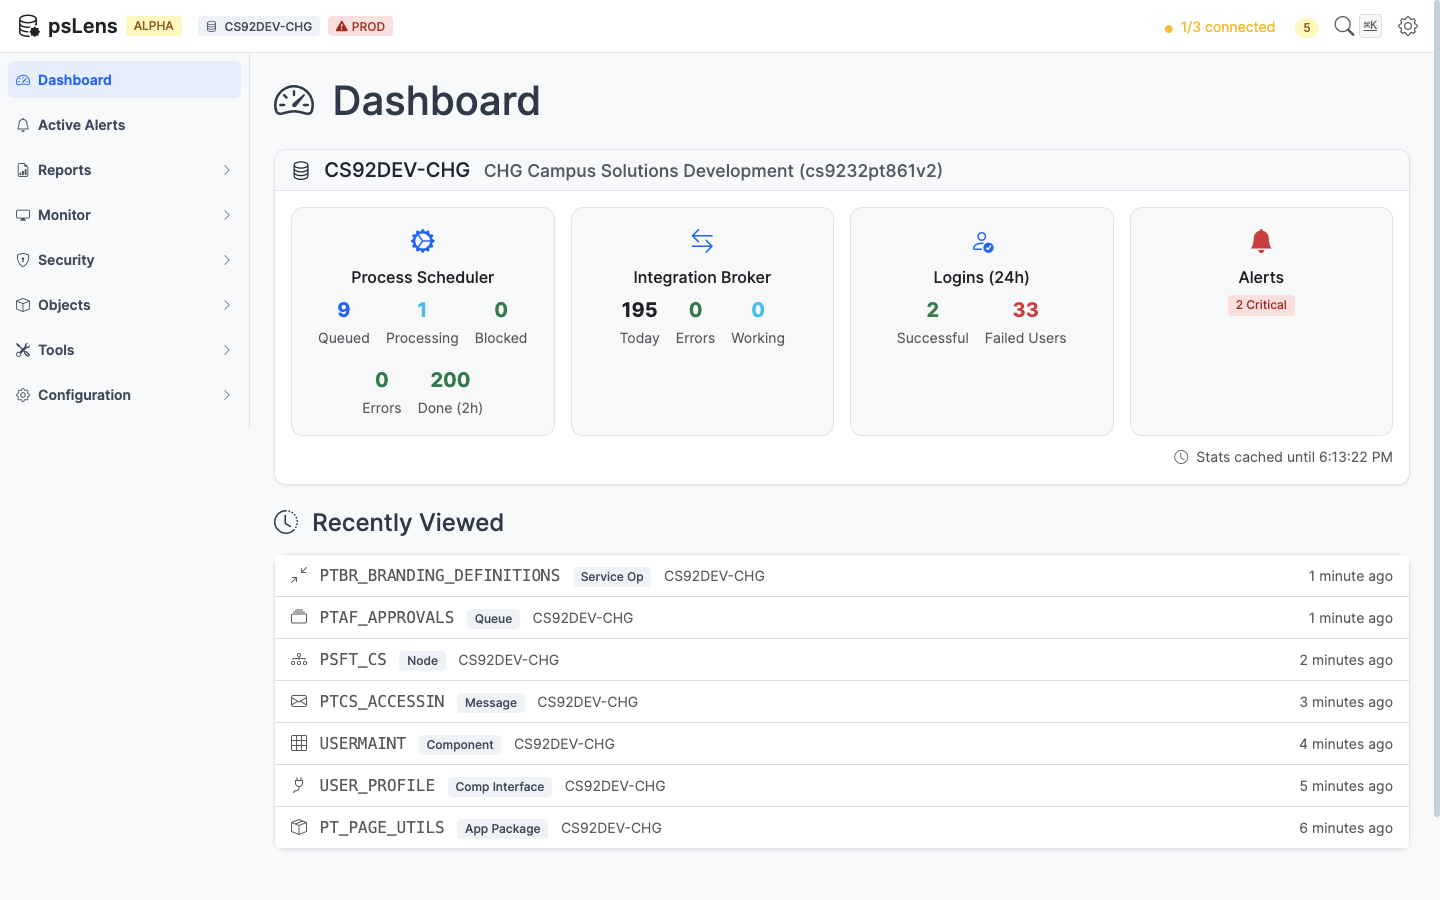
The psLens dashboard showing database connection status and active alerts
What You See on the Dashboard
Alert Summary
The top section of the dashboard shows active alerts grouped by database. Each alert card tells you:
- What type of issue was found (for example, long-running processes or IB errors)
- How many items were found in this check
- When the check last ran
- A link to the relevant monitor page for more detail
Alerts are color-coded by severity:
| Color | Severity | Meaning |
|---|---|---|
| Red | Critical | Immediate attention recommended |
| Yellow | Warning | Should be investigated |
| Blue | Info | Low priority, worth noting |
If there are no active alerts, the dashboard shows an “all clear” state.
Database Connection Status
The dashboard also shows whether psLens can connect to each configured database. A database that is unreachable will still show in the list but will be marked as disconnected. Alerts for a disconnected database won’t run until the connection is restored.
How Alerts Are Refreshed
The dashboard uses a live connection to the psLens server. Alert results are updated automatically on the page as new check results arrive — you do not need to manually refresh.
Alert checks run on a background schedule (default: every 5 minutes). The timestamp on each alert card shows when that specific check last completed.
Navigating from the Dashboard
Each alert item on the dashboard has a direct link to the relevant page in psLens. For example:
- A long-running process alert links to the Process Monitor entry for that process instance
- An IB operation error alert links to the IB Monitor entry for that operation
- A process error alert links to the Process Monitor entry for that process
Dismissing Alerts
Alert results are automatically cleared when the underlying issue resolves. For example, if a long-running process finishes, its alert disappears from the dashboard on the next check cycle. There is no manual dismiss — the alerts always reflect the current state of the system.
Alert Configuration
Alerts are configured in config.yaml. You can enable or disable individual alert types, adjust thresholds, and exclude specific processes or operations. See Configuration and Alerts for details.