Process Monitor
The Process Monitor shows process requests that have run or are currently running.
Categories:
Process Monitor
URL: /processmonitor
The Process Monitor shows process requests that have run or are currently running. This is the main operational view for the Process Scheduler — open it to see what is running, queued, or recently failed.
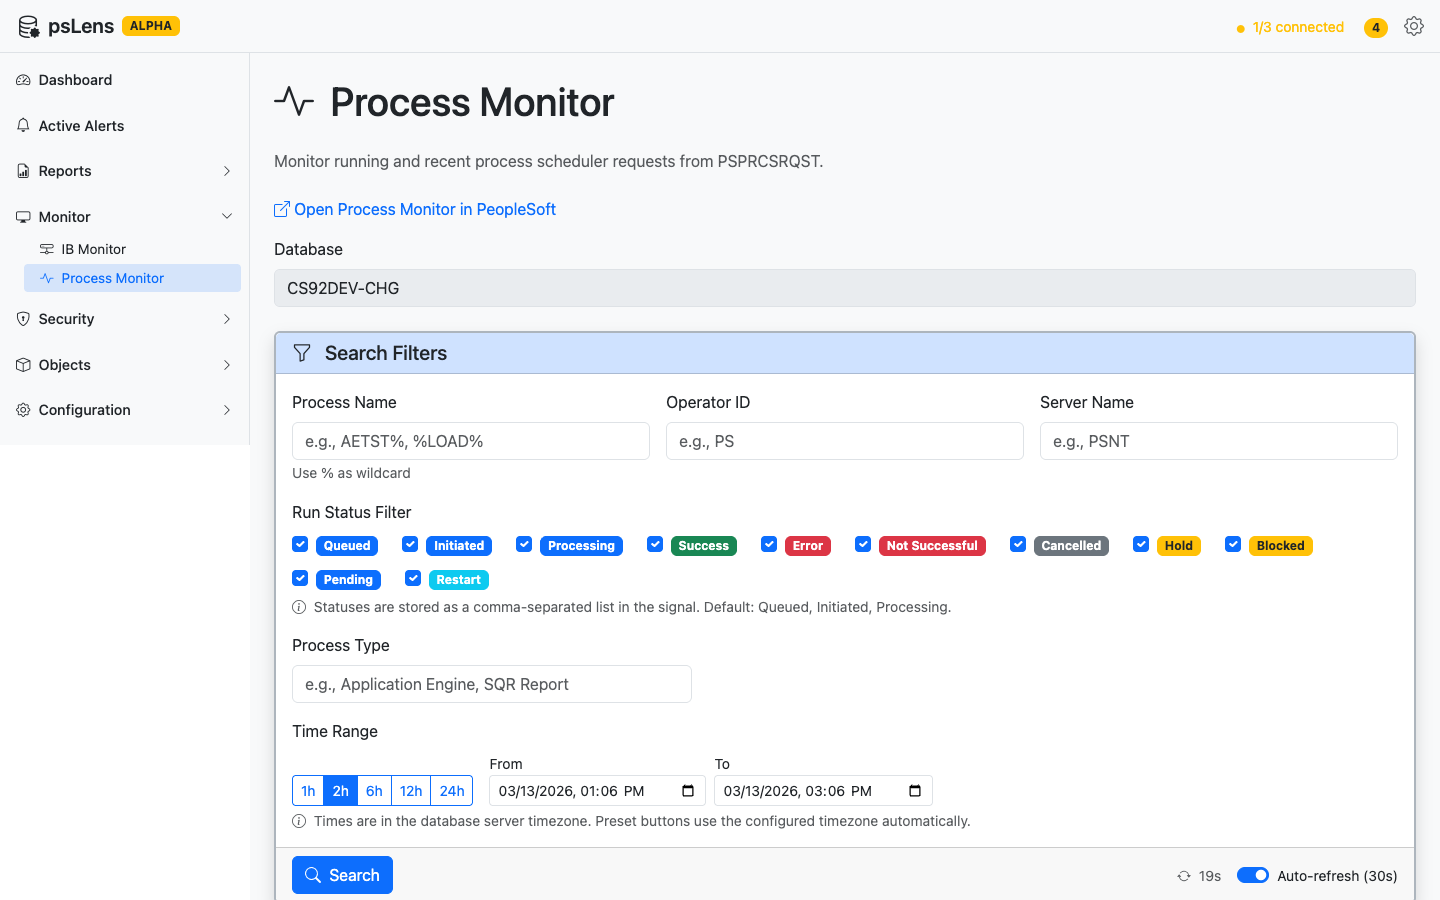
Process Monitor with search filters, timeline visualization, statistics, and process request details
What You Can Do
- View Active and Queued Jobs: See running process requests (Initiated and Processing status) and queued or recently completed requests.
- Filter and Search: Filter by process name, user, status, date range, and start delay threshold.
- Monitor Start Delays and Queue Lag: View start delays (the difference between scheduled and actual begin times) highlighted directly in the results table. Filter the view to only show delayed processes, view aggregate start delay statistics, and see queue wait times plotted visually as warning-colored bars preceding process execution on the timeline.
- Drill Into Details: Click a process instance to see its full details: status, run dates, server, output, and log information.
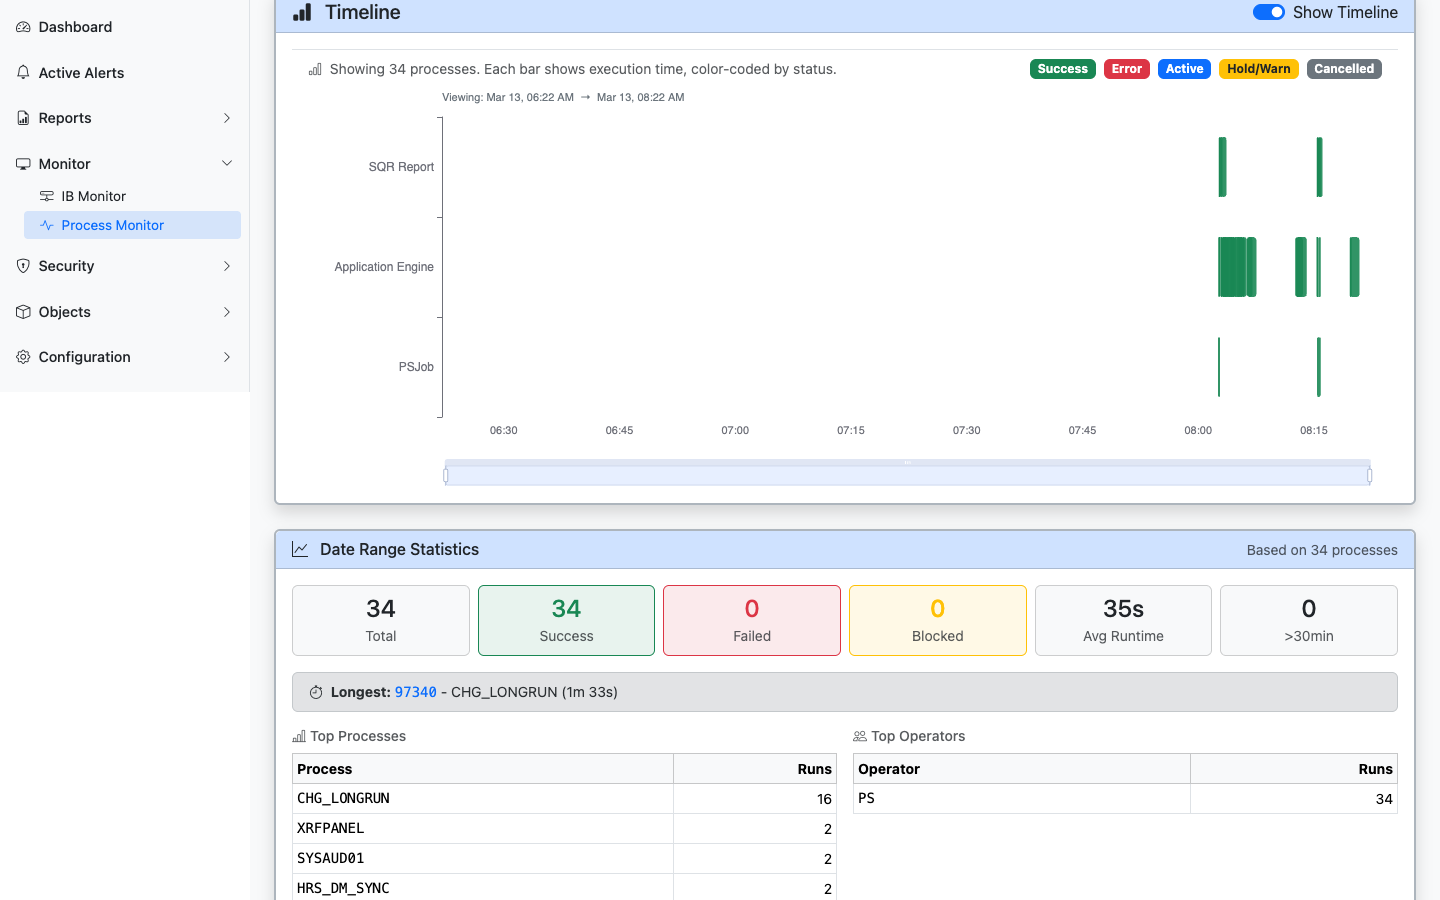
Timeline visualization with color-coded execution bars, date range statistics, top processes, and top operators
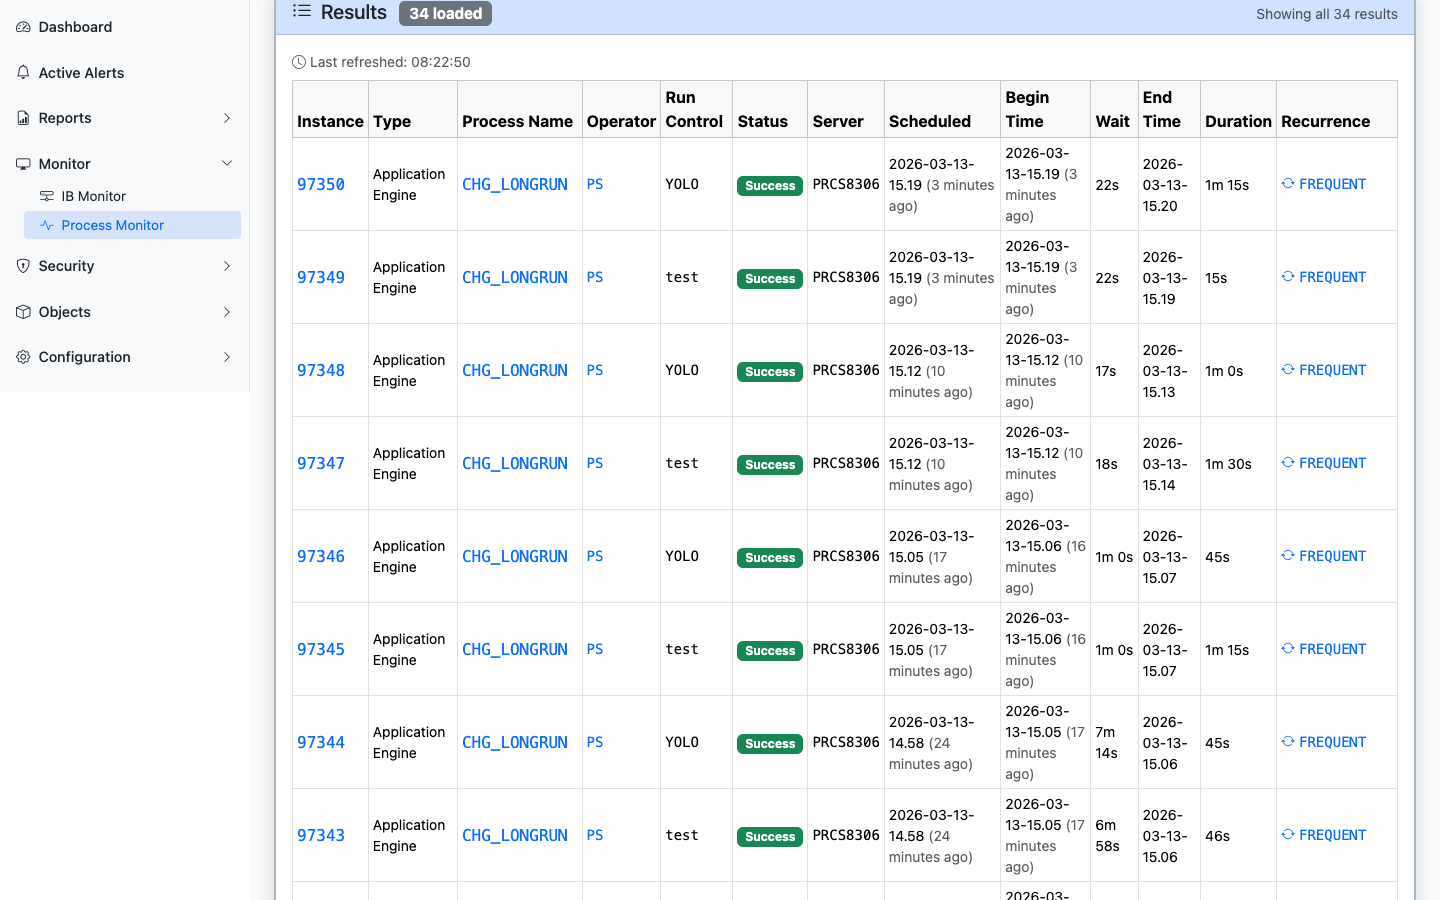
Process request results with clickable links to process instances, definitions, operators, and recurrences
When It’s Useful
- Checking whether a scheduled process ran successfully.
- Investigating a process failure (the detail view shows status codes and timing).
- Seeing what is currently running on a server.
- Responding to a Long-Running Processes alert from the dashboard.
Process Status Reference
| Status | Meaning |
|---|---|
| Queued | Waiting to be picked up by a Process Scheduler server |
| Initiated | Server has picked up the request and is starting the process |
| Processing | Process is actively running |
| Success | Process completed successfully |
| Error | Process ended with an error condition |
| Not Successful | Process ran but reported a non-success result |
| Unable to Post | Output could not be delivered |
| Cancelled | Process was cancelled before it completed |
Alerts for Process Scheduler
Two alert types monitor the Process Scheduler automatically:
- Long-Running Processes — Flags processes that have been running longer than the configured threshold.
- Process Errors — Finds processes that have failed within the lookback window.
When these alerts fire, the dashboard shows them with direct links to the relevant Process Monitor entries.