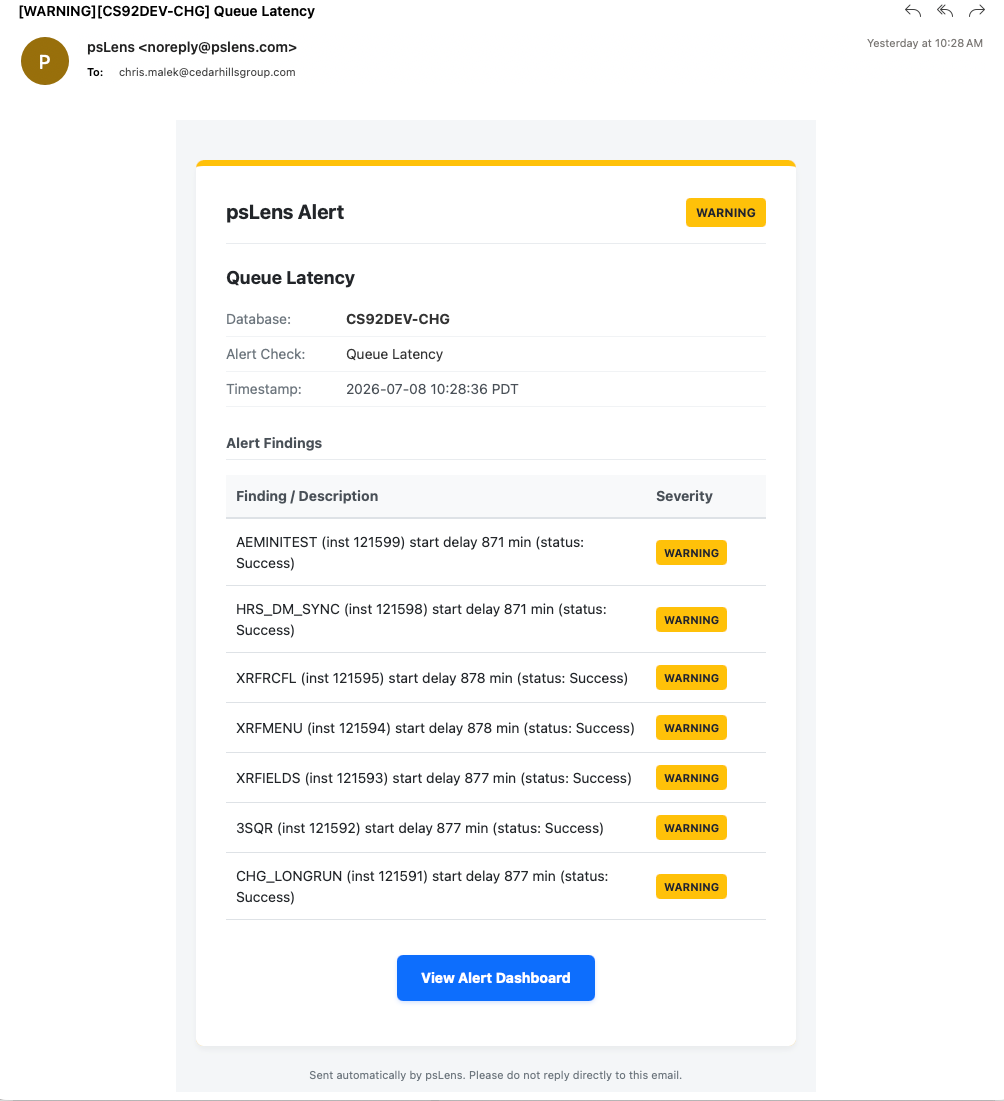
# Queue Latency

LLMS index: [llms.txt](/llms.txt)

---

<div class="alert alert-warning border shadow-sm mb-4" role="note">
  <div class="d-flex flex-column flex-lg-row align-items-lg-center justify-content-between gap-3">
    <div>
      <strong>New to psLens?</strong> This page documents one specific alert. To see how it appears on the dashboard,
      what operators investigate, and how teams tune it, start with a live walkthrough.
    </div>
    <div class="d-flex flex-wrap gap-2">
      <a class="btn btn-sm btn-primary" href="/contact/">Book a Demo</a>
      <a class="btn btn-sm btn-outline-primary" href="/docs/alerts/">Browse Alerts</a>
    </div>
  </div>
</div><div id="pslens-context-panel" class="card border-info mb-4 d-none">
  <div class="card-header bg-light text-info py-2 fw-bold d-flex align-items-center border-bottom border-info-subtle">
    <i class="bi bi-info-circle-fill me-2"></i>
    <span>Tailored Operational Context</span>
  </div>
  <div class="card-body p-0">
    <ul class="list-group list-group-flush">
      <li id="row-db" class="list-group-item d-flex align-items-center justify-content-between py-2 d-none">
        <strong>Target Database:</strong>
        <span id="ctx-db" class="badge bg-secondary font-monospace">&mdash;</span>
      </li>
      <li id="row-type" class="list-group-item d-flex align-items-center justify-content-between py-2 d-none">
        <strong>Context Type:</strong>
        <span id="ctx-type" class="badge bg-light text-dark border font-monospace text-uppercase">&mdash;</span>
      </li>
      <li id="row-severity" class="list-group-item d-flex align-items-center justify-content-between py-2 d-none">
        <strong>Alert Severity:</strong>
        <span id="ctx-severity" class="badge">&mdash;</span>
      </li>
      <li id="row-time" class="list-group-item d-flex align-items-center justify-content-between py-2 d-none">
        <strong>Triggered Time:</strong>
        <span id="ctx-time" class="text-muted small">&mdash;</span>
      </li>
      <li id="row-details" class="list-group-item py-2 d-none">
        <strong id="label-details" class="d-block mb-1">Firing Context:</strong>
        <code id="ctx-details" class="d-block p-2 bg-light border rounded small"
          style="white-space: pre-wrap; word-break: break-all;">&mdash;</code>
      </li>
    </ul>
  </div>
</div>

<script>
  (function () {
    const params = new URLSearchParams(window.location.search);
    const metadata = params.get('metadata');
    if (!metadata) return;

    try {
      
      const base64 = metadata.replace(/-/g, '+').replace(/_/g, '/');
      const jsonStr = decodeURIComponent(escape(window.atob(base64)));
      const data = JSON.parse(jsonStr);

      if (data) {
        let hasData = false;

        if (data.db) {
          document.getElementById('ctx-db').textContent = data.db;
          document.getElementById('row-db').classList.remove('d-none');
          hasData = true;
        }

        if (data.type) {
          document.getElementById('ctx-type').textContent = data.type;
          document.getElementById('row-type').classList.remove('d-none');
          hasData = true;
        }

        if (data.severity) {
          const severityBadge = document.getElementById('ctx-severity');
          const severity = data.severity.toLowerCase();
          severityBadge.textContent = severity.toUpperCase();
          if (severity === 'critical') {
            severityBadge.className = 'badge bg-danger';
          } else if (severity === 'warning') {
            severityBadge.className = 'badge bg-warning text-dark';
          } else {
            severityBadge.className = 'badge bg-info';
          }
          document.getElementById('row-severity').classList.remove('d-none');
          hasData = true;
        }

        if (data.t) {
          const date = new Date(data.t * 1000);
          document.getElementById('ctx-time').textContent = date.toLocaleString();
          document.getElementById('row-time').classList.remove('d-none');
          hasData = true;
        }

        if (data.details) {
          document.getElementById('ctx-details').textContent = data.details;

          
          const labelDetails = document.getElementById('label-details');
          if (data.type === 'object') {
            labelDetails.textContent = 'Object Metadata Details:';
          } else if (data.type === 'report') {
            labelDetails.textContent = 'Report Description:';
          } else {
            labelDetails.textContent = 'Firing Context:';
          }

          document.getElementById('row-details').classList.remove('d-none');
          hasData = true;
        }

        if (hasData) {
          document.getElementById('pslens-context-panel').classList.remove('d-none');
        }
      }
    } catch (e) {
      console.error('Failed to parse operational context metadata:', e);
    }
  })();
</script>

## Queue Latency Alert

**Alert ID:** `queue_latency`
**Category:** Process Scheduler
**Default threshold:** 15 minutes

<figure><img src="/images/screenshots/queue-latency-alert.png"
    alt="Queue Latency Alert in psLens"><figcaption>
      <p>Queue Latency Alert in psLens showing processes with start delays exceeding the threshold</p>
    </figcaption>
</figure>


### What This Alert Detects

This page documents the queue latency alert, which monitors the delay between a process's scheduled run time and its actual start time. It queries the `PSPRCSRQST` table for processes that have started running or completed within the lookback window and calculates the delay as `BEGINDTTM - RUNDTTM`.

### Severity Logic

|                  Condition                  | Severity |
| ------------------------------------------- | -------- |
| Start delay more than `thresholdMinutes`     | Warning  |

For example, with the default threshold of 15 minutes:

- A process scheduled for 10:00 that started running at 10:20 → **Warning**

### What Gets Checked

The alert queries the Process Scheduler request table (`PSPRCSRQST`) for processes whose `BEGINDTTM` (begin datetime) is in the past lookback window (default 24 hours). For each process, it calculates the difference between `BEGINDTTM` and `RUNDTTM` (scheduled run datetime).

Processes that have not started running yet (empty `BEGINDTTM` value) are skipped. Active queuing checks are handled by the `backlogged_processes` alert.

### Alert Details

Each alert item includes:

- Process name (`PRCSNAME`)
- Process instance number
- Start delay duration (in minutes)
- Current run status (Initiated, Processing, Success, Error, etc.)
- The operator who submitted the request
- A link to the Process Monitor detail page for that instance

### Configuration

```yaml
alerts:
  checks:
    queue_latency:
      enabled: true
      thresholdMinutes: 15         # Minutes delay before flagging as Warning
      lookbackHours: 24            # Hours to look back for completed/running processes
      excludeProcesses:            # Process names to skip
        - LOW_PRIORITY_AE
```

|      Setting       | Default |                                                            Description                                                             |
| ------------------ | ------- | ---------------------------------------------------------------------------------------------------------------------------------- |
| `thresholdMinutes` | `15`    | Minutes of start delay before a process triggers a Warning alert.                                 |
| `lookbackHours`    | `24`    | Hours to look back for processes to verify.                                                                                        |
| `excludeProcesses` | `[]`    | List of process names to exclude from this check. Use for processes that are known to delay and are not a concern.                 |

### How to Respond

1. Click the alert link to go to the Process Monitor entry for the flagged process.
2. Review the process server definition to identify if it is running and accepting work.
3. Check the max concurrent limits configured on the Process Scheduler server or category definitions.
4. Verify if other higher-priority processes occupied all available channels.
5. If the delay is caused by category stalls, adjust the process class concurrency settings.

### Tuning the Threshold

Environments with heavy batch schedules may experience normal queue delays during peak hours. Set `thresholdMinutes` high enough to prevent alerts on minor delays but low enough to flag scheduler capacity bottlenecks or server category stalls.